| Param | Original file | Final file |
|---|---|---|
| Filename | modeM0/AS1A12_011T22_9000005492_39702cztM0_level2.fits | modeM0/AS1A12_011T22_9000005492_39702cztM0_level2_quad_clean.evt |
| Size (bytes) | 452,712,960 | 92,191,680 |
| Size | 431.7 MB | 87.9 MB |
| Events in quadrant A | 6,058,828 | 615,297 |
| Events in quadrant B | 2,802,895 | 638,228 |
| Events in quadrant C | 4,243,836 | 594,284 |
| Events in quadrant D | 3,218,655 | 551,975 |
| Mode M0 | |||
|---|---|---|---|
| Quadrant | BADHDUFLAG | Total packets | Discarded packets |
| A | 0 | 21979 | 3 |
| B | 0 | 12143 | 2 |
| C | 0 | 16317 | 2 |
| D | 0 | 13180 | 2 |
| Mode SS | |||
|---|---|---|---|
| Quadrant | BADHDUFLAG | Total packets | Discarded packets |
| A | 0 | 114 | 0 |
| B | 0 | 114 | 0 |
| C | 0 | 114 | 0 |
| D | 0 | 114 | 0 |
| Mode M9 | |||
|---|---|---|---|
| Quadrant | BADHDUFLAG | Total packets | Discarded packets |
| A | 0 | 23 | 0 |
| B | 0 | 23 | 0 |
| C | 0 | 23 | 0 |
| D | 0 | 24 | 0 |
| Quadrant | Total seconds | Saturated seconds | Saturation percentage |
|---|---|---|---|
| A | 5598 | 225 | 4.019293% |
| B | 5598 | 40 | 0.714541% |
| C | 5598 | 120 | 2.143623% |
| D | 5598 | 79 | 1.411218% |
Noise dominated data is calculated using 1-second bins in cleaned event files. If a bin has >2000 counts, and if more than 50% of those come from <1% of pixels, then it is considered to be noise-dominated and hence unusable.
| Quadrant | # 1 sec bins | Bins with >0 counts | Bins with >2000 counts | High rate bins dominated by noise | Noise dominated (total time) | Noise dominated (detector-on time) | Marked lightcurve |
|---|---|---|---|---|---|---|---|
| A | 7181 | 5599 | 158 | 158 | 2.20% | 2.82% | 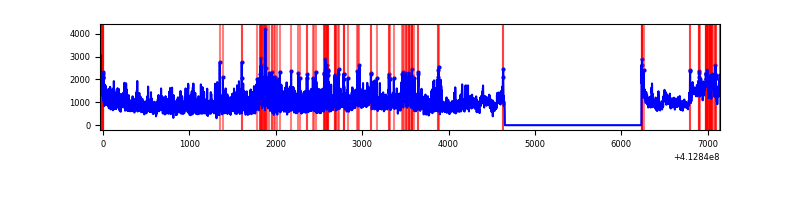 |
| B | 7181 | 5599 | 15 | 15 | 0.21% | 0.27% | 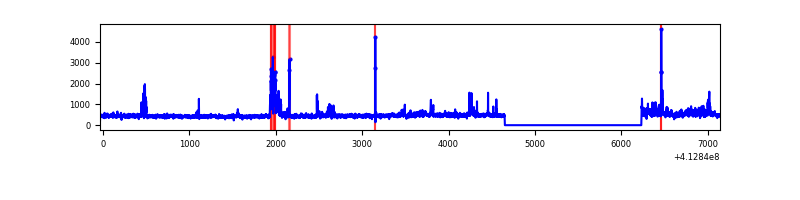 |
| C | 7181 | 5599 | 96 | 96 | 1.34% | 1.71% | 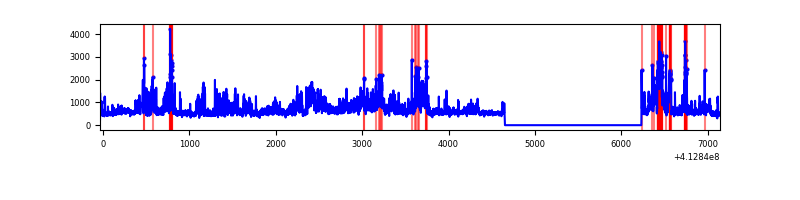 |
| D | 7181 | 5599 | 65 | 65 | 0.91% | 1.16% | 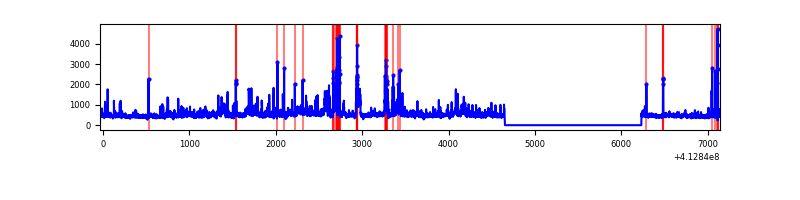 |
Top three noisy pixels from each quadrant. If the there are fewer than three noisy pixels in the level2.evt file, extra rows are filled as -1
| Pixel properties | Quadrant properties | ||||||
|---|---|---|---|---|---|---|---|
| Quadrant | DetID | PixID | Counts | Sigma | Mean | Median | Sigma |
| A | 15 | 222 | 2477707 | 19415.8 | 620 | 607 | 127.6 |
| A | 15 | 174 | 690615 | 5408.36 | 620 | 607 | 127.6 |
| A | 10 | 83 | 443975 | 3475.17 | 620 | 607 | 127.6 |
| B | 5 | 172 | 182339 | 1499.84 | 619 | 601 | 121.2 |
| B | 0 | 190 | 98099 | 804.63 | 619 | 601 | 121.2 |
| B | 5 | 255 | 62535 | 511.13 | 619 | 601 | 121.2 |
| C | 9 | 187 | 902750 | 6428.84 | 600 | 603 | 140.3 |
| C | 15 | 208 | 754823 | 5374.69 | 600 | 603 | 140.3 |
| C | 15 | 214 | 231525 | 1645.58 | 600 | 603 | 140.3 |
| D | 12 | 227 | 512112 | 3441.96 | 603 | 585 | 148.6 |
| D | 2 | 153 | 110330 | 738.45 | 603 | 585 | 148.6 |
| D | 2 | 249 | 84563 | 565.07 | 603 | 585 | 148.6 |
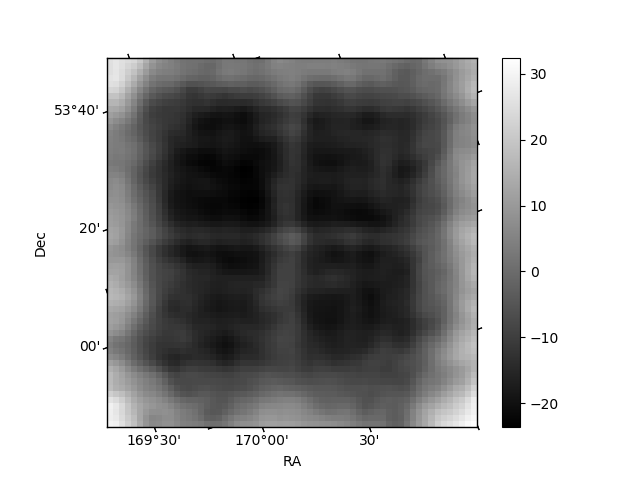
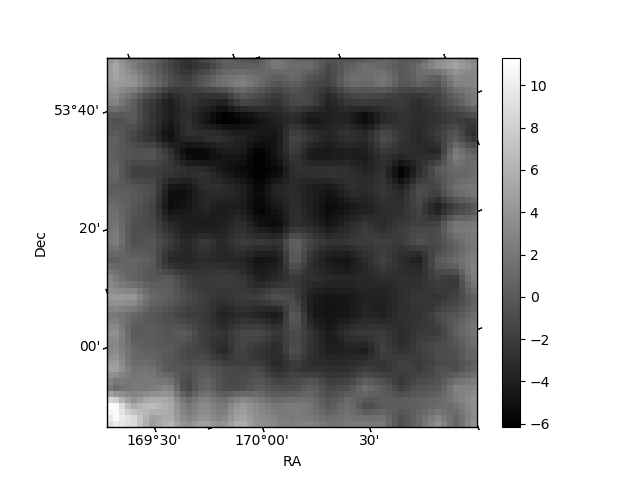
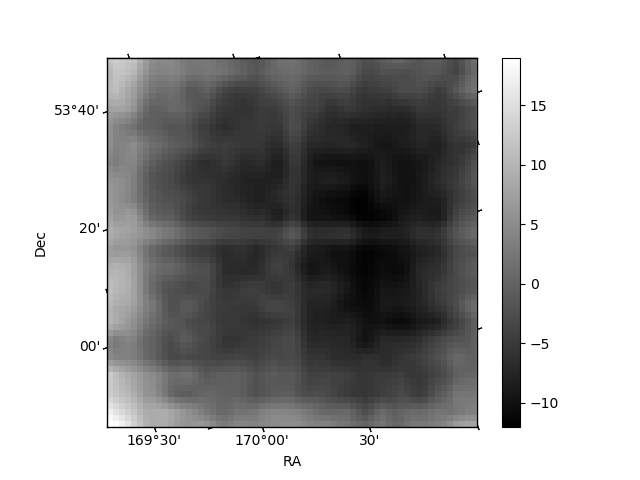
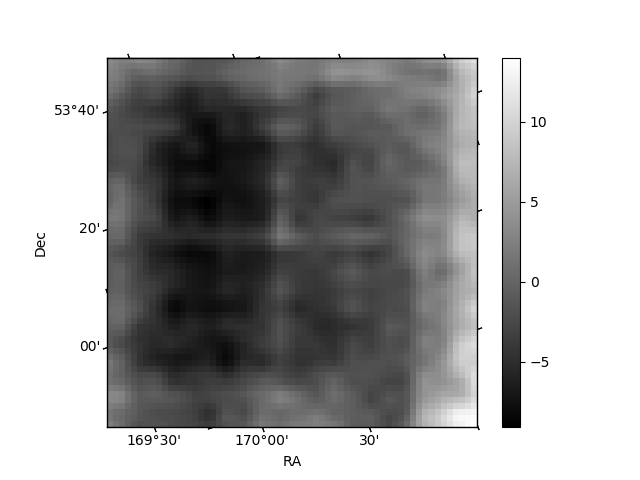
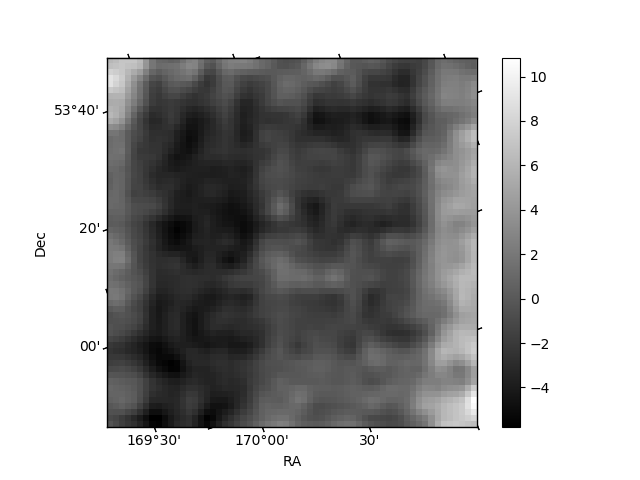
Histogram calculated using DETX and DETY for each event in the final _common_clean file
| Quadrant A | 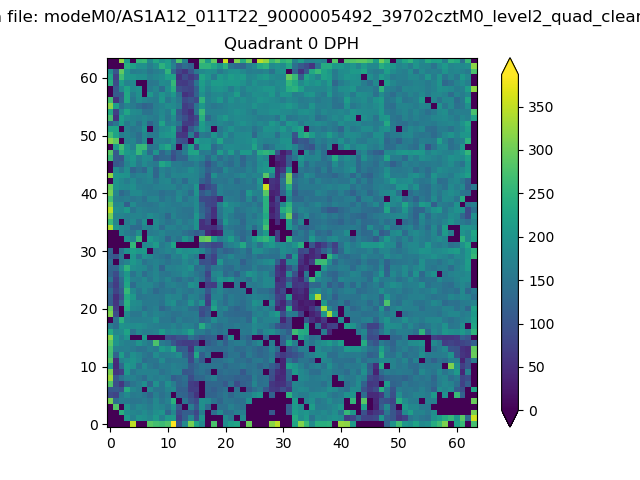 |
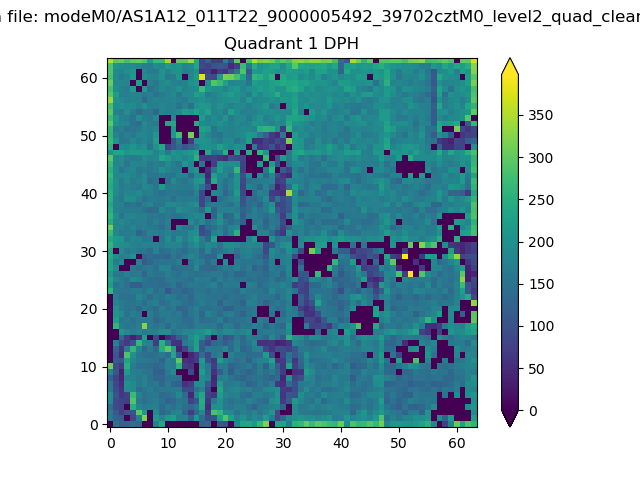 |
Quadrant B |
|---|---|---|---|
| Quadrant D | 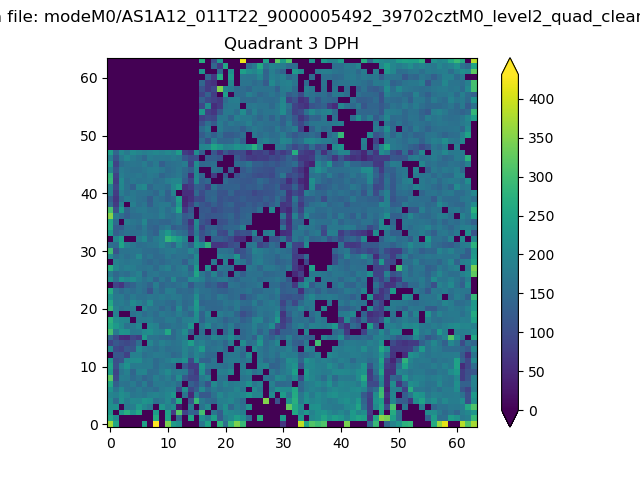 |
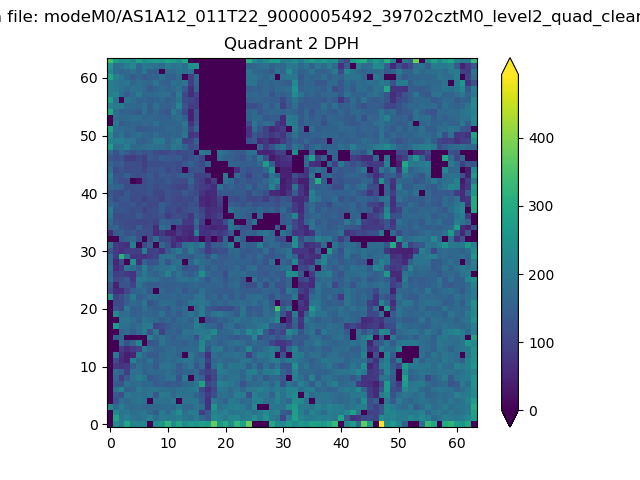 |
Quadrant C |
| Plot type | Count rate plots | Images |
|---|---|---|
| Comparison with Poisson distribution Blue bars denote a histogram of data divided into 1 sec bins. Red curve is a Poisson curve with rate = median count rate of data. |
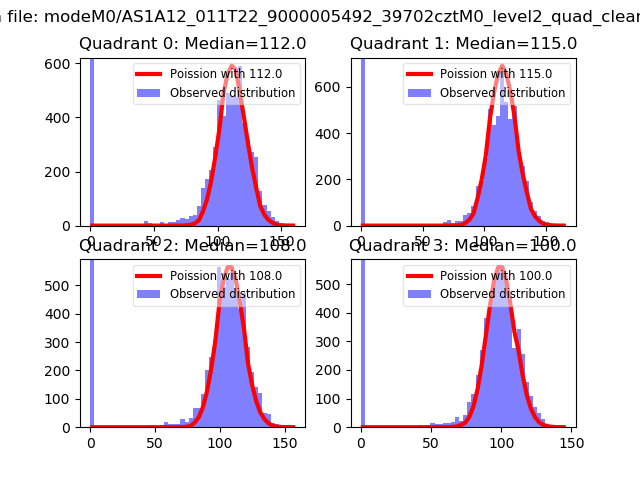 |
 |
| Quadrant-wise count rates Data is divided into 100 sec bins |
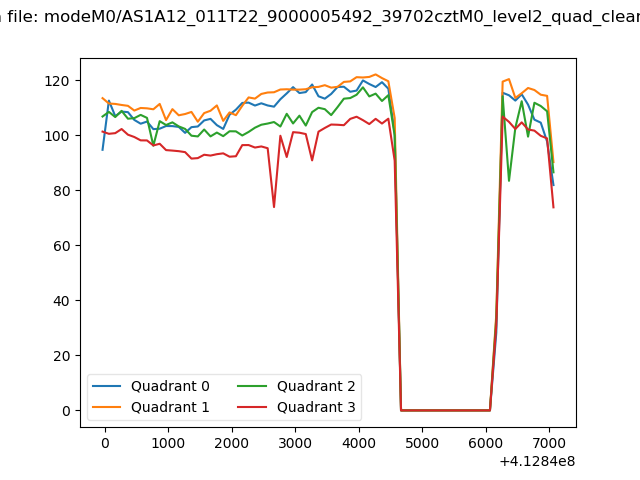 |
|
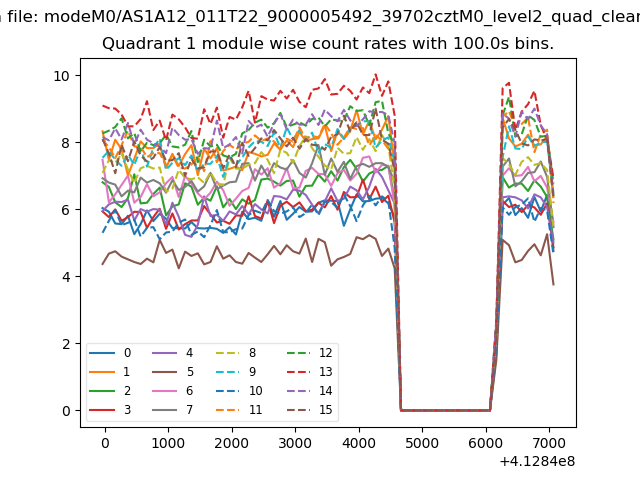
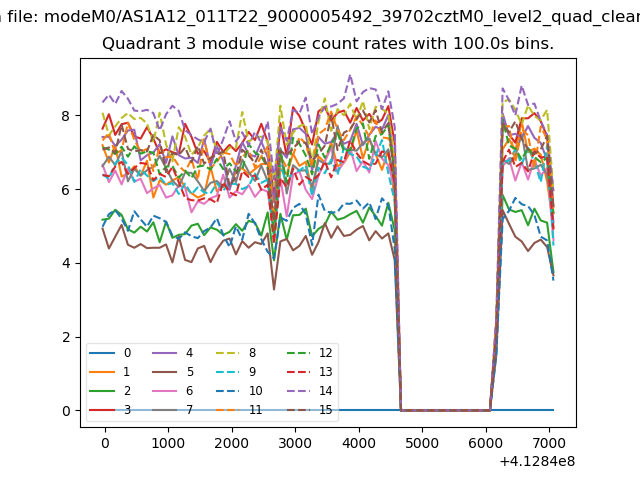
| Module-wise count rates for Quadrant A Data is divided into 100 sec bins |
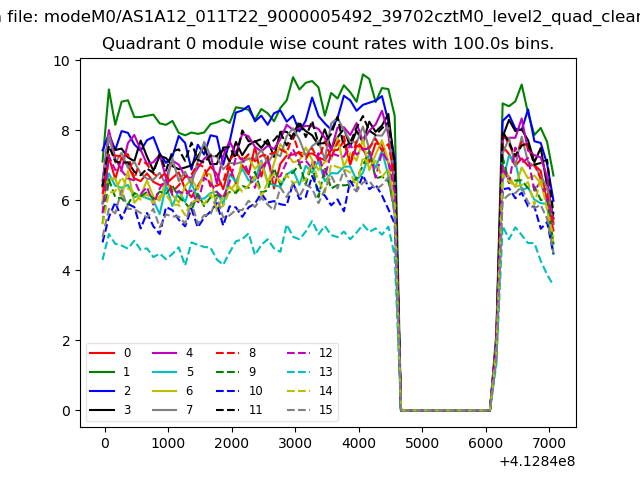 |
 |
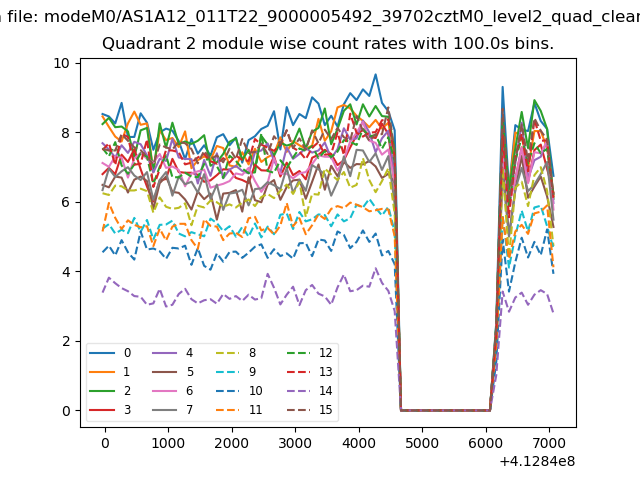
| Module-wise count rates for Quadrant B Data is divided into 100 sec bins |
 |
 |
| Module-wise count rates for Quadrant C Data is divided into 100 sec bins |
 |
 |
| Module-wise count rates for Quadrant D Data is divided into 100 sec bins |
 |
 |
| Parameter | Plot |
|---|---|
| CZT HV Monitor | 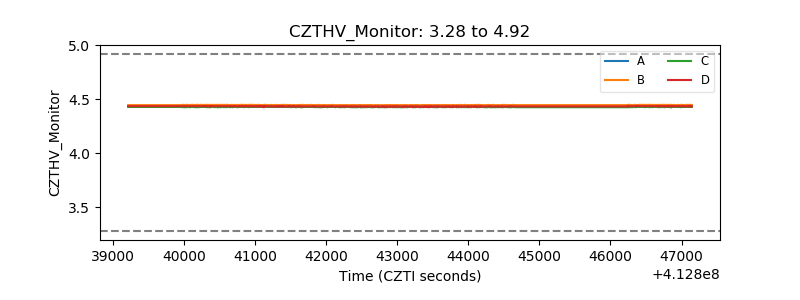 |
| D_VDD | 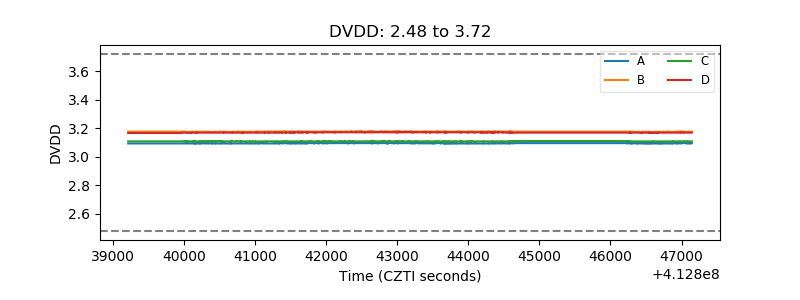 |
| Temperature 1 | 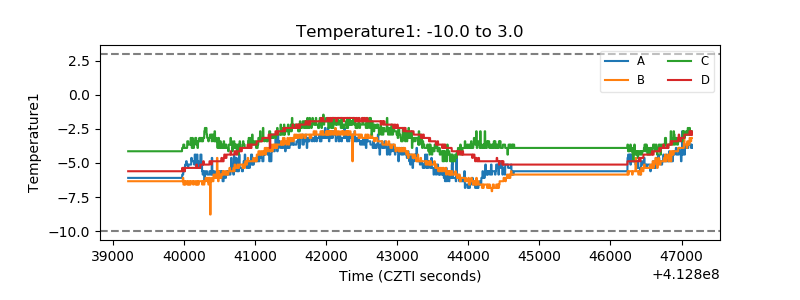 |
| Veto HV Monitor | 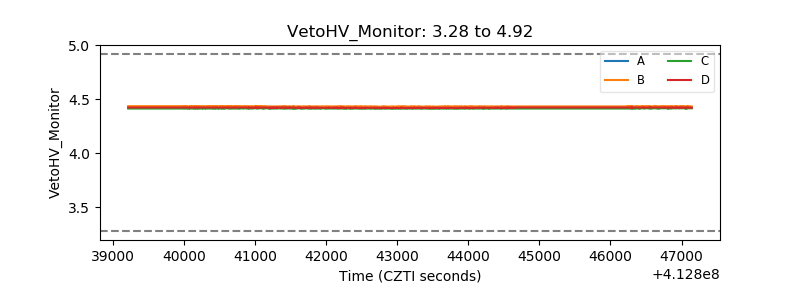 |
| Veto LLD | 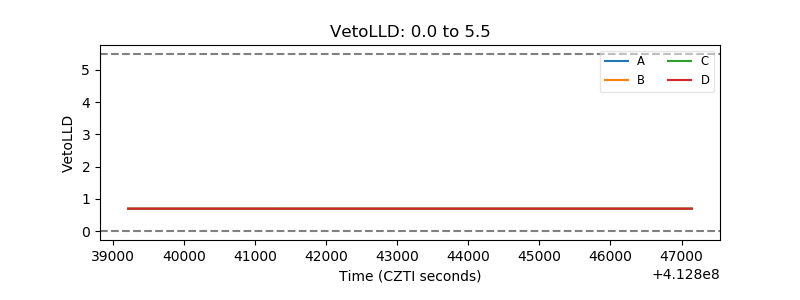 |
| Alpha Counter | 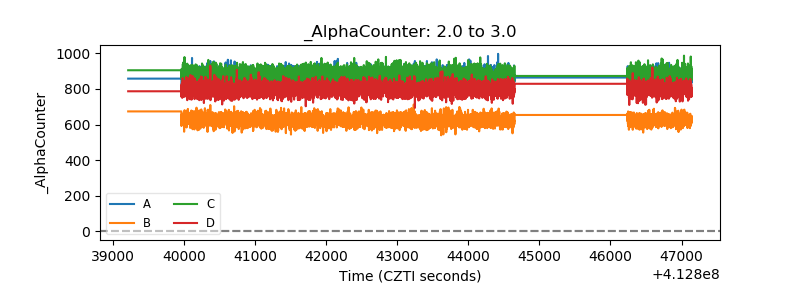 |
| _CPM_Rate | 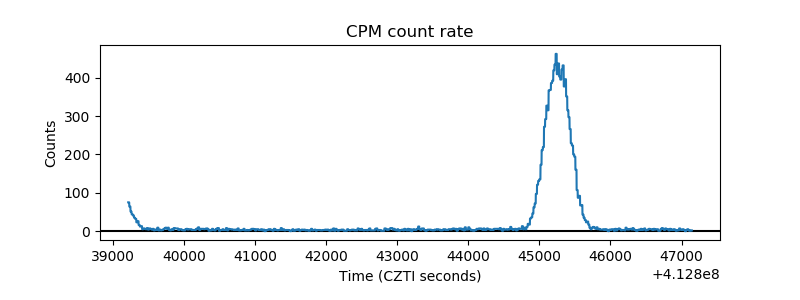 |
| CZT Counter | 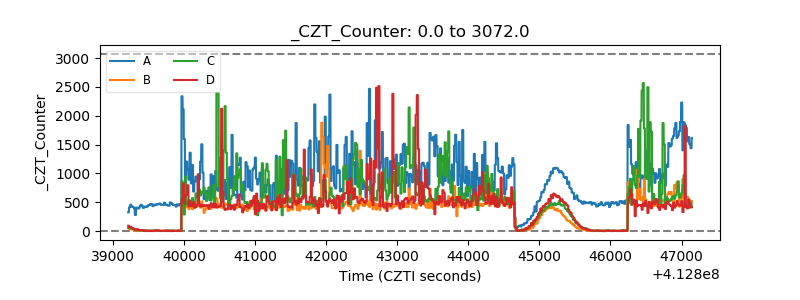 |
| +2.5 Volts monitor | 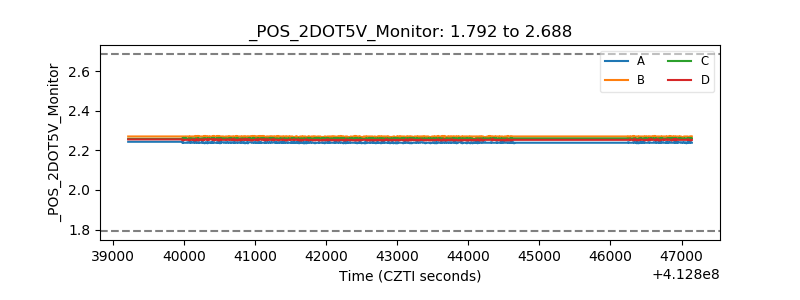 |
| +5 Volts monitor | 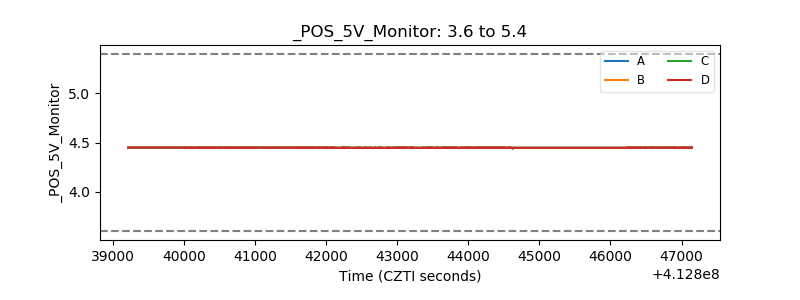 |
| _ROLL_ROT | 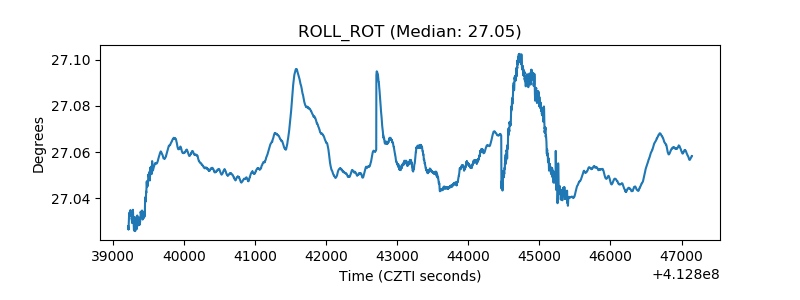 |
| _Roll_DEC | 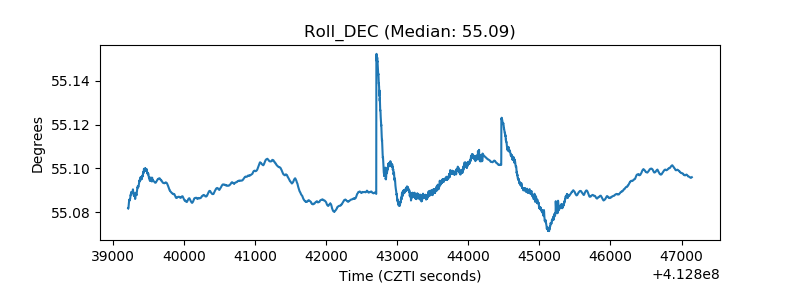 |
| _Roll_RA | 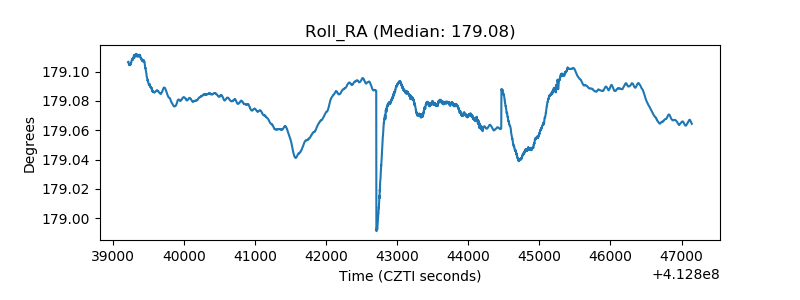 |
| Veto Counter | 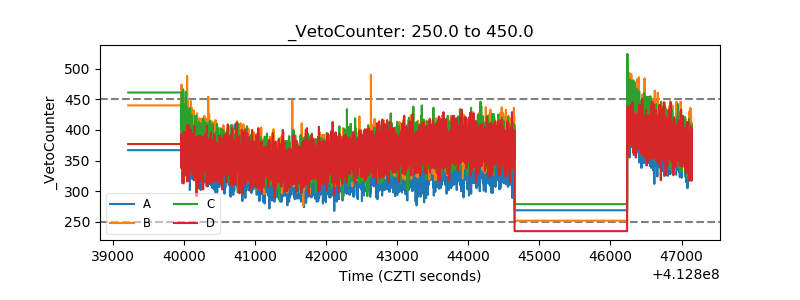 |