| Param | Original file | Final file |
|---|---|---|
| Filename | modeM0/AS1A12_011T22_9000005492_39704cztM0_level2.fits | modeM0/AS1A12_011T22_9000005492_39704cztM0_level2_quad_clean.evt |
| Size (bytes) | 452,145,600 | 94,173,120 |
| Size | 431.2 MB | 89.8 MB |
| Events in quadrant A | 5,812,569 | 641,204 |
| Events in quadrant B | 2,829,170 | 661,699 |
| Events in quadrant C | 4,099,130 | 608,618 |
| Events in quadrant D | 3,560,966 | 547,339 |
| Mode M0 | |||
|---|---|---|---|
| Quadrant | BADHDUFLAG | Total packets | Discarded packets |
| A | 0 | 21328 | 3 |
| B | 0 | 12118 | 2 |
| C | 0 | 15865 | 2 |
| D | 0 | 14199 | 2 |
| Mode SS | |||
|---|---|---|---|
| Quadrant | BADHDUFLAG | Total packets | Discarded packets |
| A | 0 | 116 | 0 |
| B | 0 | 116 | 0 |
| C | 0 | 116 | 0 |
| D | 0 | 116 | 0 |
| Mode M9 | |||
|---|---|---|---|
| Quadrant | BADHDUFLAG | Total packets | Discarded packets |
| A | 0 | 17 | 0 |
| B | 0 | 17 | 0 |
| C | 0 | 17 | 0 |
| D | 0 | 17 | 0 |
| Quadrant | Total seconds | Saturated seconds | Saturation percentage |
|---|---|---|---|
| A | 5607 | 255 | 4.547887% |
| B | 5607 | 40 | 0.713394% |
| C | 5607 | 156 | 2.782236% |
| D | 5607 | 318 | 5.671482% |
Noise dominated data is calculated using 1-second bins in cleaned event files. If a bin has >2000 counts, and if more than 50% of those come from <1% of pixels, then it is considered to be noise-dominated and hence unusable.
| Quadrant | # 1 sec bins | Bins with >0 counts | Bins with >2000 counts | High rate bins dominated by noise | Noise dominated (total time) | Noise dominated (detector-on time) | Marked lightcurve |
|---|---|---|---|---|---|---|---|
| A | 7340 | 5608 | 188 | 188 | 2.56% | 3.35% | 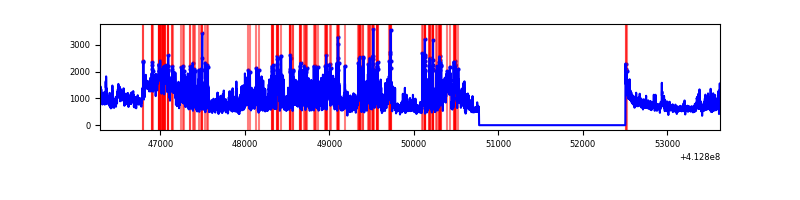 |
| B | 7340 | 5608 | 24 | 24 | 0.33% | 0.43% | 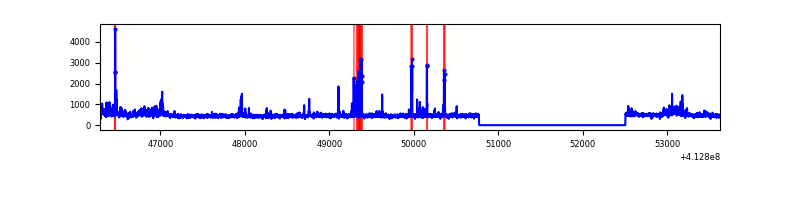 |
| C | 7340 | 5608 | 145 | 145 | 1.98% | 2.59% | 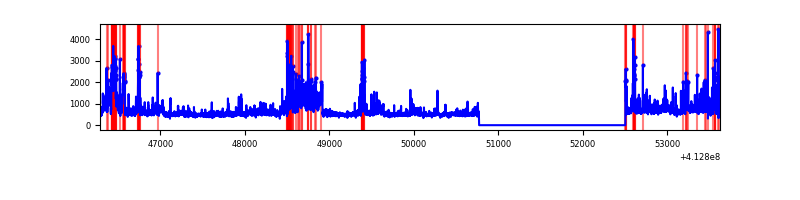 |
| D | 7340 | 5608 | 247 | 247 | 3.37% | 4.40% | 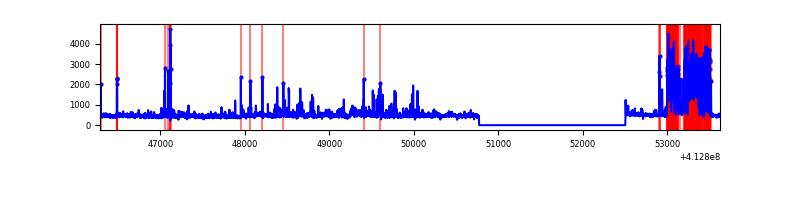 |
Top three noisy pixels from each quadrant. If the there are fewer than three noisy pixels in the level2.evt file, extra rows are filled as -1
| Pixel properties | Quadrant properties | ||||||
|---|---|---|---|---|---|---|---|
| Quadrant | DetID | PixID | Counts | Sigma | Mean | Median | Sigma |
| A | 15 | 222 | 1974804 | 15248.68 | 634 | 622 | 129.5 |
| A | 15 | 174 | 935119 | 7218.1 | 634 | 622 | 129.5 |
| A | 10 | 83 | 431096 | 3325.0 | 634 | 622 | 129.5 |
| B | 5 | 172 | 153430 | 1244.0 | 630 | 611 | 122.8 |
| B | 0 | 190 | 96222 | 778.3 | 630 | 611 | 122.8 |
| B | 5 | 255 | 62601 | 504.62 | 630 | 611 | 122.8 |
| C | 9 | 187 | 1142885 | 8074.33 | 608 | 612 | 141.5 |
| C | 15 | 208 | 337998 | 2384.86 | 608 | 612 | 141.5 |
| C | 15 | 214 | 231948 | 1635.23 | 608 | 612 | 141.5 |
| D | 12 | 233 | 863947 | 5803.62 | 606 | 588 | 148.8 |
| D | 12 | 227 | 170249 | 1140.48 | 606 | 588 | 148.8 |
| D | 2 | 153 | 78200 | 521.72 | 606 | 588 | 148.8 |
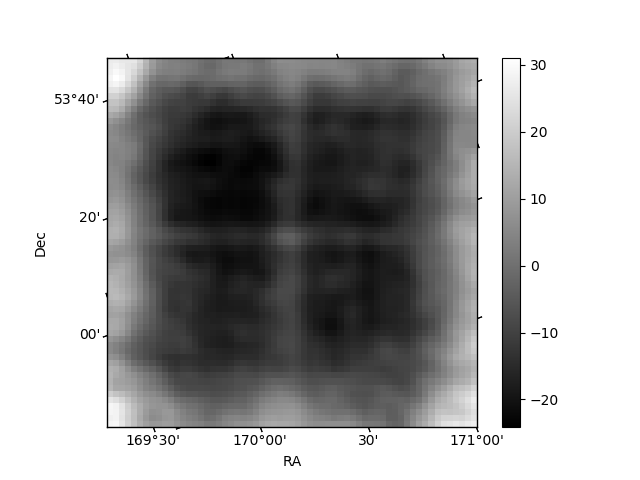
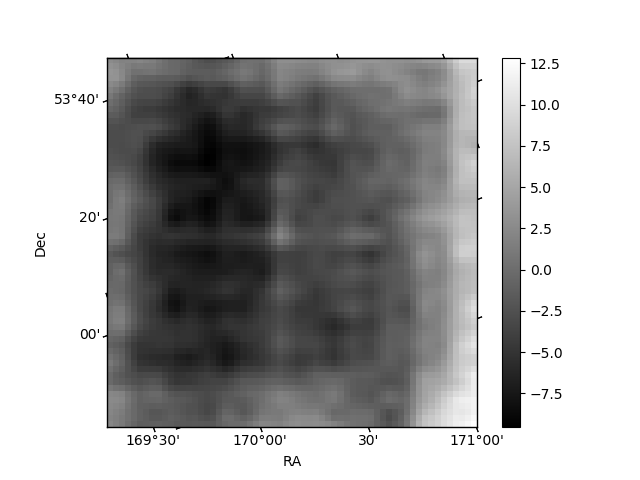
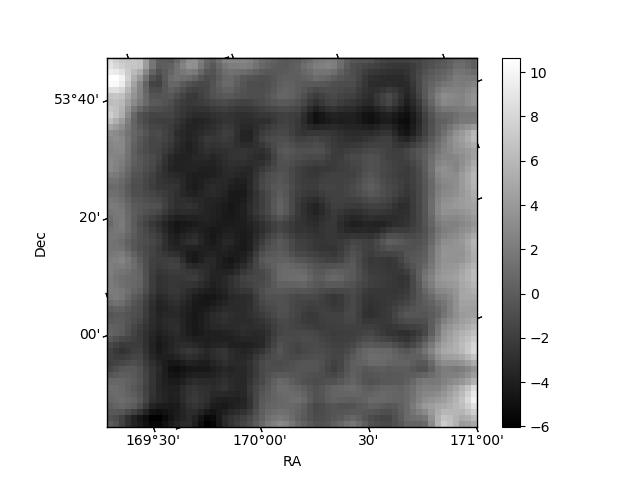
Histogram calculated using DETX and DETY for each event in the final _common_clean file
| Quadrant A | 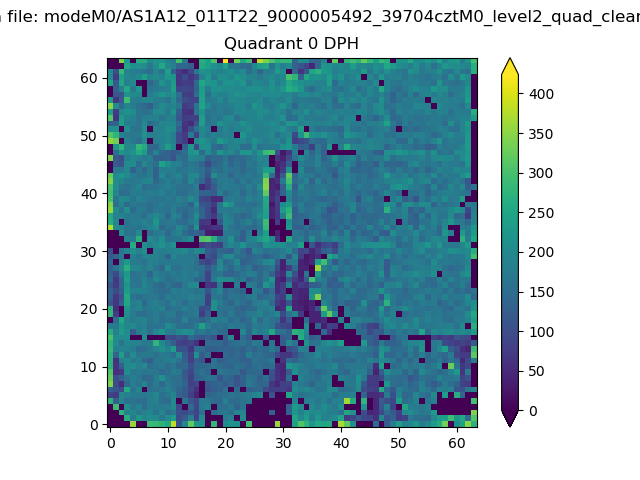 |
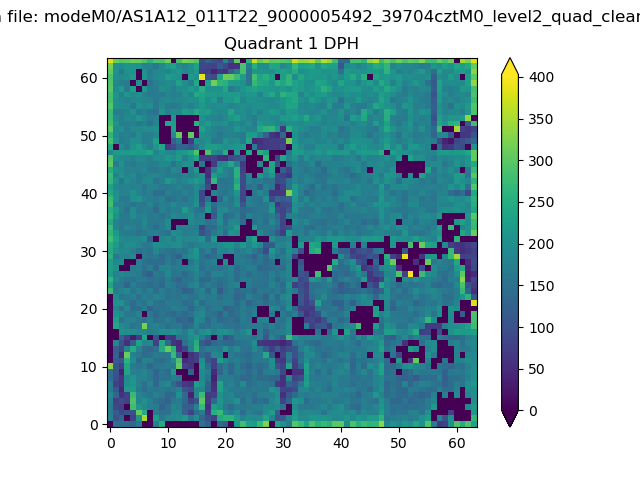 |
Quadrant B |
|---|---|---|---|
| Quadrant D | 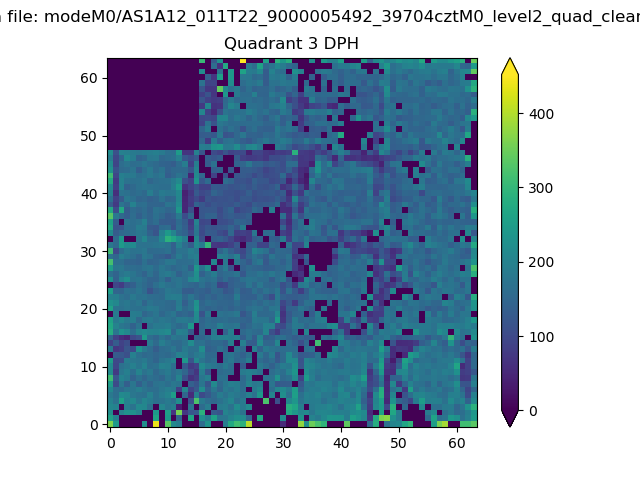 |
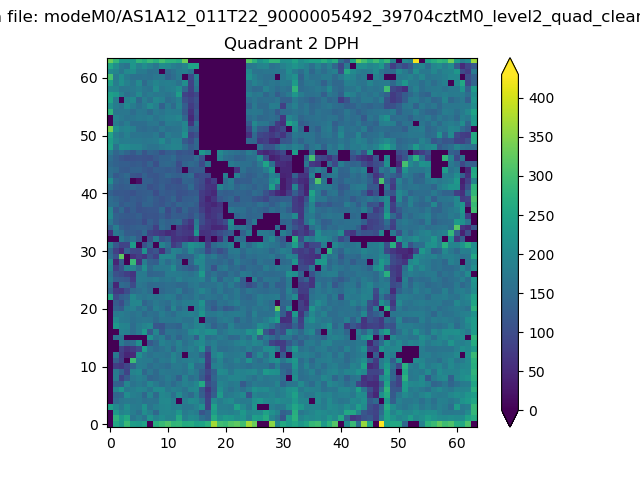 |
Quadrant C |
| Plot type | Count rate plots | Images |
|---|---|---|
| Comparison with Poisson distribution Blue bars denote a histogram of data divided into 1 sec bins. Red curve is a Poisson curve with rate = median count rate of data. |
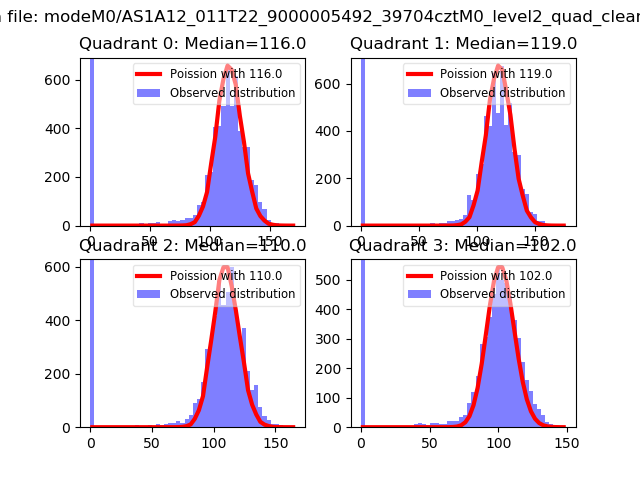 |
 |
| Quadrant-wise count rates Data is divided into 100 sec bins |
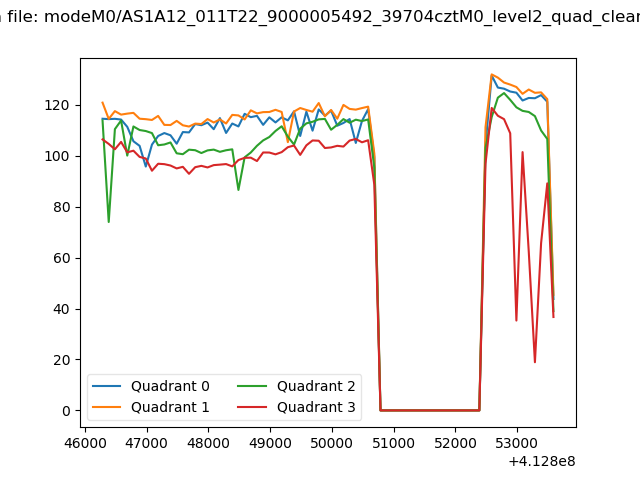 |
|
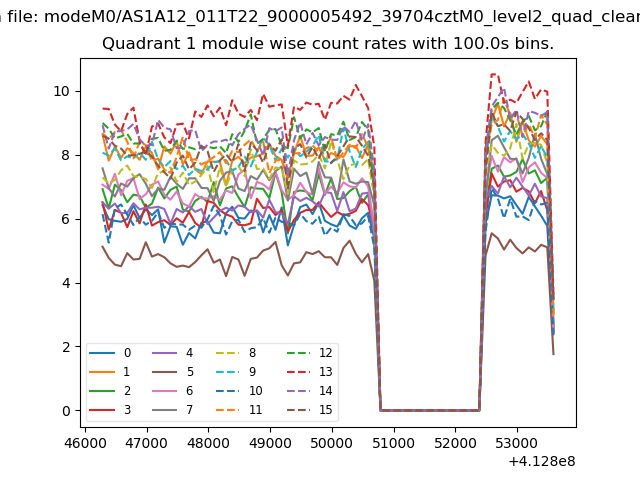
| Module-wise count rates for Quadrant A Data is divided into 100 sec bins |
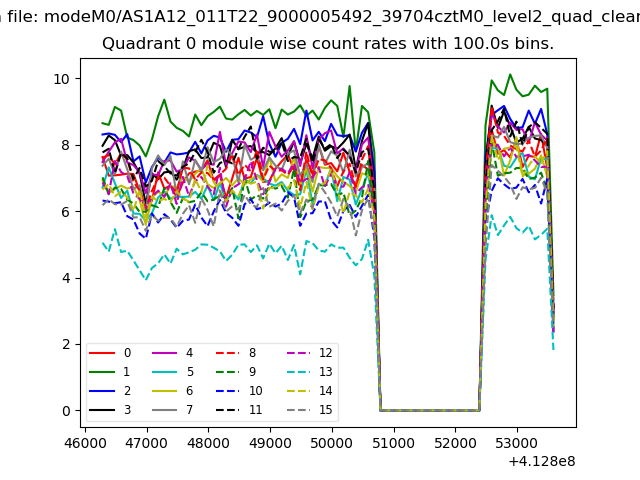 |
 |
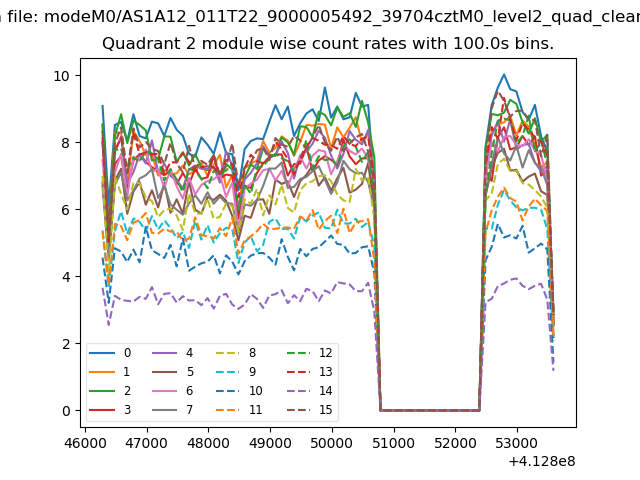
| Module-wise count rates for Quadrant B Data is divided into 100 sec bins |
 |
 |
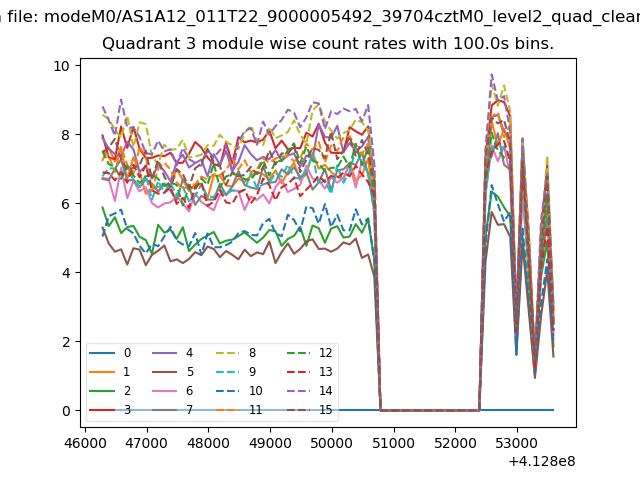
| Module-wise count rates for Quadrant C Data is divided into 100 sec bins |
 |
 |
| Module-wise count rates for Quadrant D Data is divided into 100 sec bins |
 |
 |
| Parameter | Plot |
|---|---|
| CZT HV Monitor | 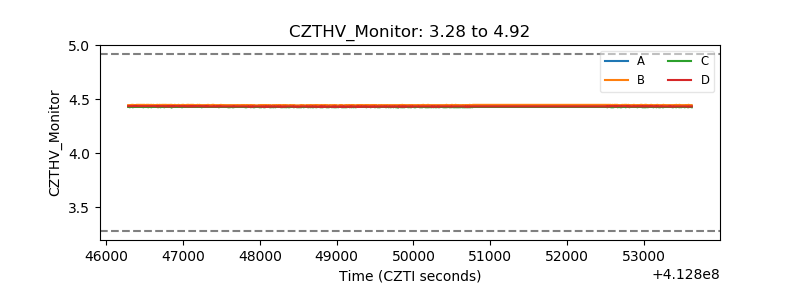 |
| D_VDD | 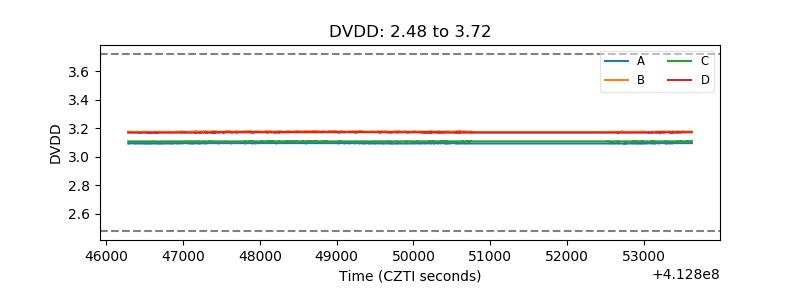 |
| Temperature 1 | 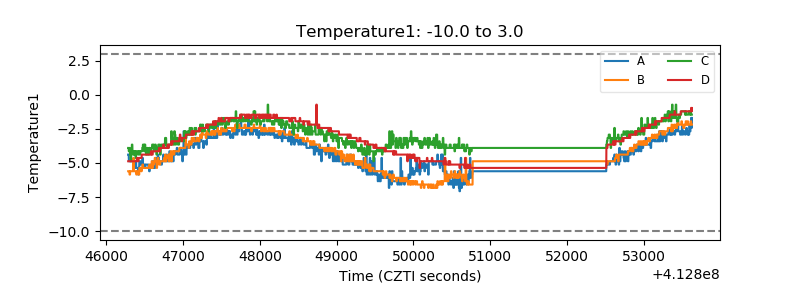 |
| Veto HV Monitor | 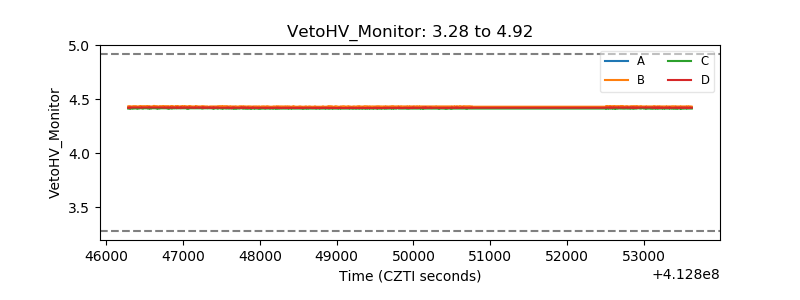 |
| Veto LLD | 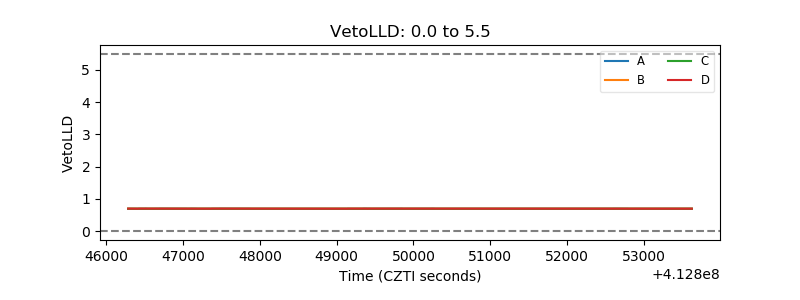 |
| Alpha Counter | 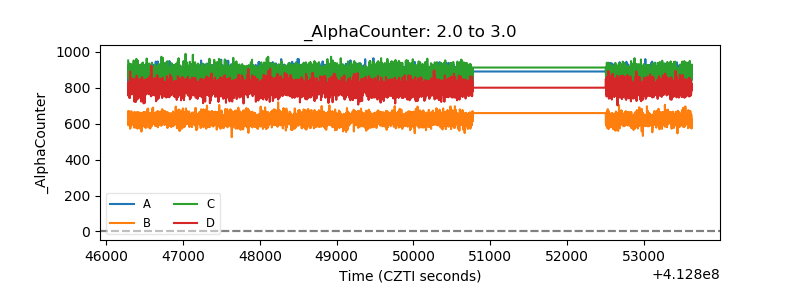 |
| _CPM_Rate | 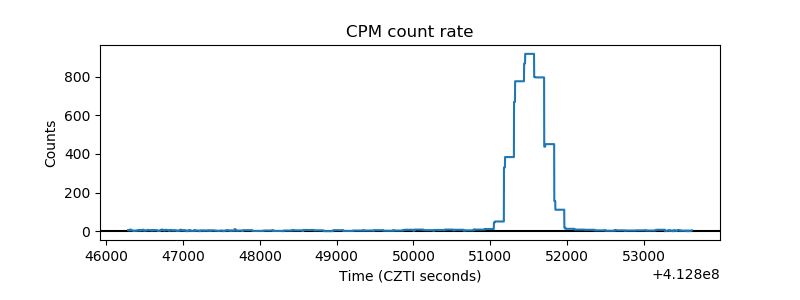 |
| CZT Counter | 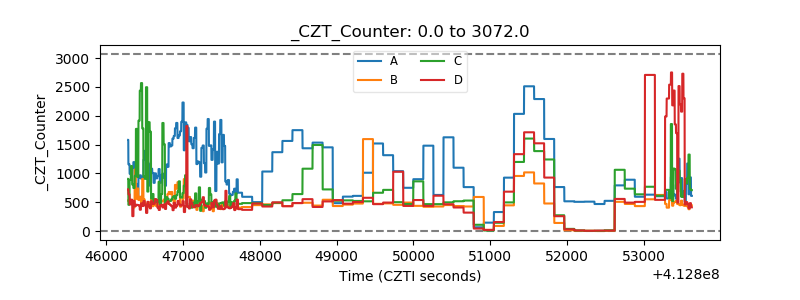 |
| +2.5 Volts monitor | 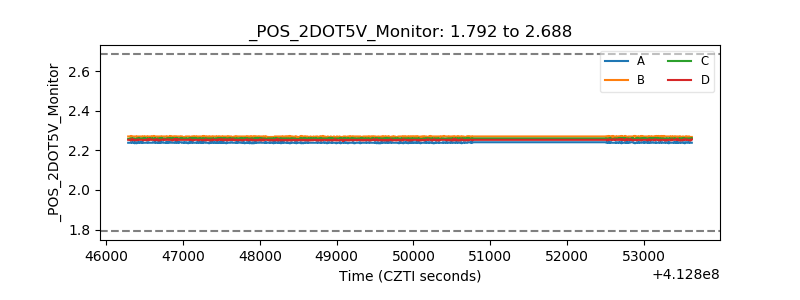 |
| +5 Volts monitor | 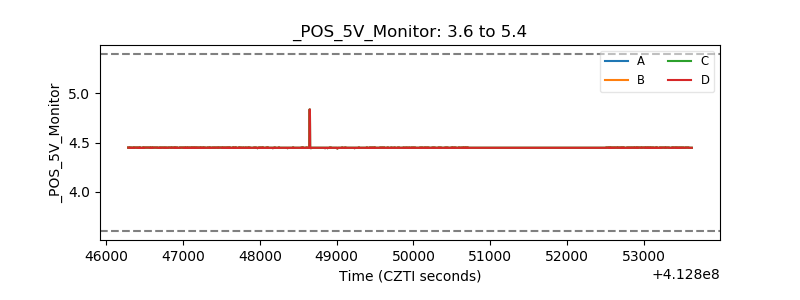 |
| _ROLL_ROT | 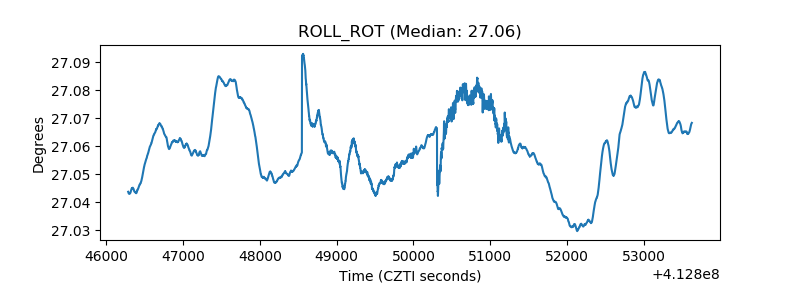 |
| _Roll_DEC | 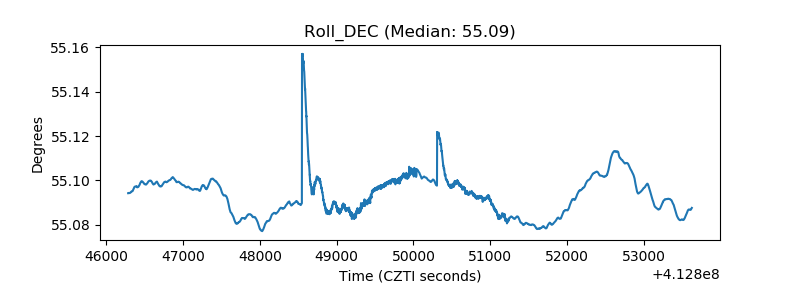 |
| _Roll_RA | 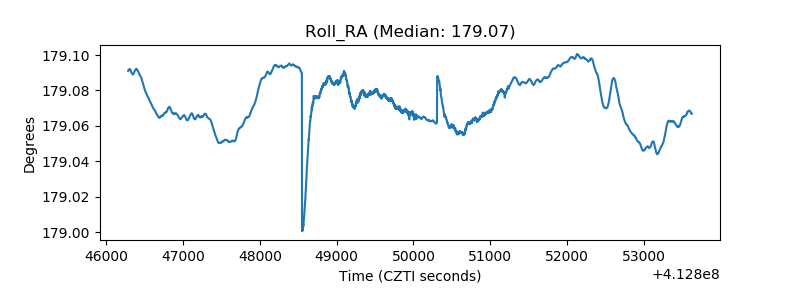 |
| Veto Counter | 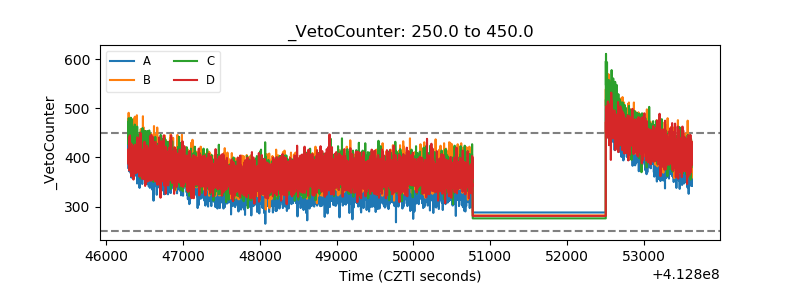 |