| Param | Original file | Final file |
|---|---|---|
| Filename | modeM0/AS1A12_011T22_9000005492_39705cztM0_level2.fits | modeM0/AS1A12_011T22_9000005492_39705cztM0_level2_quad_clean.evt |
| Size (bytes) | 328,668,480 | 73,854,720 |
| Size | 313.4 MB | 70.4 MB |
| Events in quadrant A | 3,229,602 | 509,361 |
| Events in quadrant B | 2,044,194 | 522,546 |
| Events in quadrant C | 3,630,000 | 476,033 |
| Events in quadrant D | 2,928,259 | 426,295 |
| Mode M0 | |||
|---|---|---|---|
| Quadrant | BADHDUFLAG | Total packets | Discarded packets |
| A | 0 | 12686 | 1 |
| B | 0 | 8897 | 1 |
| C | 0 | 13763 | 1 |
| D | 0 | 11494 | 1 |
| Mode SS | |||
|---|---|---|---|
| Quadrant | BADHDUFLAG | Total packets | Discarded packets |
| A | 0 | 86 | 0 |
| B | 0 | 86 | 0 |
| C | 0 | 86 | 0 |
| D | 0 | 86 | 0 |
| Mode M9 | |||
|---|---|---|---|
| Quadrant | BADHDUFLAG | Total packets | Discarded packets |
| A | 0 | 2 | 0 |
| B | 0 | 2 | 0 |
| C | 0 | 2 | 0 |
| D | 0 | 3 | 0 |
| Quadrant | Total seconds | Saturated seconds | Saturation percentage |
|---|---|---|---|
| A | 4291 | 108 | 2.516896% |
| B | 4291 | 18 | 0.419483% |
| C | 4291 | 180 | 4.194826% |
| D | 4291 | 306 | 7.131205% |
Noise dominated data is calculated using 1-second bins in cleaned event files. If a bin has >2000 counts, and if more than 50% of those come from <1% of pixels, then it is considered to be noise-dominated and hence unusable.
| Quadrant | # 1 sec bins | Bins with >0 counts | Bins with >2000 counts | High rate bins dominated by noise | Noise dominated (total time) | Noise dominated (detector-on time) | Marked lightcurve |
|---|---|---|---|---|---|---|---|
| A | 4291 | 4291 | 79 | 79 | 1.84% | 1.84% | 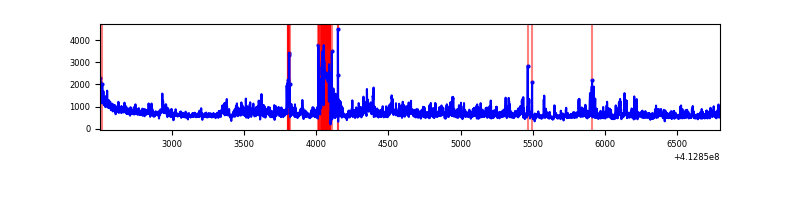 |
| B | 4291 | 4291 | 7 | 7 | 0.16% | 0.16% | 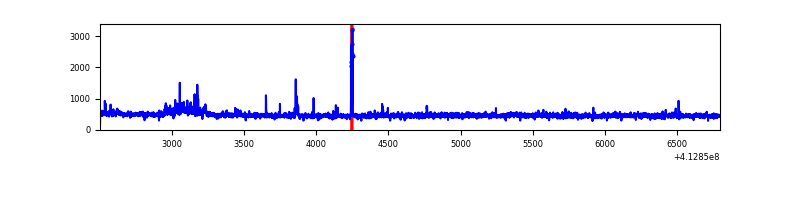 |
| C | 4291 | 4291 | 148 | 148 | 3.45% | 3.45% | 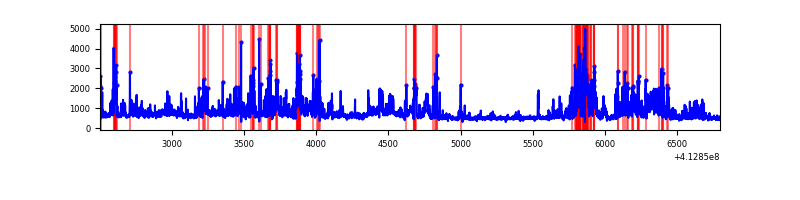 |
| D | 4291 | 4291 | 241 | 241 | 5.62% | 5.62% | 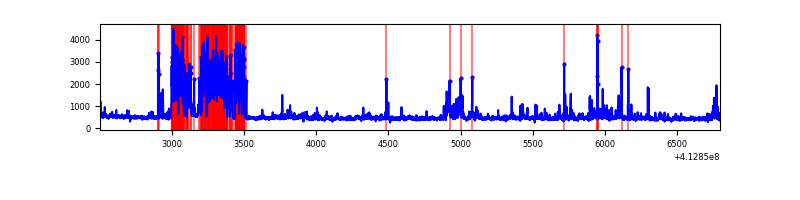 |
Top three noisy pixels from each quadrant. If the there are fewer than three noisy pixels in the level2.evt file, extra rows are filled as -1
| Pixel properties | Quadrant properties | ||||||
|---|---|---|---|---|---|---|---|
| Quadrant | DetID | PixID | Counts | Sigma | Mean | Median | Sigma |
| A | 15 | 222 | 711037 | 7146.86 | 486 | 476 | 99.4 |
| A | 15 | 174 | 323327 | 3247.25 | 486 | 476 | 99.4 |
| A | 10 | 83 | 304780 | 3060.71 | 486 | 476 | 99.4 |
| B | 5 | 172 | 60088 | 631.52 | 488 | 475 | 94.4 |
| B | 0 | 186 | 20687 | 214.12 | 488 | 475 | 94.4 |
| B | 0 | 190 | 19995 | 206.79 | 488 | 475 | 94.4 |
| C | 9 | 187 | 1034931 | 9394.84 | 469 | 472 | 110.1 |
| C | 15 | 208 | 578536 | 5249.91 | 469 | 472 | 110.1 |
| C | 15 | 214 | 174691 | 1582.24 | 469 | 472 | 110.1 |
| D | 12 | 233 | 888110 | 7743.76 | 466 | 452 | 114.6 |
| D | 12 | 227 | 109643 | 952.56 | 466 | 452 | 114.6 |
| D | 2 | 249 | 41880 | 361.41 | 466 | 452 | 114.6 |
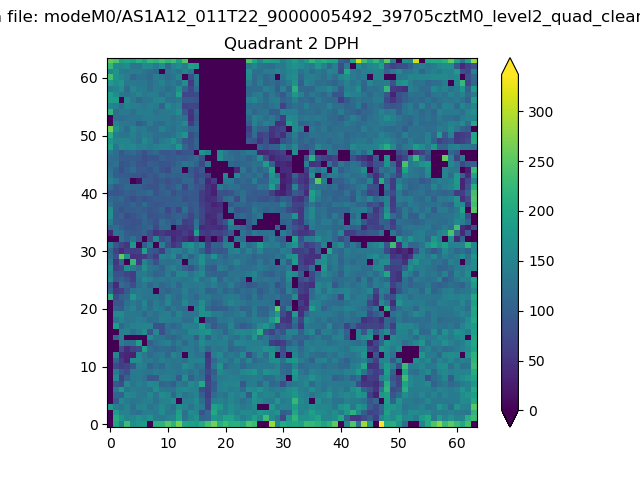
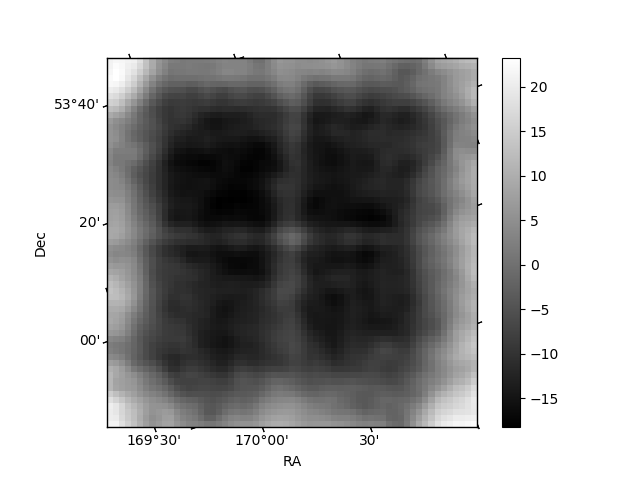
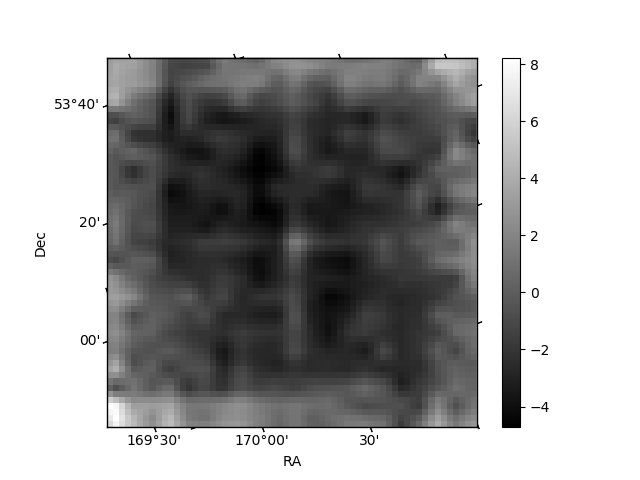
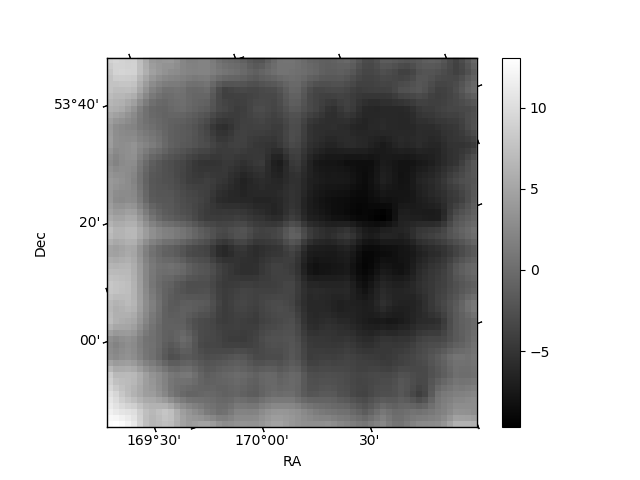
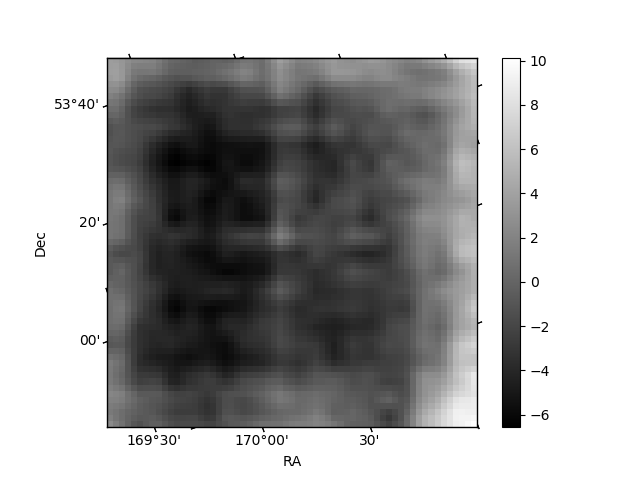
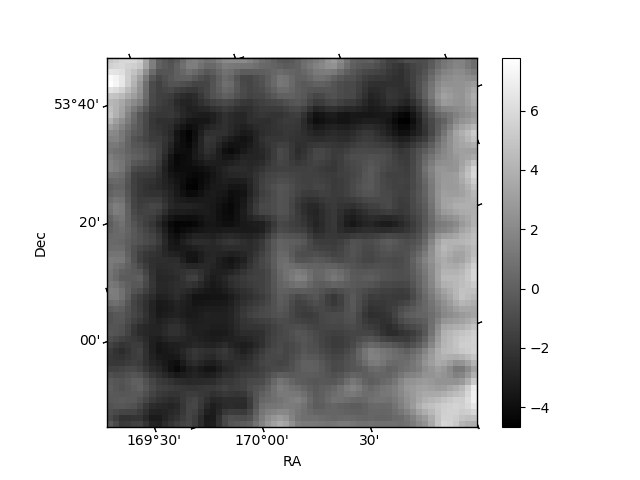
Histogram calculated using DETX and DETY for each event in the final _common_clean file
| Quadrant A | 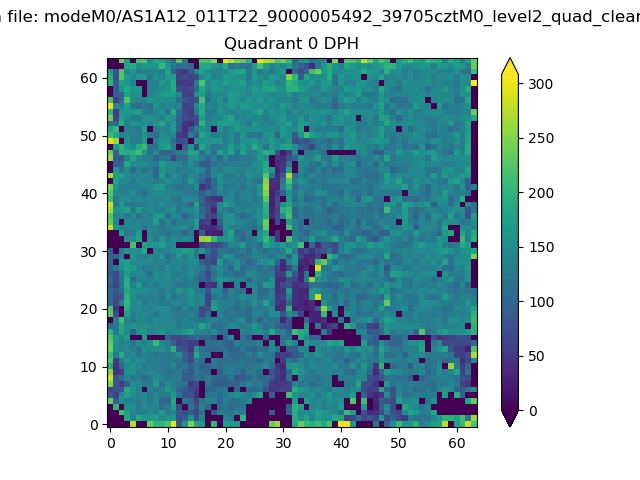 |
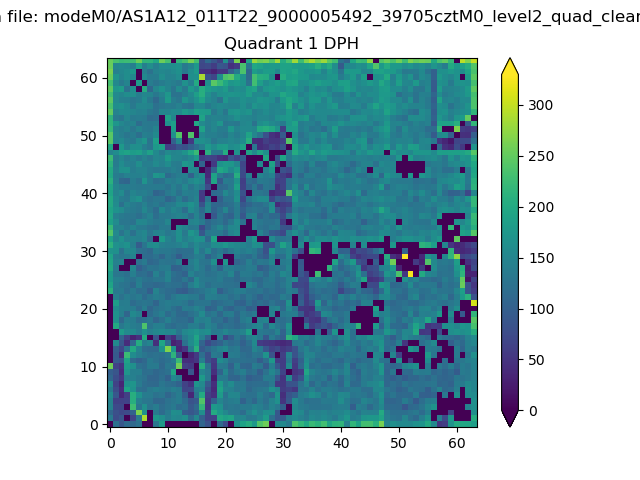 |
Quadrant B |
|---|---|---|---|
| Quadrant D | 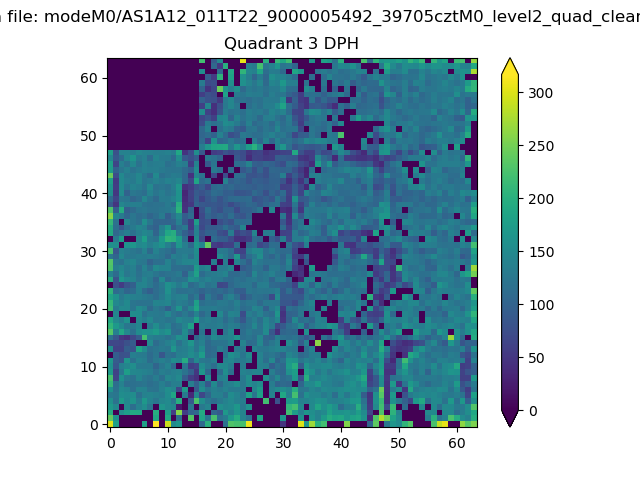 |
 |
Quadrant C |
| Plot type | Count rate plots | Images |
|---|---|---|
| Comparison with Poisson distribution Blue bars denote a histogram of data divided into 1 sec bins. Red curve is a Poisson curve with rate = median count rate of data. |
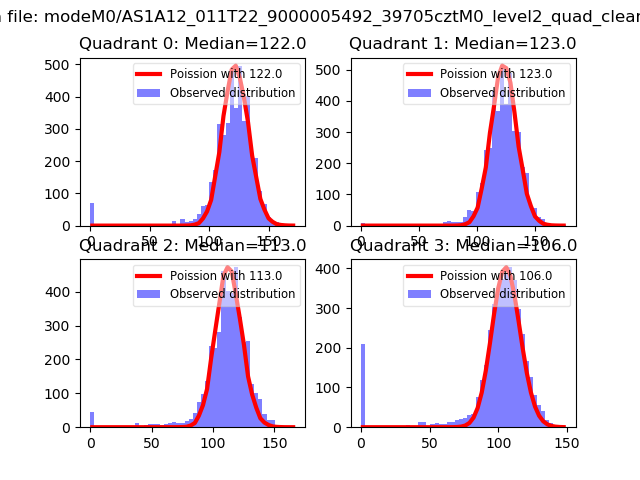 |
 |
| Quadrant-wise count rates Data is divided into 100 sec bins |
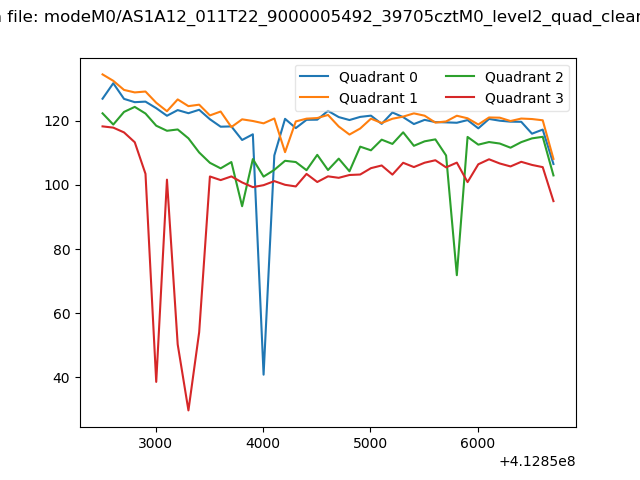 |
|
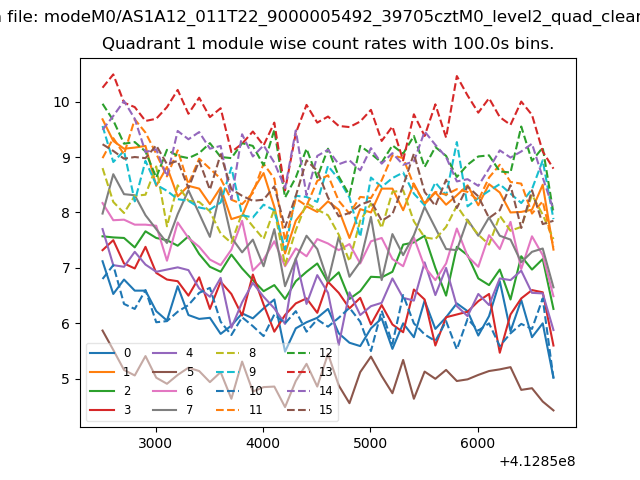
| Module-wise count rates for Quadrant A Data is divided into 100 sec bins |
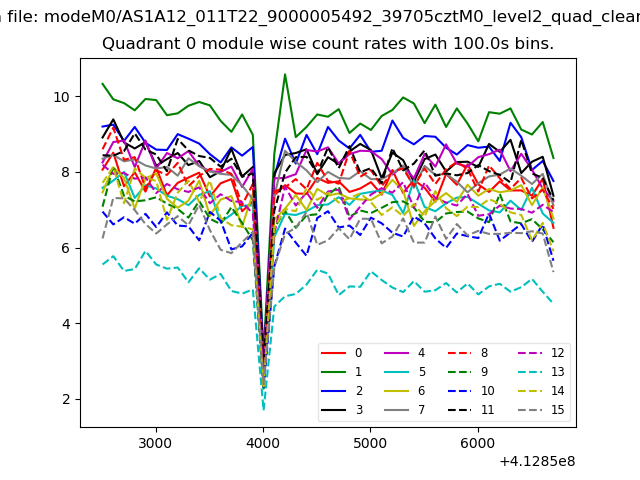 |
 |
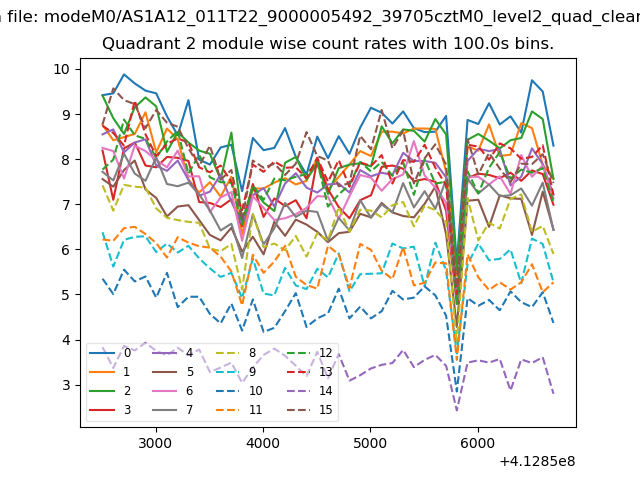
| Module-wise count rates for Quadrant B Data is divided into 100 sec bins |
 |
 |
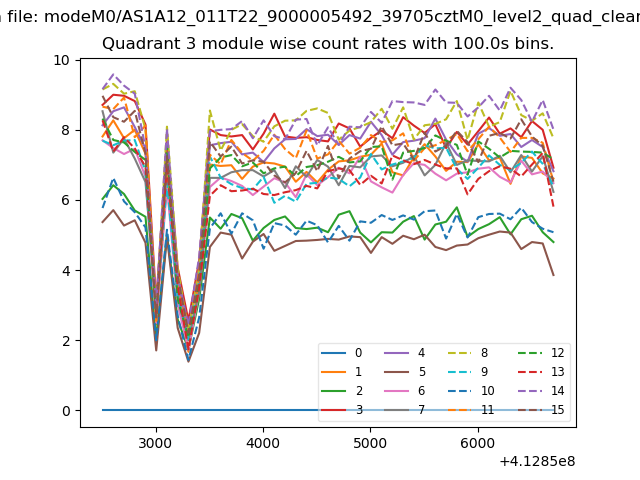
| Module-wise count rates for Quadrant C Data is divided into 100 sec bins |
 |
 |
| Module-wise count rates for Quadrant D Data is divided into 100 sec bins |
 |
 |
| Parameter | Plot |
|---|---|
| CZT HV Monitor | 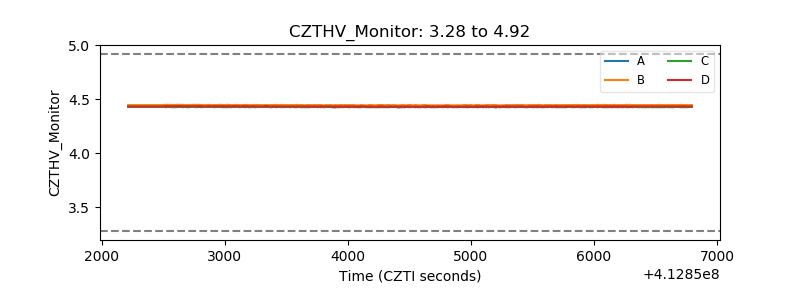 |
| D_VDD | 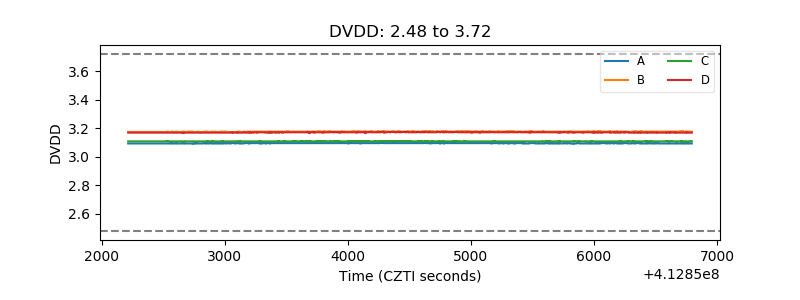 |
| Temperature 1 | 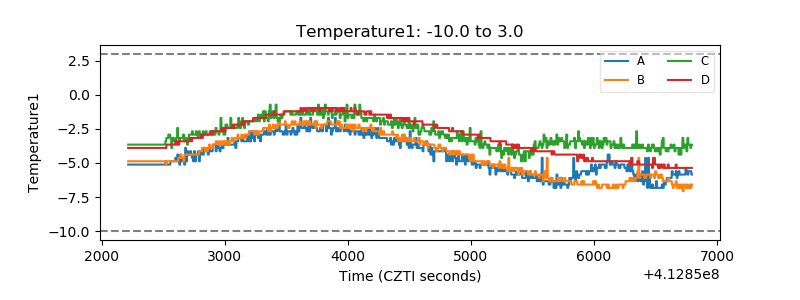 |
| Veto HV Monitor | 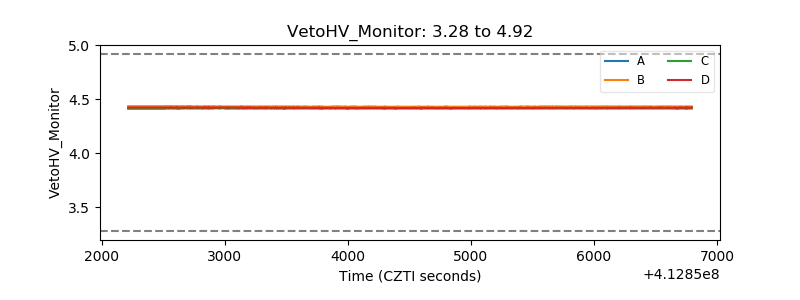 |
| Veto LLD | 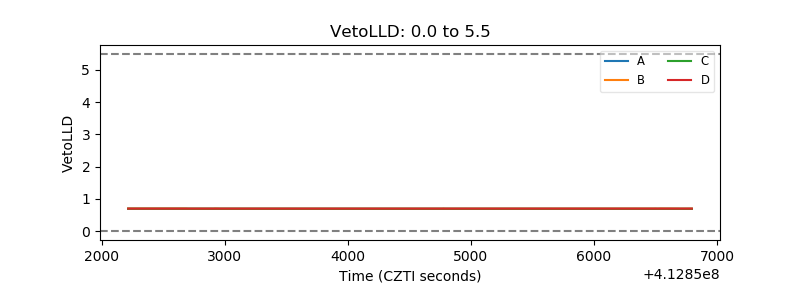 |
| Alpha Counter | 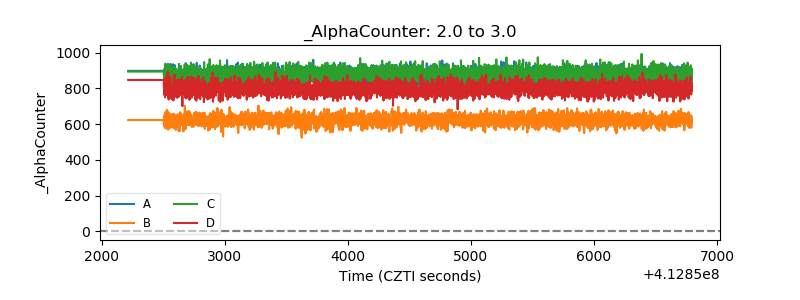 |
| _CPM_Rate | 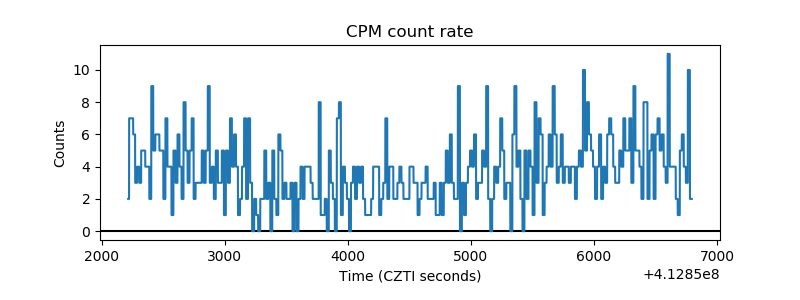 |
| CZT Counter | 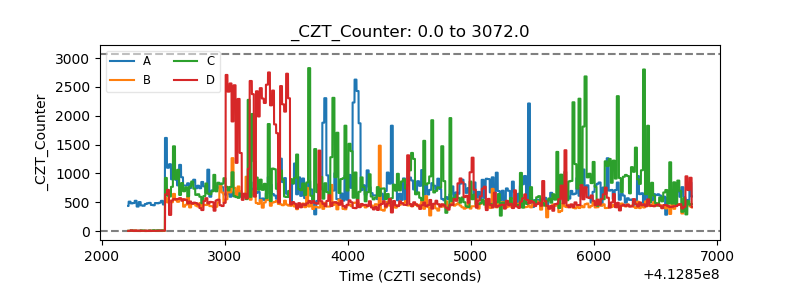 |
| +2.5 Volts monitor | 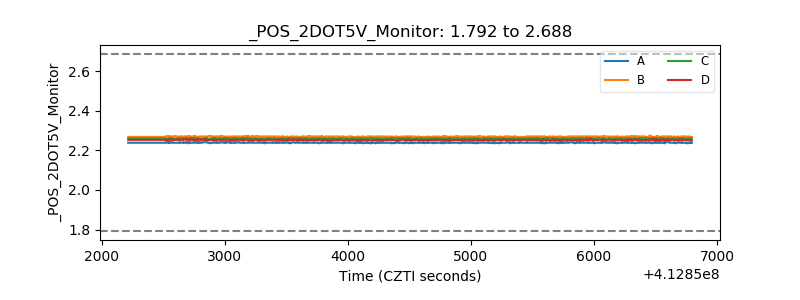 |
| +5 Volts monitor | 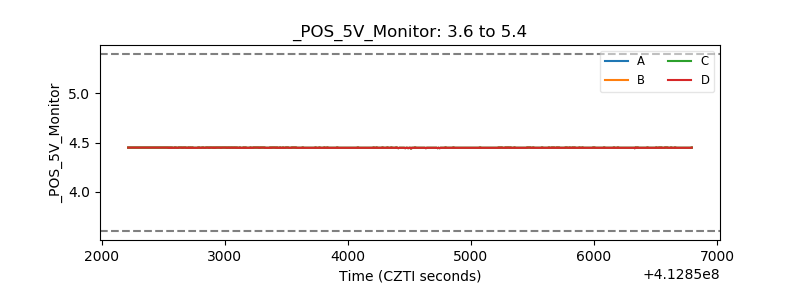 |
| _ROLL_ROT | 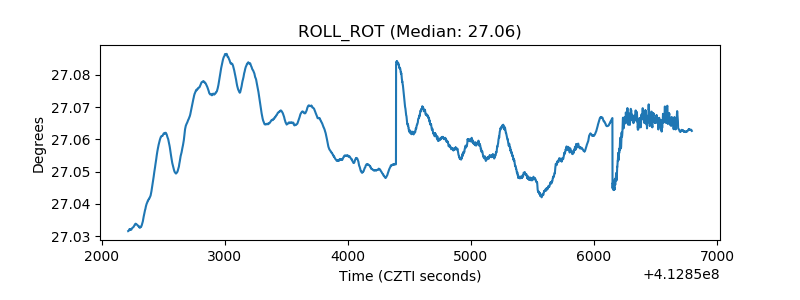 |
| _Roll_DEC | 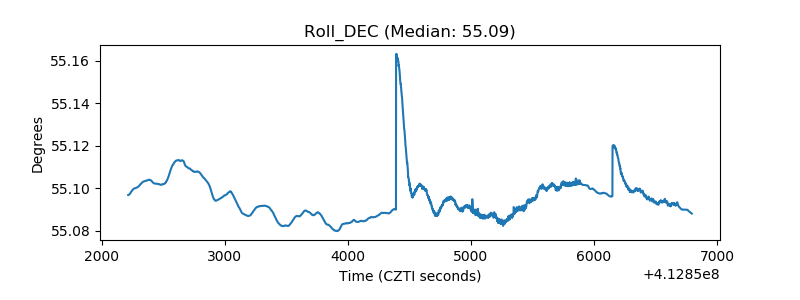 |
| _Roll_RA | 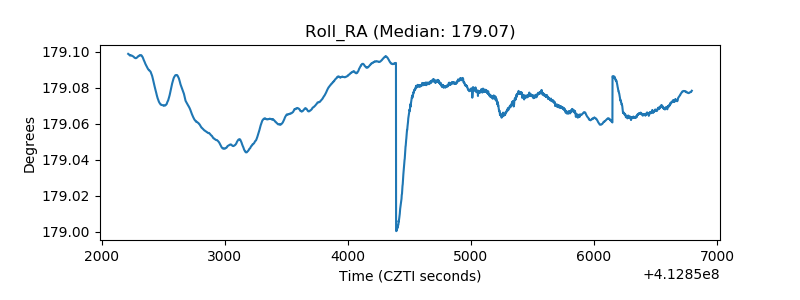 |
| Veto Counter | 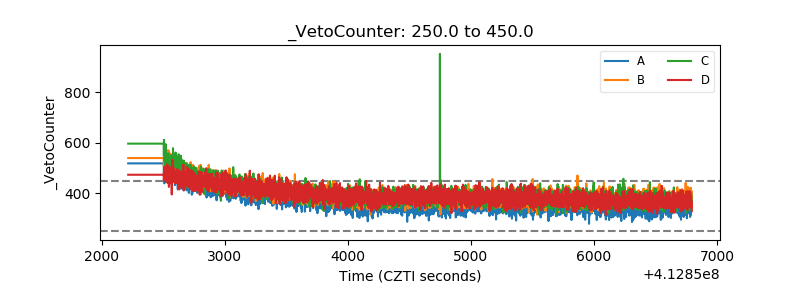 |