| Param | Original file | Final file |
|---|---|---|
| Filename | modeM0/AS1A12_011T22_9000005492_39882cztM0_level2.fits | modeM0/AS1A12_011T22_9000005492_39882cztM0_level2_quad_clean.evt |
| Size (bytes) | 10,509,120 | 2,047,680 |
| Size | 10.0 MB | 2.0 MB |
| Events in quadrant A | 96,135 | 12,470 |
| Events in quadrant B | 73,987 | 11,067 |
| Events in quadrant C | 78,386 | 10,160 |
| Events in quadrant D | 123,962 | 8,820 |
| Mode M0 | |||
|---|---|---|---|
| Quadrant | BADHDUFLAG | Total packets | Discarded packets |
| A | 0 | 741 | 364 |
| B | 0 | 632 | 312 |
| C | 0 | 636 | 317 |
| D | 0 | 915 | 442 |
| Mode SS | |||
|---|---|---|---|
| Quadrant | BADHDUFLAG | Total packets | Discarded packets |
| A | 0 | 6 | 4 |
| B | 0 | 6 | 2 |
| C | 0 | 6 | 2 |
| D | 0 | 6 | 2 |
| Mode M9 | |||
|---|---|---|---|
| Quadrant | BADHDUFLAG | Total packets | Discarded packets |
| A | 1 | 139892809648168 | 139891379798062 |
| B | 1 | -1 | -1 |
| C | 1 | -1 | -1 |
| D | 1 | -1 | -1 |
| Quadrant | Total seconds | Saturated seconds | Saturation percentage |
|---|---|---|---|
| A | 166 | 0 | 0.000000% |
| B | 160 | 0 | 0.000000% |
| C | 158 | 0 | 0.000000% |
| D | 168 | 15 | 8.928571% |
Noise dominated data is calculated using 1-second bins in cleaned event files. If a bin has >2000 counts, and if more than 50% of those come from <1% of pixels, then it is considered to be noise-dominated and hence unusable.
| Quadrant | # 1 sec bins | Bins with >0 counts | Bins with >2000 counts | High rate bins dominated by noise | Noise dominated (total time) | Noise dominated (detector-on time) | Marked lightcurve |
|---|---|---|---|---|---|---|---|
| A | 321 | 197 | 0 | 0 | 0.00% | 0.00% | 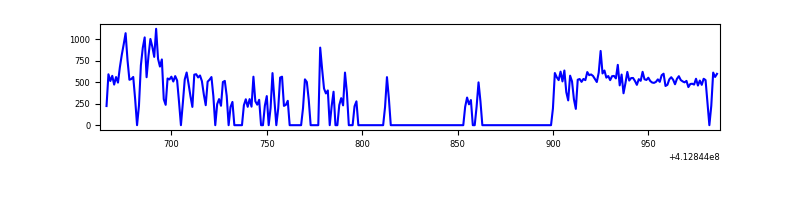 |
| B | 325 | 193 | 0 | 0 | 0.00% | 0.00% | 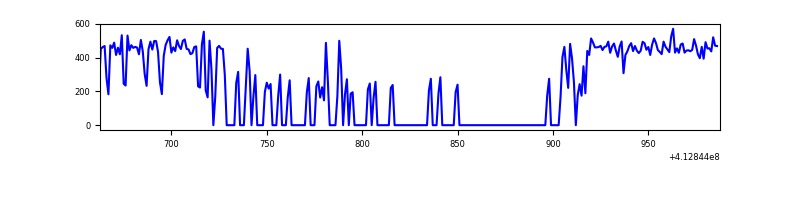 |
| C | 325 | 189 | 0 | 0 | 0.00% | 0.00% | 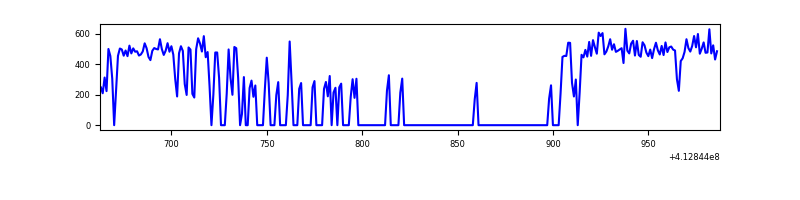 |
| D | 325 | 195 | 9 | 9 | 2.77% | 4.62% | 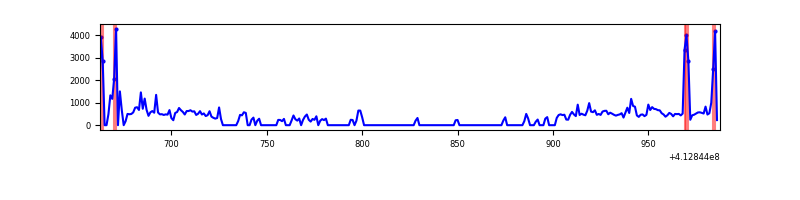 |
Top three noisy pixels from each quadrant. If the there are fewer than three noisy pixels in the level2.evt file, extra rows are filled as -1
| Pixel properties | Quadrant properties | ||||||
|---|---|---|---|---|---|---|---|
| Quadrant | DetID | PixID | Counts | Sigma | Mean | Median | Sigma |
| A | 10 | 83 | 11831 | 2076.22 | 19 | 18 | 5.7 |
| A | 2 | 79 | 5204 | 911.48 | 19 | 18 | 5.7 |
| A | 9 | 143 | 2432 | 424.28 | 19 | 18 | 5.7 |
| B | 4 | 170 | 915 | 164.99 | 18 | 17 | 5.4 |
| B | 12 | 111 | 416 | 73.31 | 18 | 17 | 5.4 |
| B | 11 | 111 | 391 | 68.72 | 18 | 17 | 5.4 |
| C | 15 | 214 | 6282 | 1039.46 | 17 | 17 | 6.0 |
| C | 14 | 254 | 636 | 102.7 | 17 | 17 | 6.0 |
| C | 1 | 16 | 399 | 63.38 | 17 | 17 | 6.0 |
| D | 12 | 227 | 23876 | 3771.46 | 18 | 18 | 6.3 |
| D | 2 | 249 | 17311 | 2733.67 | 18 | 18 | 6.3 |
| D | 2 | 250 | 5351 | 843.04 | 18 | 18 | 6.3 |
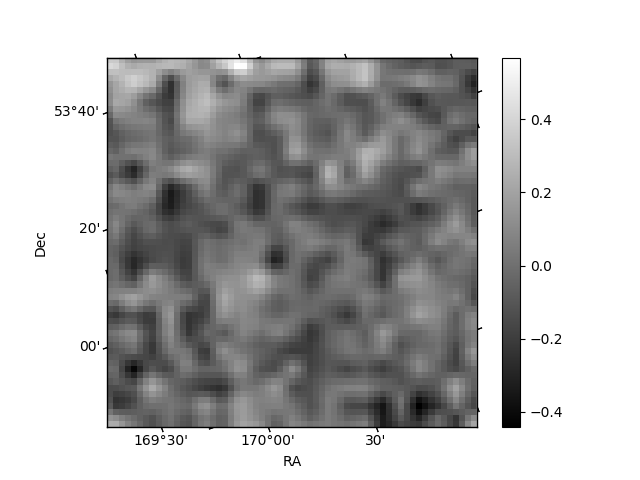
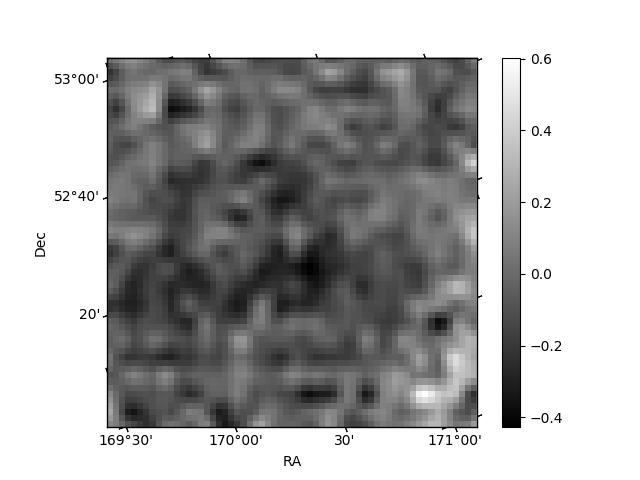
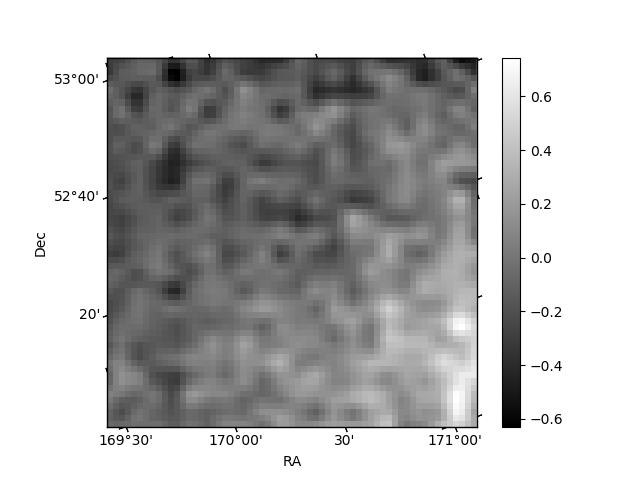
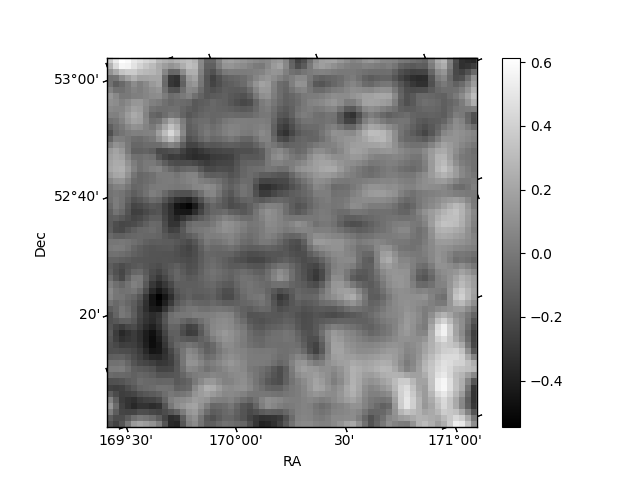
Histogram calculated using DETX and DETY for each event in the final _common_clean file
| Quadrant A | 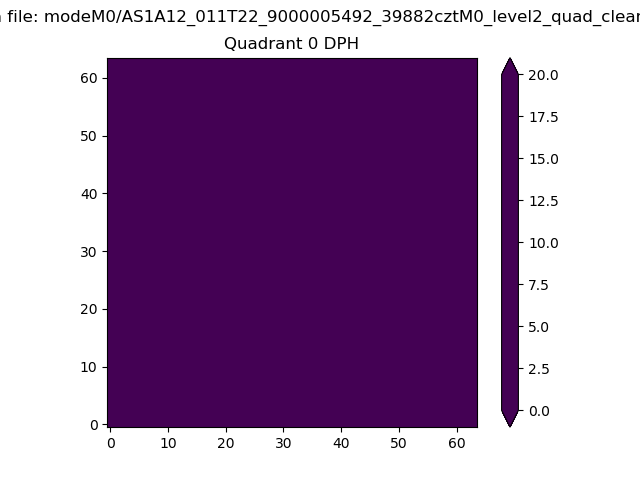 |
 |
Quadrant B |
|---|---|---|---|
| Quadrant D | 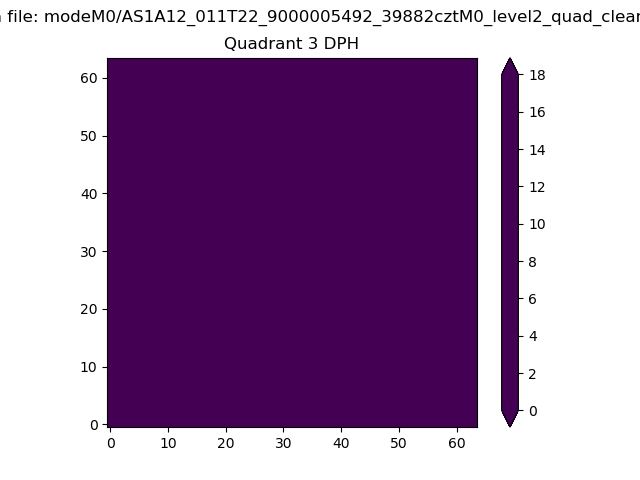 |
 |
Quadrant C |
| Plot type | Count rate plots | Images |
|---|---|---|
| Comparison with Poisson distribution Blue bars denote a histogram of data divided into 1 sec bins. Red curve is a Poisson curve with rate = median count rate of data. |
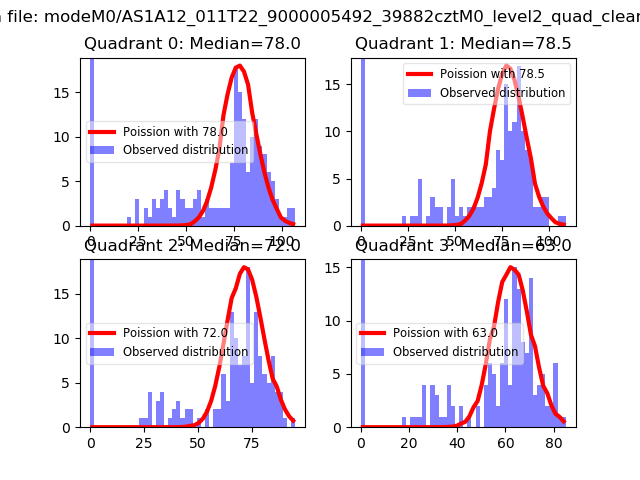 |
 |
| Quadrant-wise count rates Data is divided into 100 sec bins |
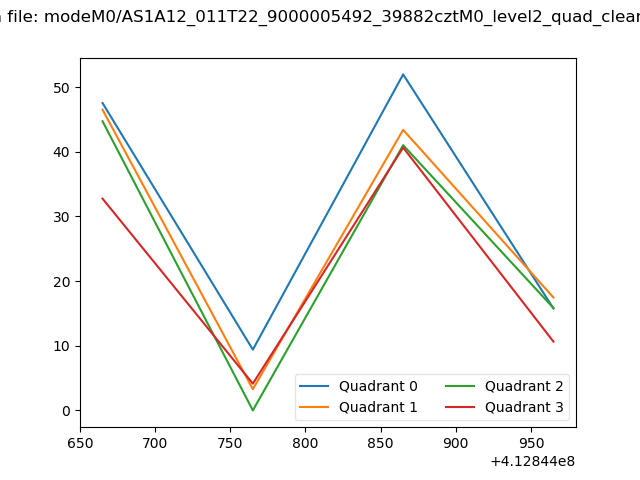 |
|
| Module-wise count rates for Quadrant A Data is divided into 100 sec bins |
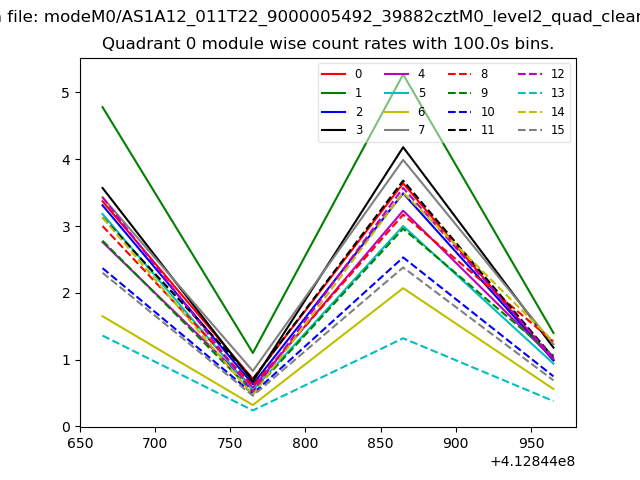 |
 |
| Module-wise count rates for Quadrant B Data is divided into 100 sec bins |
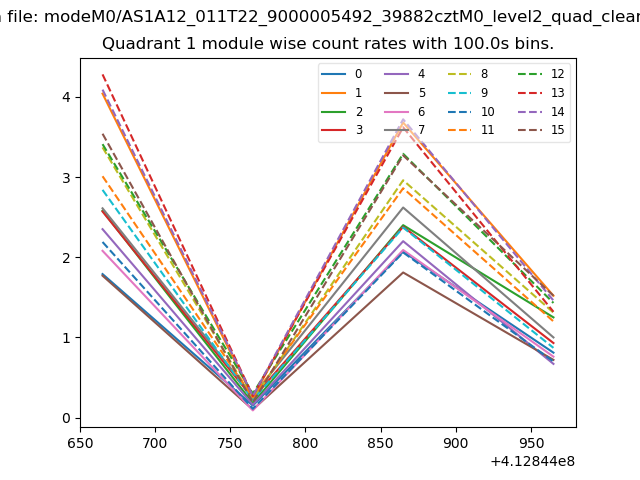 |
 |
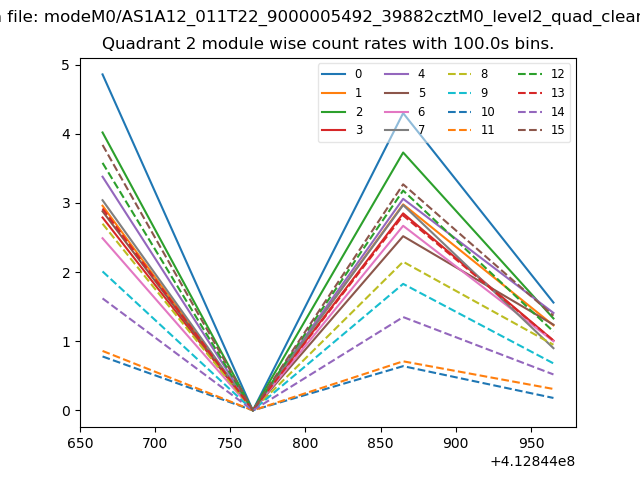
| Module-wise count rates for Quadrant C Data is divided into 100 sec bins |
 |
 |
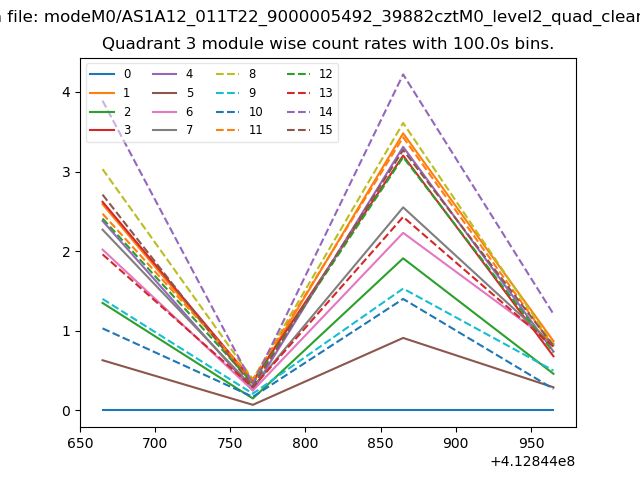
| Module-wise count rates for Quadrant D Data is divided into 100 sec bins |
 |
 |
| Parameter | Plot |
|---|---|
| CZT HV Monitor | 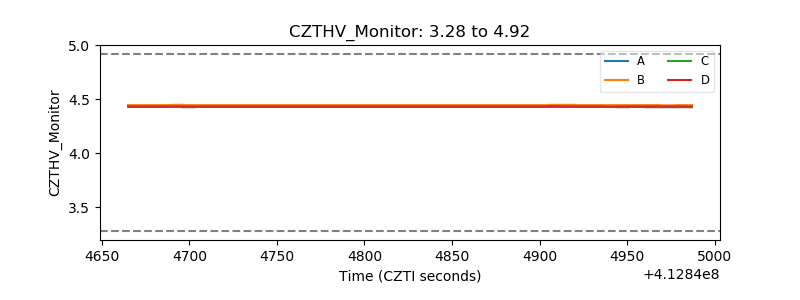 |
| D_VDD | 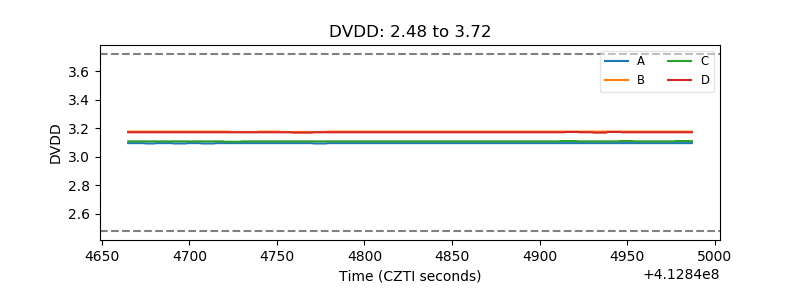 |
| Temperature 1 | 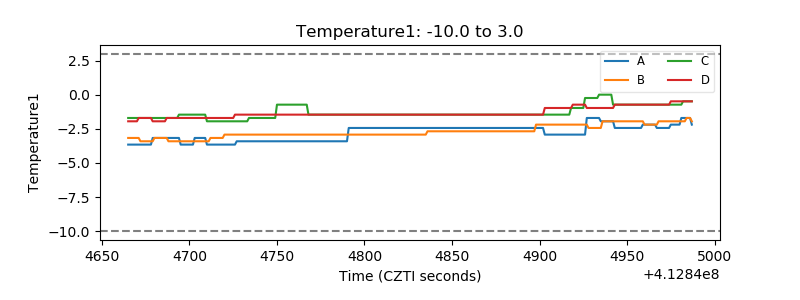 |
| Veto HV Monitor | 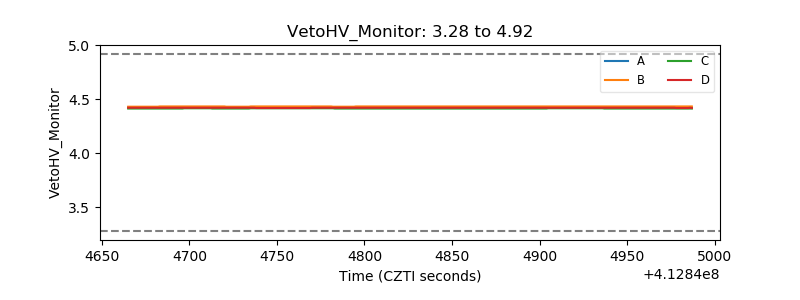 |
| Veto LLD | 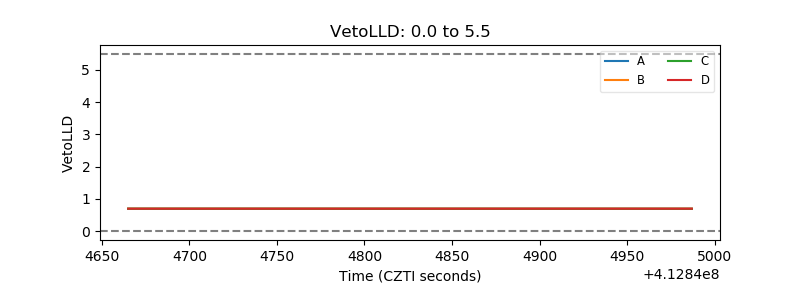 |
| Alpha Counter | 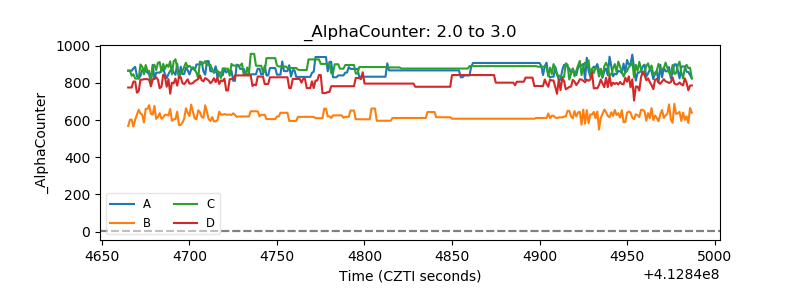 |
| _CPM_Rate | 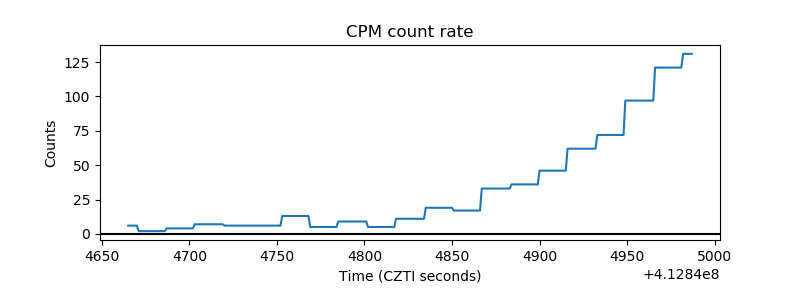 |
| CZT Counter | 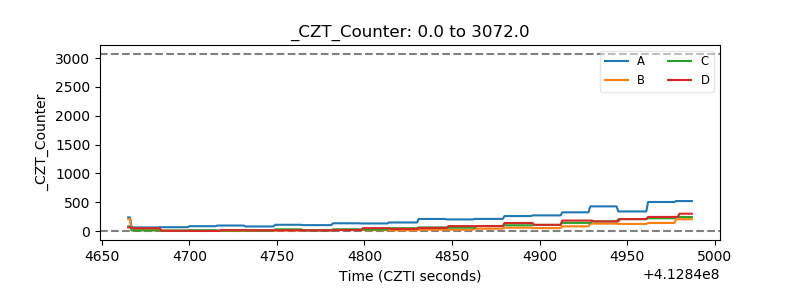 |
| +2.5 Volts monitor |  |
| +5 Volts monitor | 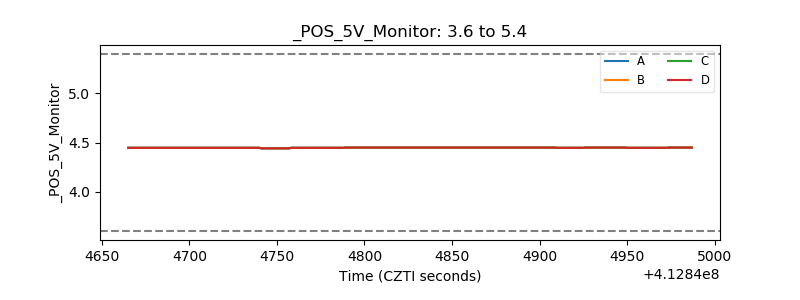 |
| _ROLL_ROT | 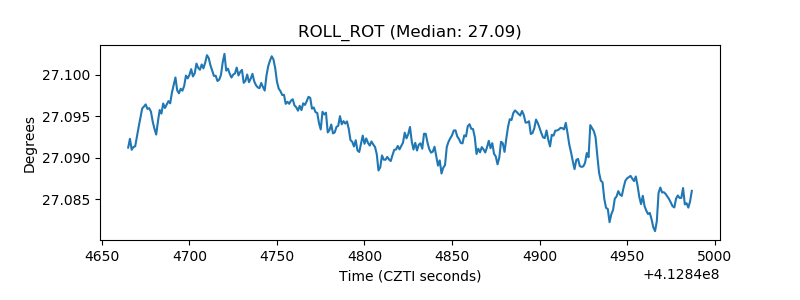 |
| _Roll_DEC | 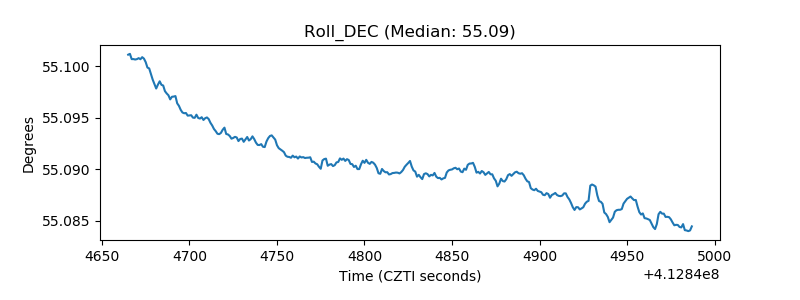 |
| _Roll_RA | 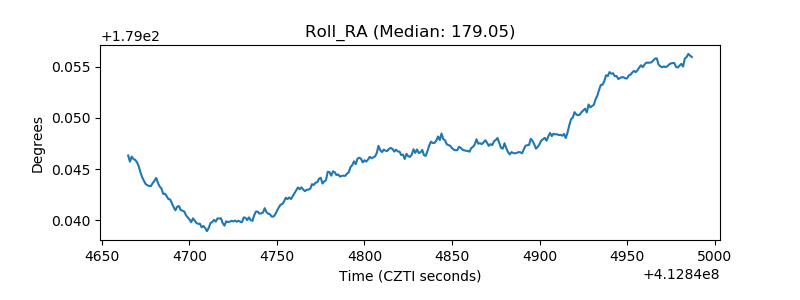 |
| Veto Counter | 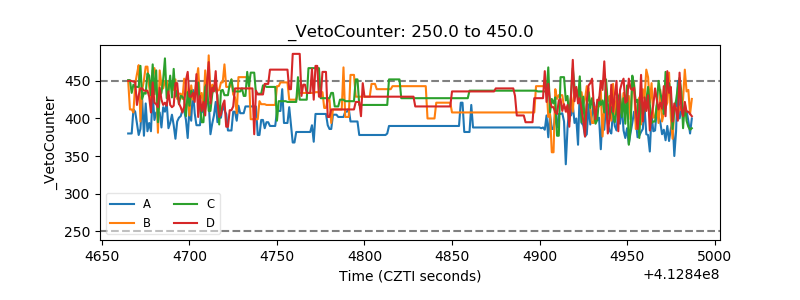 |