| Param | Original file | Final file |
|---|---|---|
| Filename | modeM0/AS1A12_022T01_9000005494_39705cztM0_level2.fits | modeM0/AS1A12_022T01_9000005494_39705cztM0_level2_quad_clean.evt |
| Size (bytes) | 64,598,400 | 15,678,720 |
| Size | 61.6 MB | 15.0 MB |
| Events in quadrant A | 863,299 | 104,699 |
| Events in quadrant B | 433,761 | 110,866 |
| Events in quadrant C | 550,679 | 103,270 |
| Events in quadrant D | 480,247 | 94,833 |
| Mode SS | |||
|---|---|---|---|
| Quadrant | BADHDUFLAG | Total packets | Discarded packets |
| A | 0 | 16 | 0 |
| B | 0 | 16 | 0 |
| C | 0 | 16 | 0 |
| D | 0 | 16 | 0 |
| Mode M0 | |||
|---|---|---|---|
| Quadrant | BADHDUFLAG | Total packets | Discarded packets |
| A | 0 | 3139 | 2 |
| B | 0 | 1753 | 1 |
| C | 0 | 2194 | 1 |
| D | 0 | 1891 | 1 |
| Mode M9 | |||
|---|---|---|---|
| Quadrant | BADHDUFLAG | Total packets | Discarded packets |
| A | 0 | 15 | 0 |
| B | 0 | 15 | 0 |
| C | 0 | 15 | 0 |
| D | 0 | 15 | 0 |
| Quadrant | Total seconds | Saturated seconds | Saturation percentage |
|---|---|---|---|
| A | 772 | 55 | 7.124352% |
| B | 772 | 2 | 0.259067% |
| C | 772 | 7 | 0.906736% |
| D | 772 | 9 | 1.165803% |
Noise dominated data is calculated using 1-second bins in cleaned event files. If a bin has >2000 counts, and if more than 50% of those come from <1% of pixels, then it is considered to be noise-dominated and hence unusable.
| Quadrant | # 1 sec bins | Bins with >0 counts | Bins with >2000 counts | High rate bins dominated by noise | Noise dominated (total time) | Noise dominated (detector-on time) | Marked lightcurve |
|---|---|---|---|---|---|---|---|
| A | 772 | 772 | 25 | 25 | 3.24% | 3.24% | 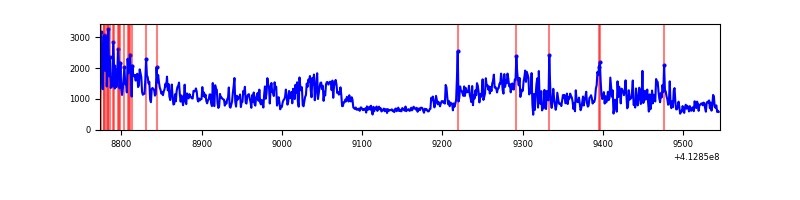 |
| B | 772 | 772 | 0 | 0 | 0.00% | 0.00% | 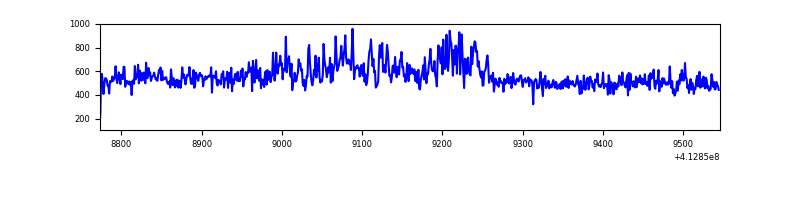 |
| C | 772 | 772 | 5 | 5 | 0.65% | 0.65% | 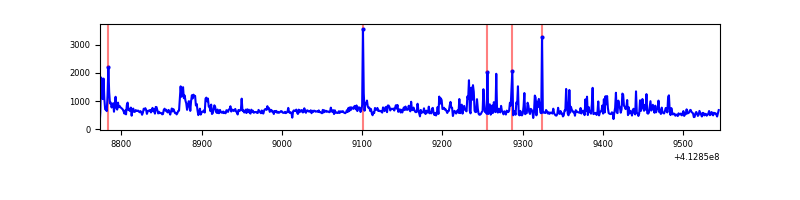 |
| D | 772 | 772 | 11 | 11 | 1.42% | 1.42% | 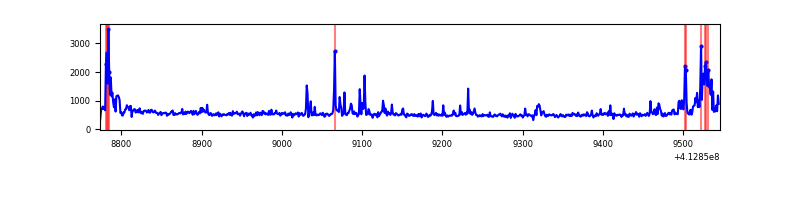 |
Top three noisy pixels from each quadrant. If the there are fewer than three noisy pixels in the level2.evt file, extra rows are filled as -1
| Pixel properties | Quadrant properties | ||||||
|---|---|---|---|---|---|---|---|
| Quadrant | DetID | PixID | Counts | Sigma | Mean | Median | Sigma |
| A | 15 | 222 | 324690 | 14912.24 | 100 | 98 | 21.8 |
| A | 10 | 83 | 119368 | 5479.44 | 100 | 98 | 21.8 |
| A | 15 | 174 | 29797 | 1364.42 | 100 | 98 | 21.8 |
| B | 0 | 190 | 38740 | 1847.49 | 98 | 96 | 20.9 |
| B | 0 | 230 | 6605 | 311.18 | 98 | 96 | 20.9 |
| B | 12 | 111 | 2209 | 101.02 | 98 | 96 | 20.9 |
| C | 9 | 187 | 128872 | 5466.3 | 94 | 95 | 23.6 |
| C | 15 | 214 | 36149 | 1530.41 | 94 | 95 | 23.6 |
| C | 15 | 208 | 9692 | 407.37 | 94 | 95 | 23.6 |
| D | 2 | 250 | 41556 | 1606.85 | 97 | 94 | 25.8 |
| D | 2 | 153 | 20770 | 801.29 | 97 | 94 | 25.8 |
| D | 12 | 218 | 16634 | 641.0 | 97 | 94 | 25.8 |
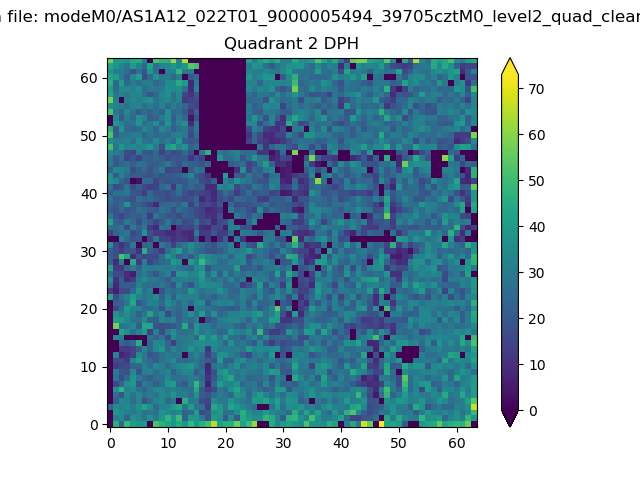
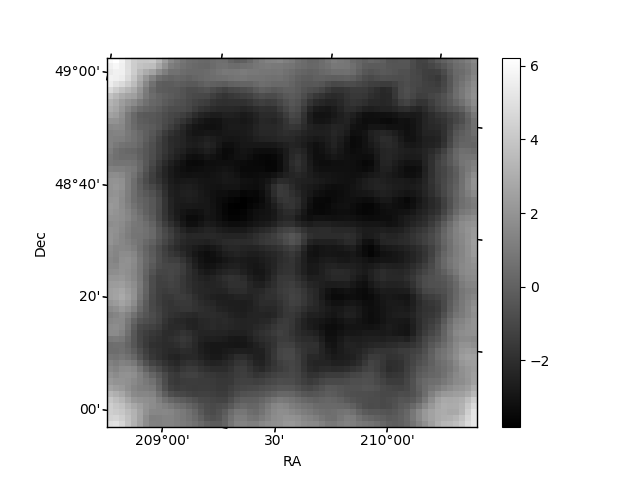
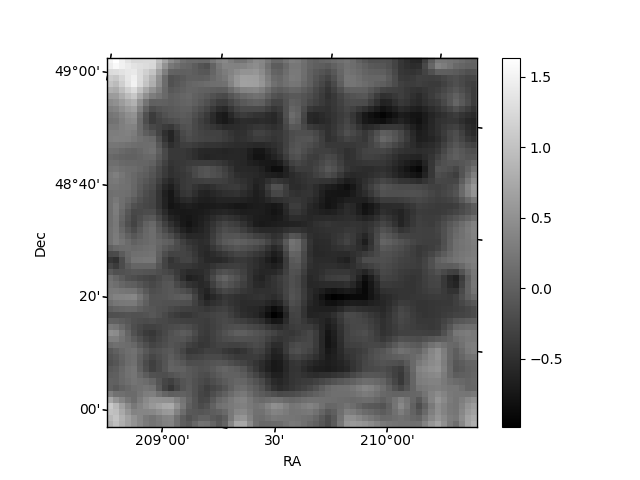
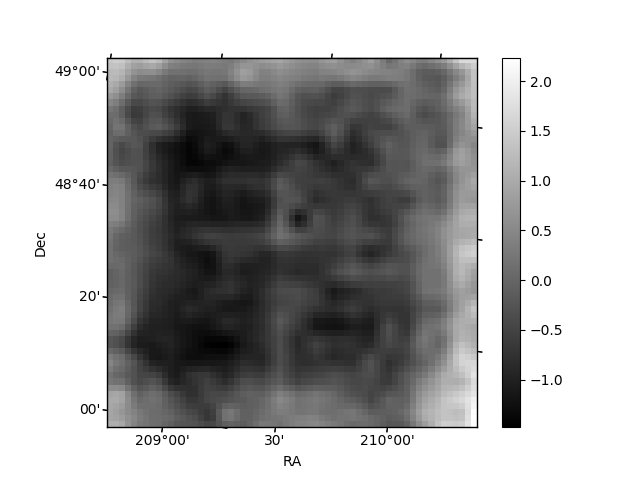
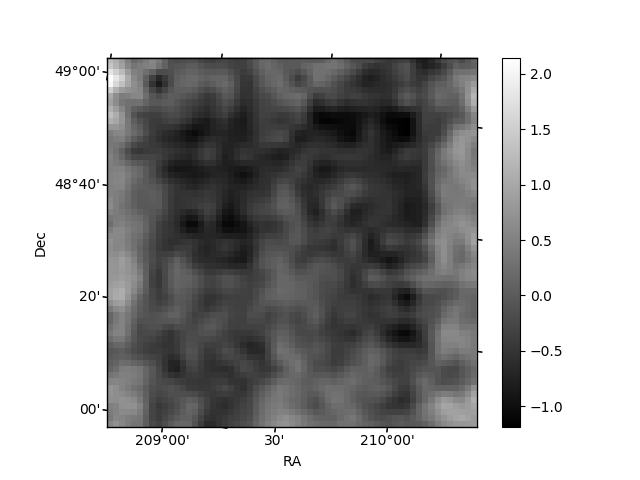
Histogram calculated using DETX and DETY for each event in the final _common_clean file
| Quadrant A | 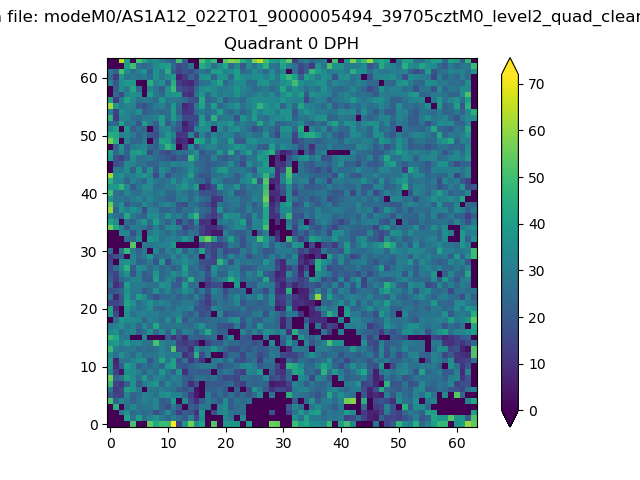 |
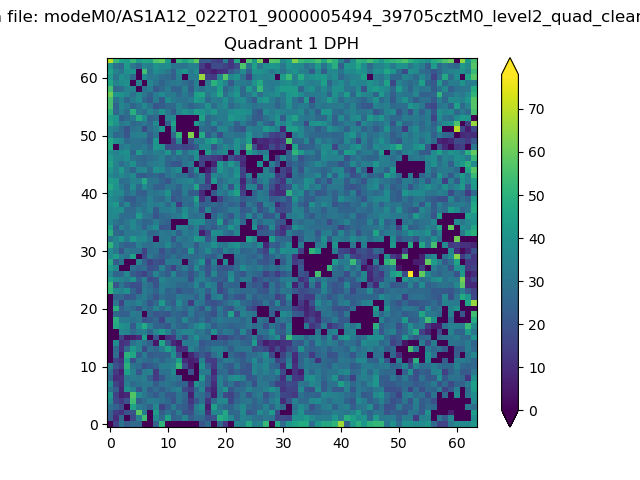 |
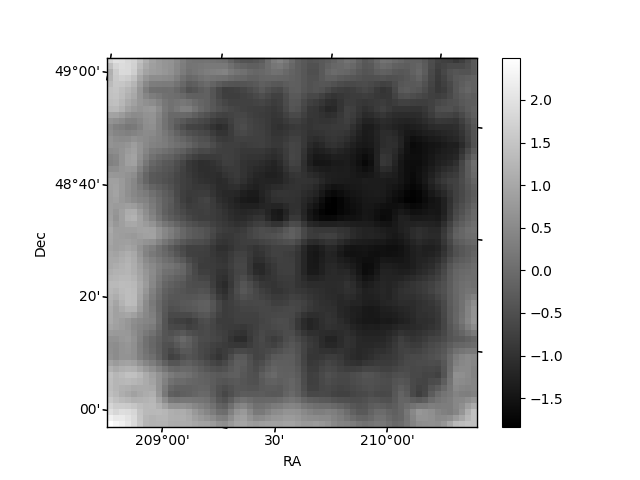
Quadrant B |
|---|---|---|---|
| Quadrant D | 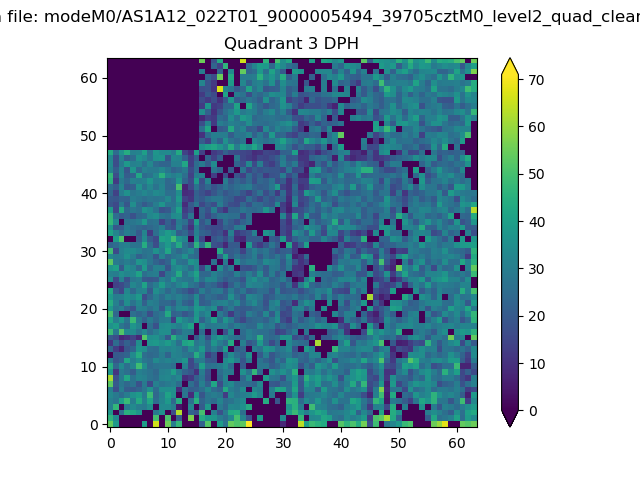 |
 |
Quadrant C |
| Plot type | Count rate plots | Images |
|---|---|---|
| Comparison with Poisson distribution Blue bars denote a histogram of data divided into 1 sec bins. Red curve is a Poisson curve with rate = median count rate of data. |
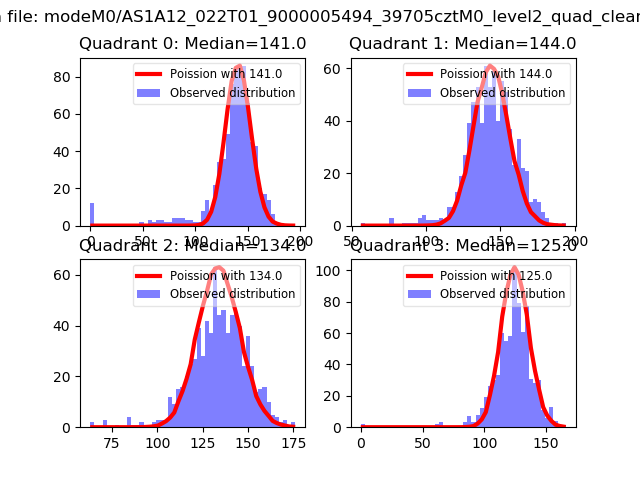 |
 |
| Quadrant-wise count rates Data is divided into 100 sec bins |
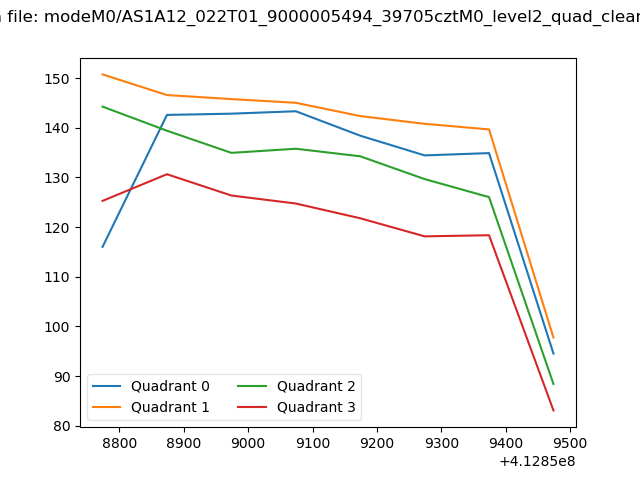 |
|
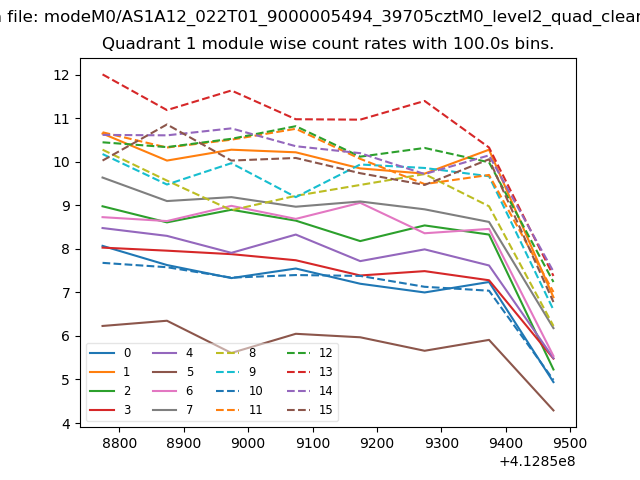
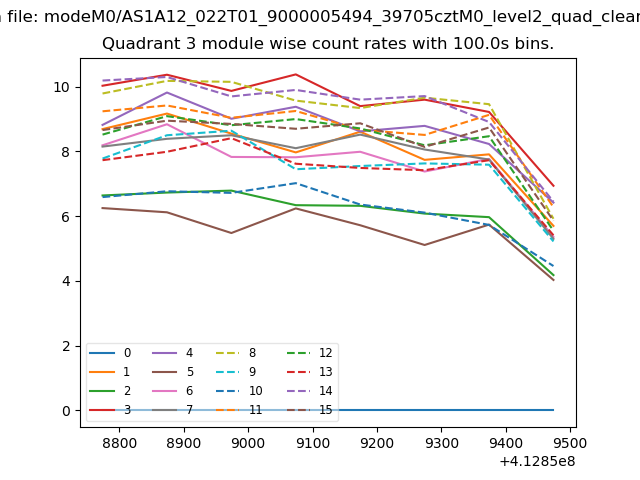
| Module-wise count rates for Quadrant A Data is divided into 100 sec bins |
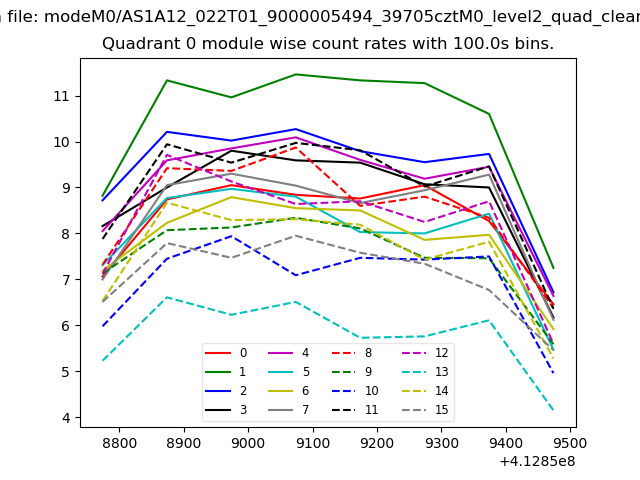 |
 |
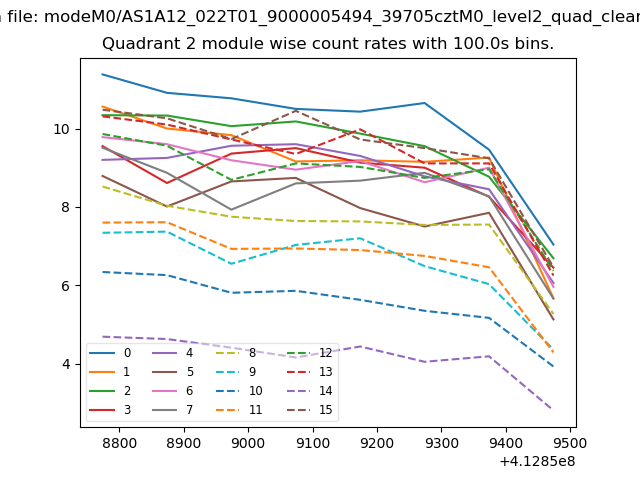
| Module-wise count rates for Quadrant B Data is divided into 100 sec bins |
 |
 |
| Module-wise count rates for Quadrant C Data is divided into 100 sec bins |
 |
 |
| Module-wise count rates for Quadrant D Data is divided into 100 sec bins |
 |
 |
| Parameter | Plot |
|---|---|
| CZT HV Monitor | 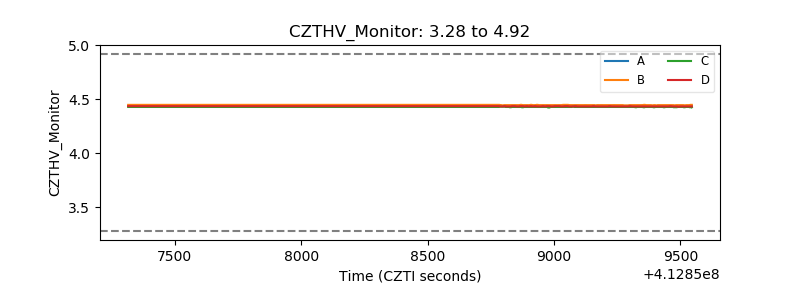 |
| D_VDD |  |
| Temperature 1 | 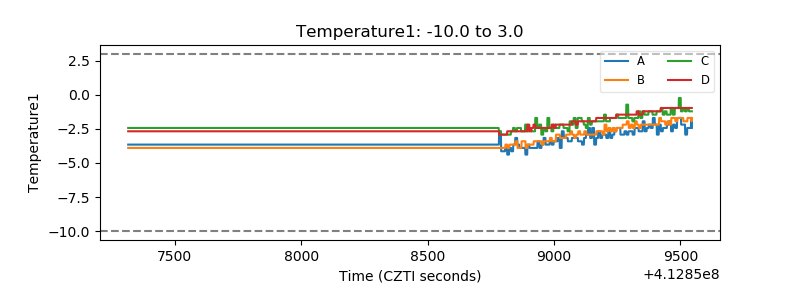 |
| Veto HV Monitor | 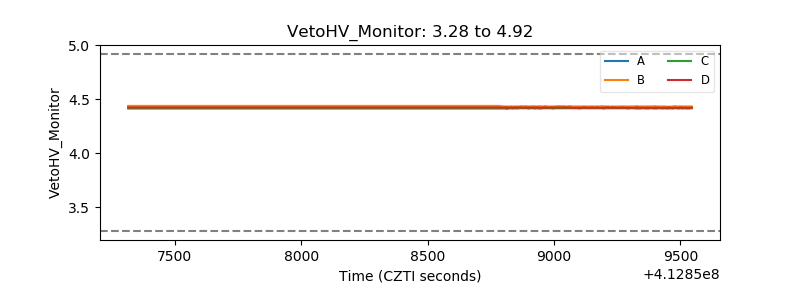 |
| Veto LLD | 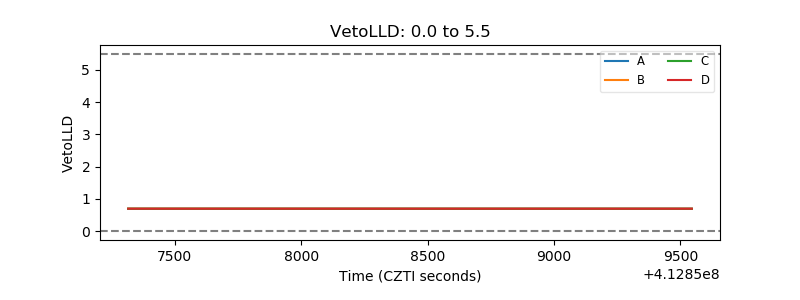 |
| Alpha Counter | 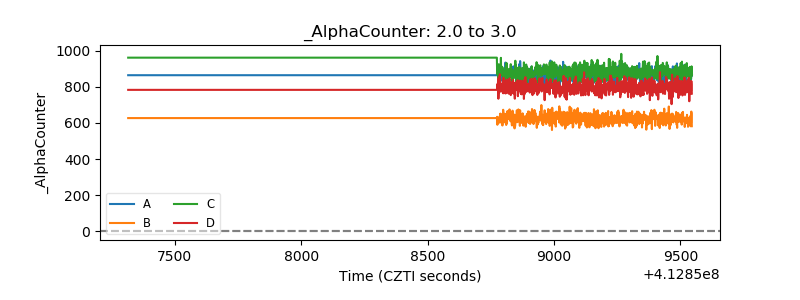 |
| _CPM_Rate | 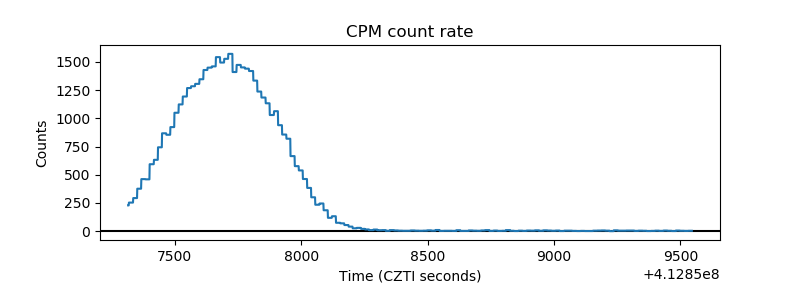 |
| CZT Counter | 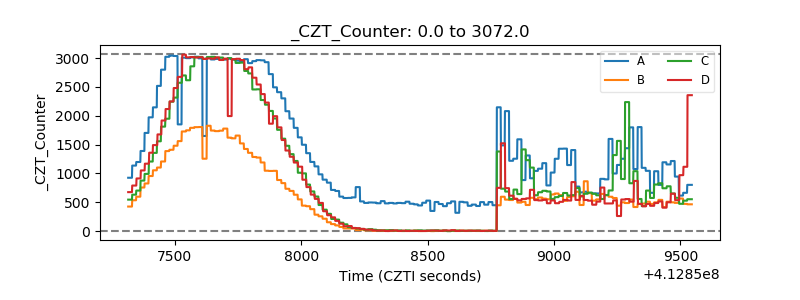 |
| +2.5 Volts monitor | 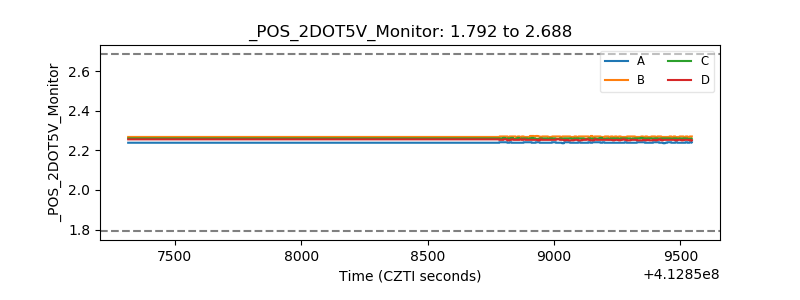 |
| +5 Volts monitor | 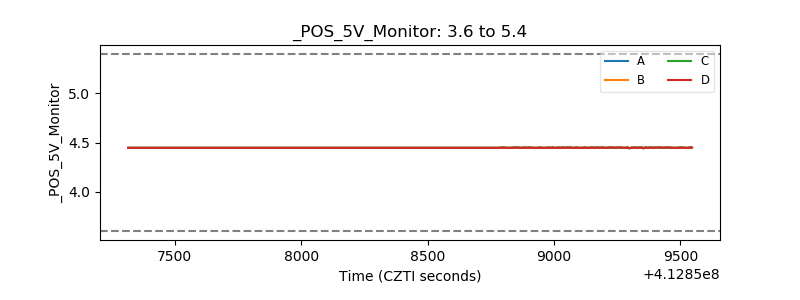 |
| _ROLL_ROT | 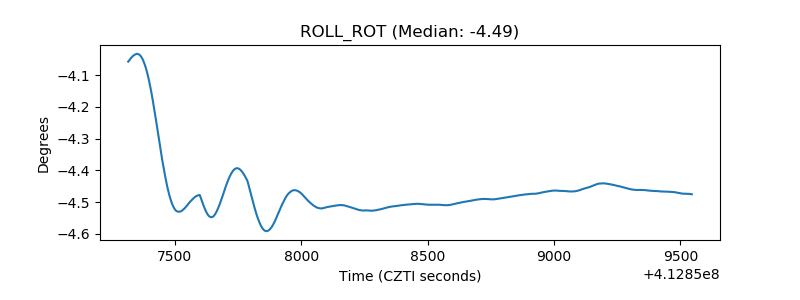 |
| _Roll_DEC | 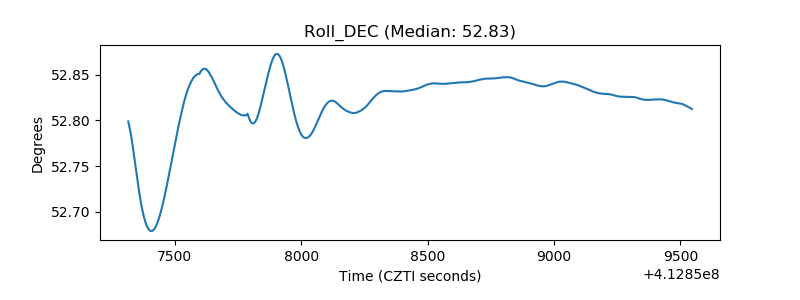 |
| _Roll_RA | 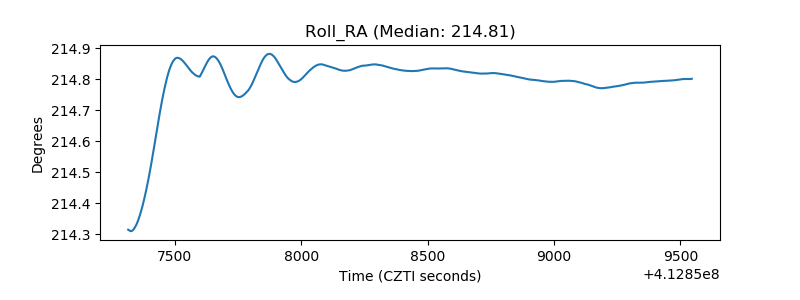 |
| Veto Counter | 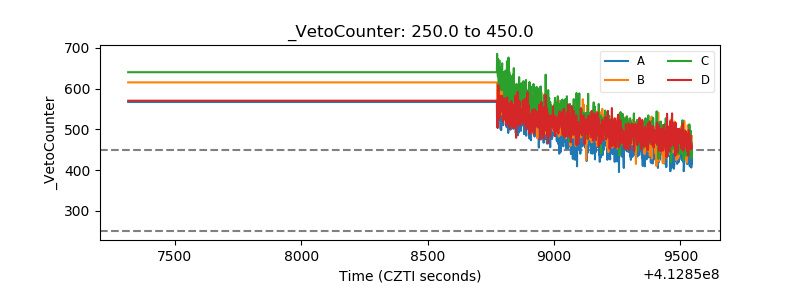 |