| Param | Original file | Final file |
|---|---|---|
| Filename | modeM0/AS1A12_022T01_9000005494_39708cztM0_level2.fits | modeM0/AS1A12_022T01_9000005494_39708cztM0_level2_quad_clean.evt |
| Size (bytes) | 416,675,520 | 93,556,800 |
| Size | 397.4 MB | 89.2 MB |
| Events in quadrant A | 4,722,851 | 614,139 |
| Events in quadrant B | 3,204,886 | 657,794 |
| Events in quadrant C | 4,005,079 | 626,952 |
| Events in quadrant D | 3,104,573 | 584,963 |
| Mode SS | |||
|---|---|---|---|
| Quadrant | BADHDUFLAG | Total packets | Discarded packets |
| A | 0 | 102 | 0 |
| B | 0 | 102 | 0 |
| C | 0 | 102 | 0 |
| D | 0 | 102 | 0 |
| Mode M0 | |||
|---|---|---|---|
| Quadrant | BADHDUFLAG | Total packets | Discarded packets |
| A | 0 | 17640 | 2 |
| B | 0 | 12789 | 1 |
| C | 0 | 15265 | 1 |
| D | 0 | 12523 | 1 |
| Mode M9 | |||
|---|---|---|---|
| Quadrant | BADHDUFLAG | Total packets | Discarded packets |
| A | 0 | 21 | 0 |
| B | 0 | 21 | 0 |
| C | 0 | 21 | 0 |
| D | 0 | 22 | 0 |
| Quadrant | Total seconds | Saturated seconds | Saturation percentage |
|---|---|---|---|
| A | 4979 | 470 | 9.439647% |
| B | 4979 | 202 | 4.057040% |
| C | 4979 | 133 | 2.671219% |
| D | 4979 | 110 | 2.209279% |
Noise dominated data is calculated using 1-second bins in cleaned event files. If a bin has >2000 counts, and if more than 50% of those come from <1% of pixels, then it is considered to be noise-dominated and hence unusable.
| Quadrant | # 1 sec bins | Bins with >0 counts | Bins with >2000 counts | High rate bins dominated by noise | Noise dominated (total time) | Noise dominated (detector-on time) | Marked lightcurve |
|---|---|---|---|---|---|---|---|
| A | 7131 | 4980 | 325 | 325 | 4.56% | 6.53% | 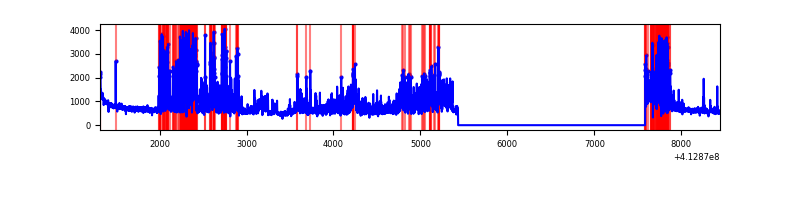 |
| B | 7131 | 4980 | 99 | 99 | 1.39% | 1.99% | 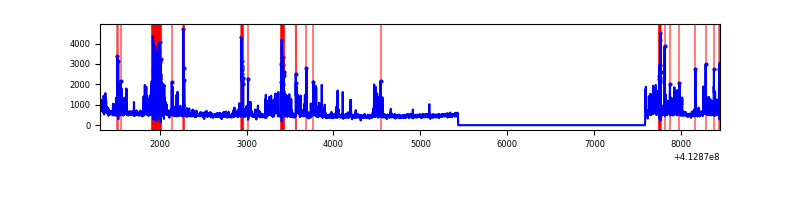 |
| C | 7131 | 4980 | 127 | 127 | 1.78% | 2.55% | 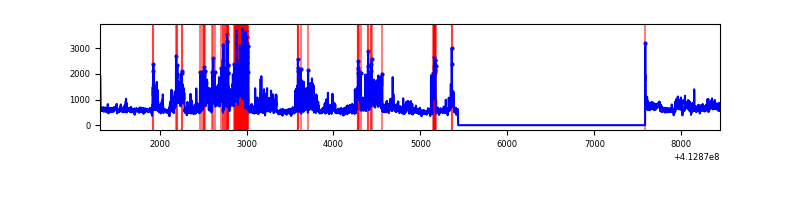 |
| D | 7131 | 4980 | 91 | 91 | 1.28% | 1.83% | 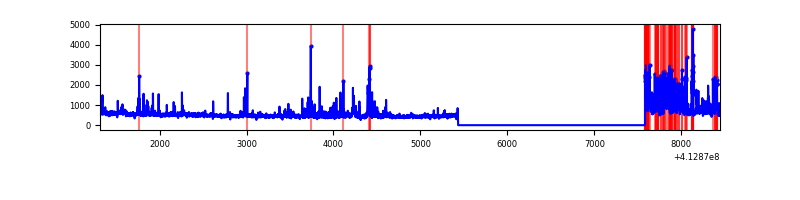 |
Top three noisy pixels from each quadrant. If the there are fewer than three noisy pixels in the level2.evt file, extra rows are filled as -1
| Pixel properties | Quadrant properties | ||||||
|---|---|---|---|---|---|---|---|
| Quadrant | DetID | PixID | Counts | Sigma | Mean | Median | Sigma |
| A | 13 | 248 | 1087891 | 9294.26 | 578 | 569 | 117.0 |
| A | 15 | 222 | 865381 | 7392.28 | 578 | 569 | 117.0 |
| A | 10 | 83 | 430382 | 3673.98 | 578 | 569 | 117.0 |
| B | 5 | 172 | 763132 | 6866.4 | 591 | 576 | 111.1 |
| B | 0 | 190 | 106833 | 956.78 | 591 | 576 | 111.1 |
| B | 12 | 111 | 13135 | 113.08 | 591 | 576 | 111.1 |
| C | 15 | 208 | 884778 | 6593.55 | 586 | 592 | 134.1 |
| C | 9 | 187 | 510116 | 3799.62 | 586 | 592 | 134.1 |
| C | 15 | 214 | 203565 | 1513.61 | 586 | 592 | 134.1 |
| D | 12 | 233 | 411833 | 2882.07 | 588 | 573 | 142.7 |
| D | 13 | 171 | 140104 | 977.82 | 588 | 573 | 142.7 |
| D | 12 | 218 | 58055 | 402.83 | 588 | 573 | 142.7 |
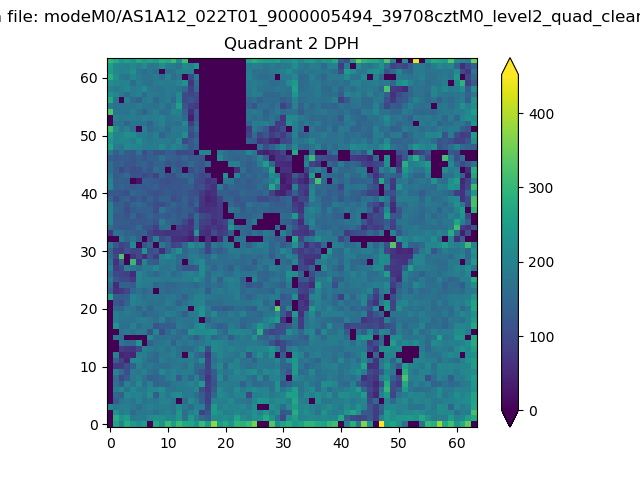
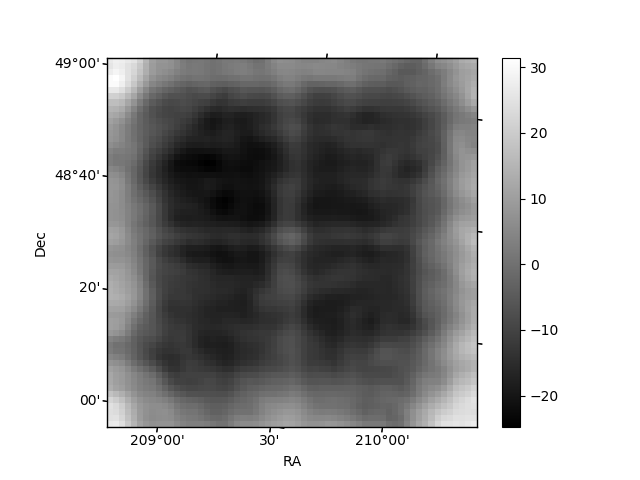
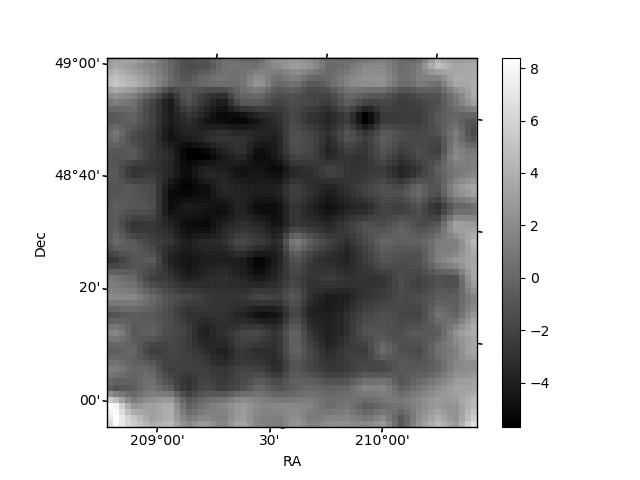
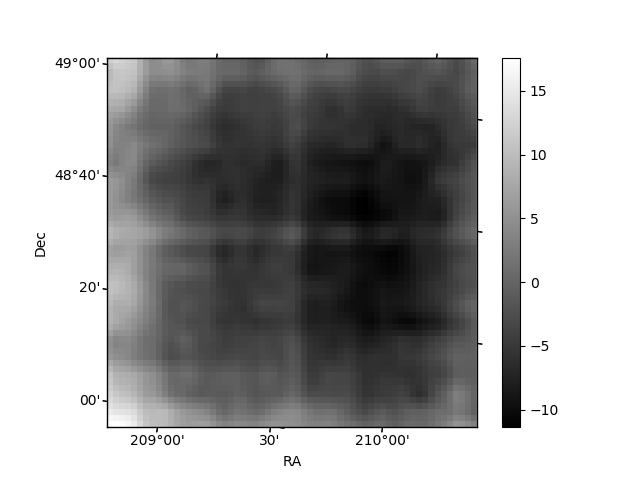
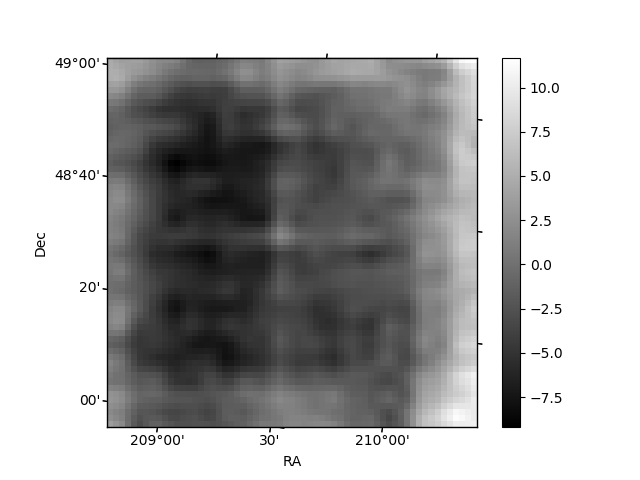
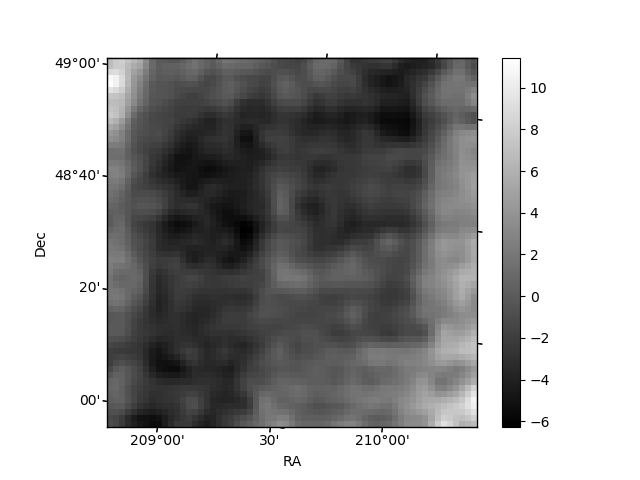
Histogram calculated using DETX and DETY for each event in the final _common_clean file
| Quadrant A | 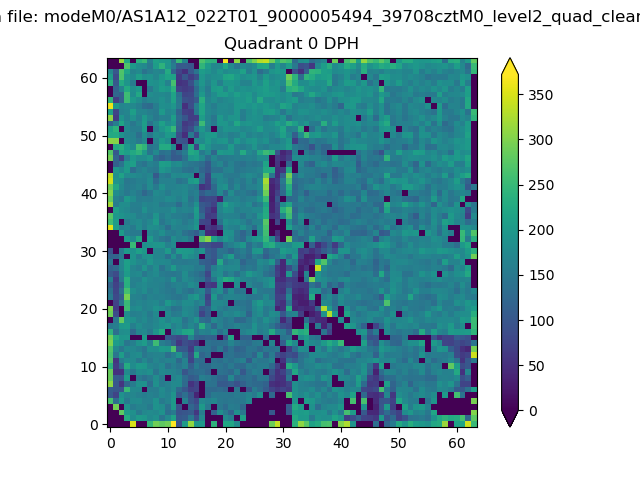 |
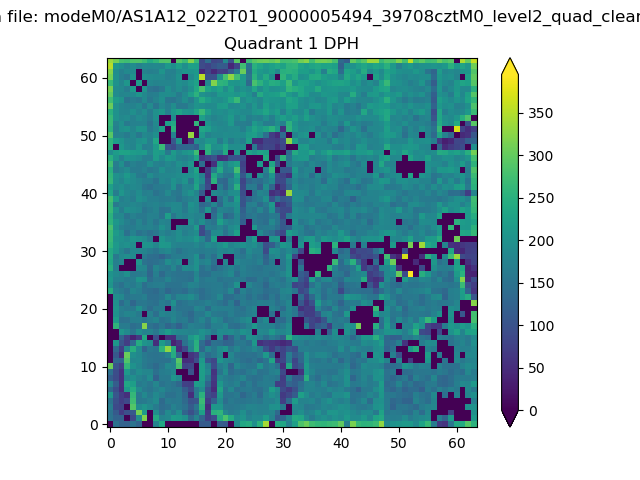 |
Quadrant B |
|---|---|---|---|
| Quadrant D | 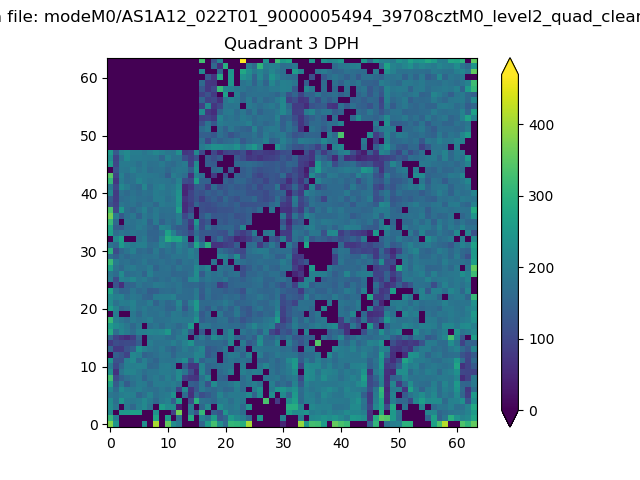 |
 |
Quadrant C |
| Plot type | Count rate plots | Images |
|---|---|---|
| Comparison with Poisson distribution Blue bars denote a histogram of data divided into 1 sec bins. Red curve is a Poisson curve with rate = median count rate of data. |
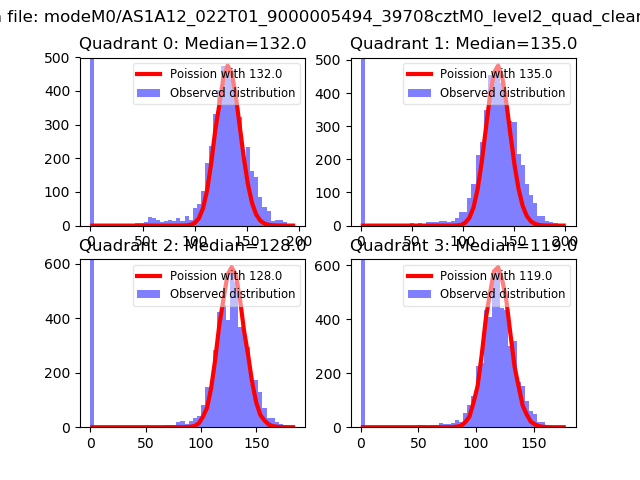 |
 |
| Quadrant-wise count rates Data is divided into 100 sec bins |
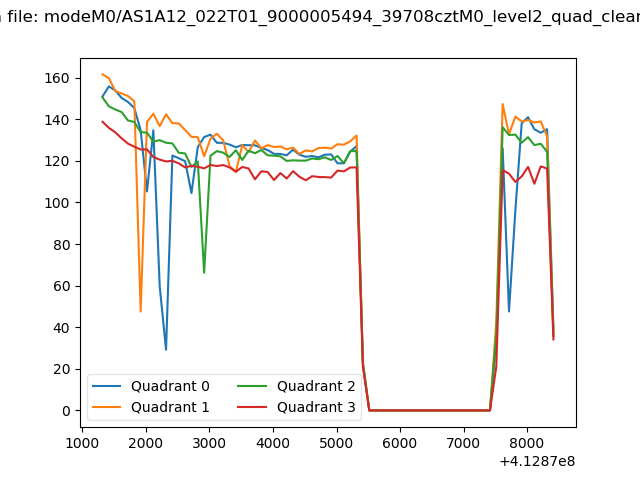 |
|
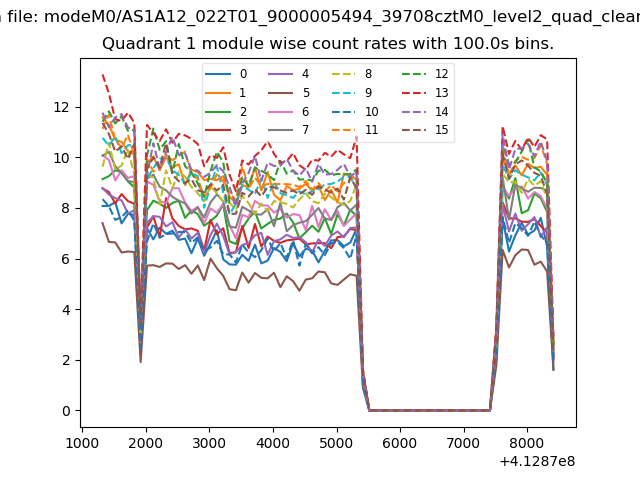
| Module-wise count rates for Quadrant A Data is divided into 100 sec bins |
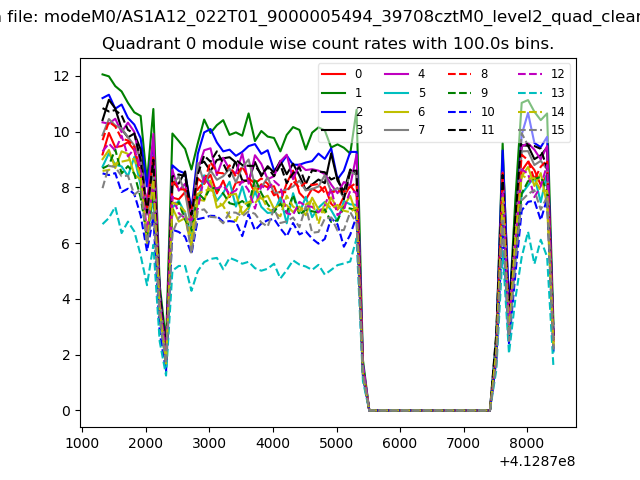 |
 |
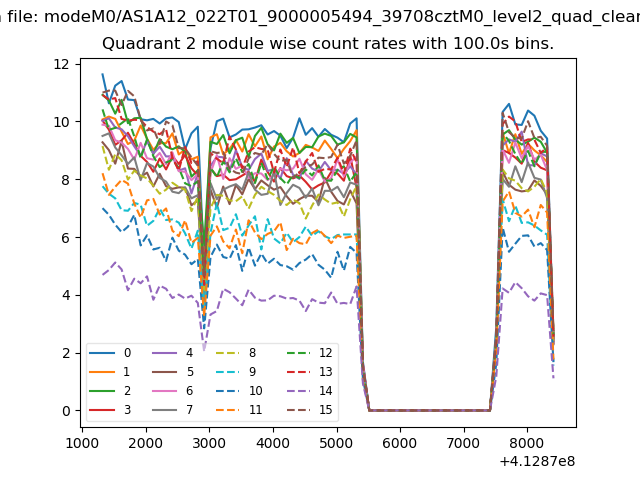
| Module-wise count rates for Quadrant B Data is divided into 100 sec bins |
 |
 |
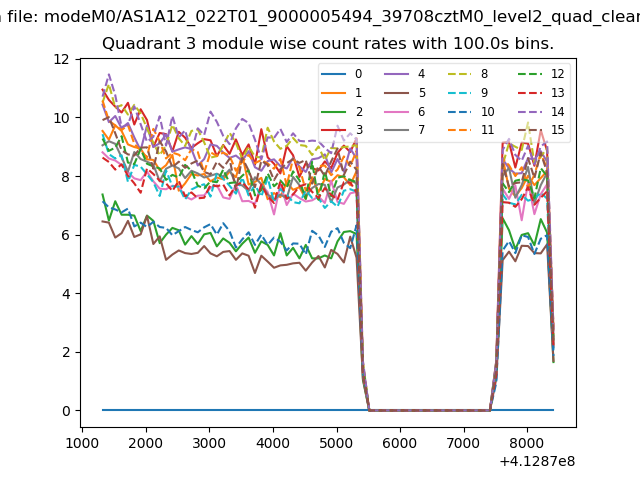
| Module-wise count rates for Quadrant C Data is divided into 100 sec bins |
 |
 |
| Module-wise count rates for Quadrant D Data is divided into 100 sec bins |
 |
 |
| Parameter | Plot |
|---|---|
| CZT HV Monitor | 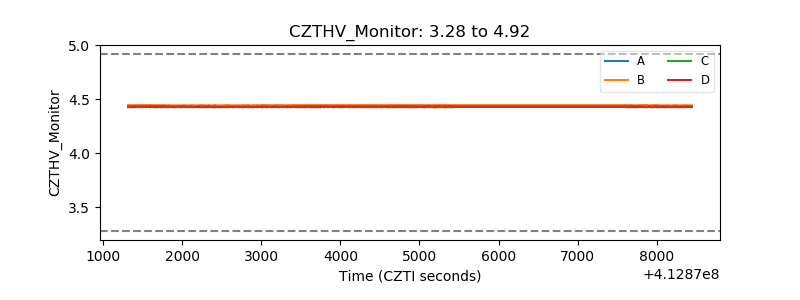 |
| D_VDD | 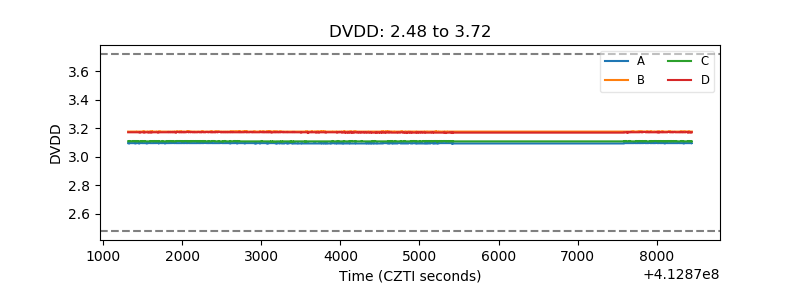 |
| Temperature 1 | 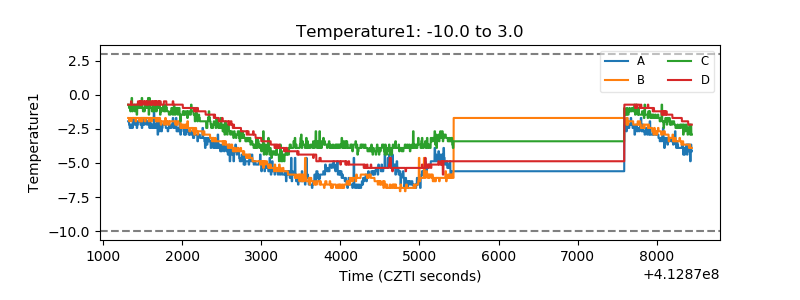 |
| Veto HV Monitor | 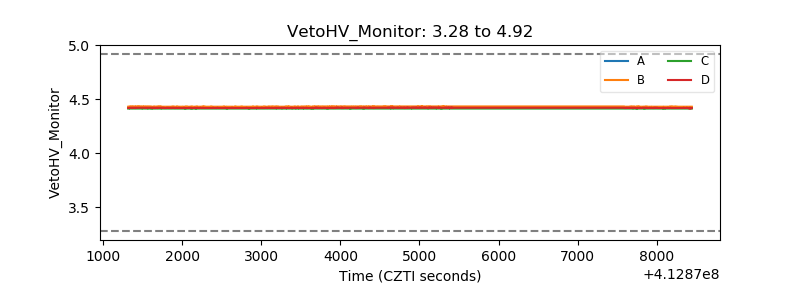 |
| Veto LLD | 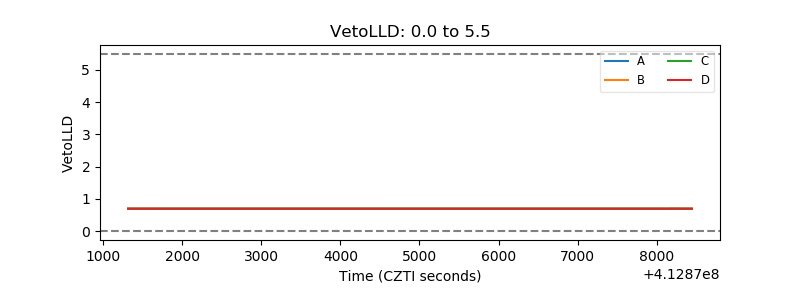 |
| Alpha Counter | 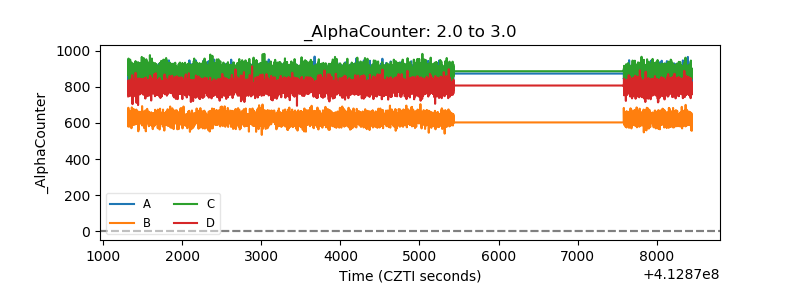 |
| _CPM_Rate | 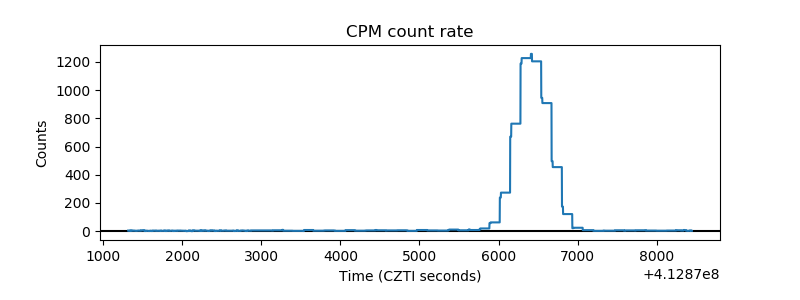 |
| CZT Counter | 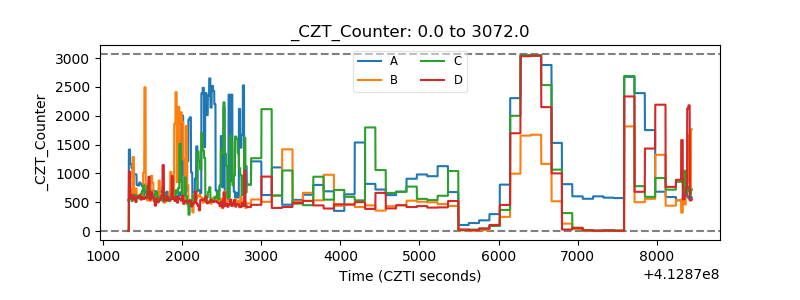 |
| +2.5 Volts monitor | 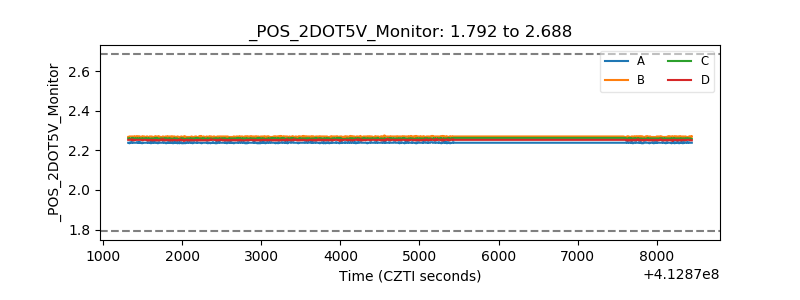 |
| +5 Volts monitor | 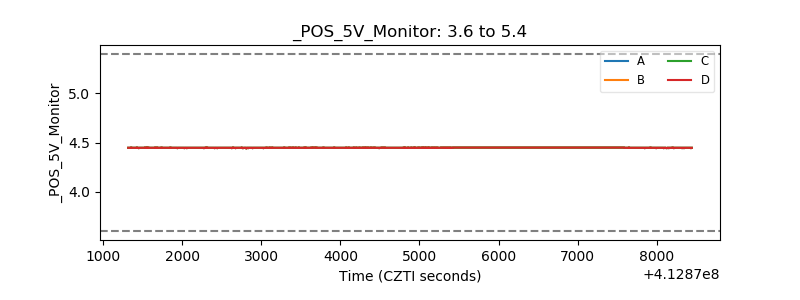 |
| _ROLL_ROT | 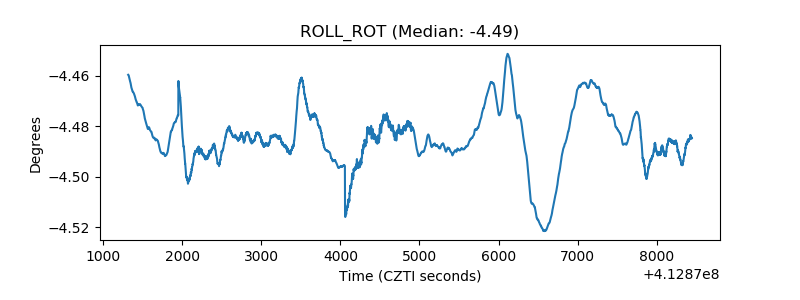 |
| _Roll_DEC | 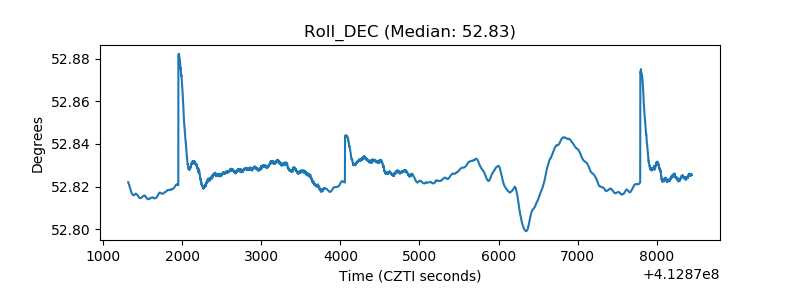 |
| _Roll_RA | 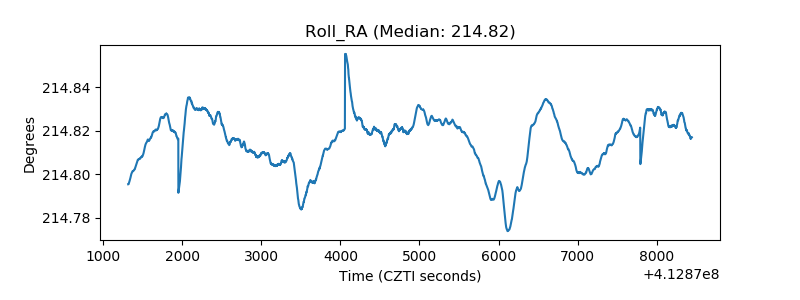 |
| Veto Counter | 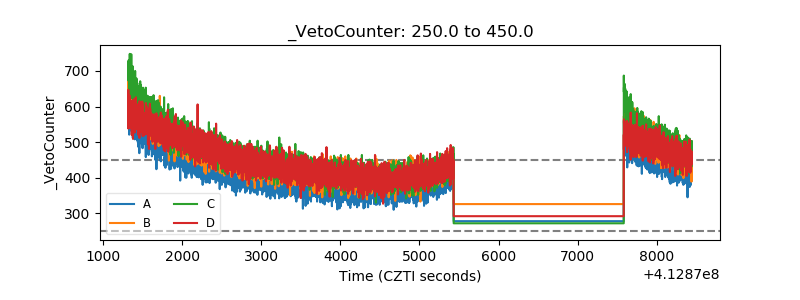 |