| Param | Original file | Final file |
|---|---|---|
| Filename | modeM0/AS1A12_022T01_9000005494_39709cztM0_level2.fits | modeM0/AS1A12_022T01_9000005494_39709cztM0_level2_quad_clean.evt |
| Size (bytes) | 373,245,120 | 90,069,120 |
| Size | 356.0 MB | 85.9 MB |
| Events in quadrant A | 3,322,985 | 603,169 |
| Events in quadrant B | 2,910,881 | 630,761 |
| Events in quadrant C | 3,587,107 | 598,052 |
| Events in quadrant D | 3,608,991 | 546,859 |
| Mode SS | |||
|---|---|---|---|
| Quadrant | BADHDUFLAG | Total packets | Discarded packets |
| A | 0 | 102 | 0 |
| B | 0 | 102 | 0 |
| C | 0 | 102 | 0 |
| D | 0 | 102 | 0 |
| Mode M0 | |||
|---|---|---|---|
| Quadrant | BADHDUFLAG | Total packets | Discarded packets |
| A | 0 | 13003 | 3 |
| B | 0 | 11908 | 2 |
| C | 0 | 14031 | 2 |
| D | 0 | 14169 | 2 |
| Mode M9 | |||
|---|---|---|---|
| Quadrant | BADHDUFLAG | Total packets | Discarded packets |
| A | 0 | 31 | 0 |
| B | 0 | 31 | 0 |
| C | 0 | 31 | 0 |
| D | 0 | 32 | 0 |
| Quadrant | Total seconds | Saturated seconds | Saturation percentage |
|---|---|---|---|
| A | 4968 | 227 | 4.569243% |
| B | 4968 | 99 | 1.992754% |
| C | 4968 | 102 | 2.053140% |
| D | 4968 | 213 | 4.287440% |
Noise dominated data is calculated using 1-second bins in cleaned event files. If a bin has >2000 counts, and if more than 50% of those come from <1% of pixels, then it is considered to be noise-dominated and hence unusable.
| Quadrant | # 1 sec bins | Bins with >0 counts | Bins with >2000 counts | High rate bins dominated by noise | Noise dominated (total time) | Noise dominated (detector-on time) | Marked lightcurve |
|---|---|---|---|---|---|---|---|
| A | 7091 | 4969 | 159 | 159 | 2.24% | 3.20% | 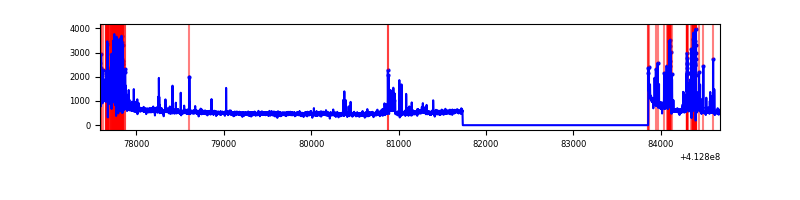 |
| B | 7091 | 4969 | 46 | 46 | 0.65% | 0.93% | 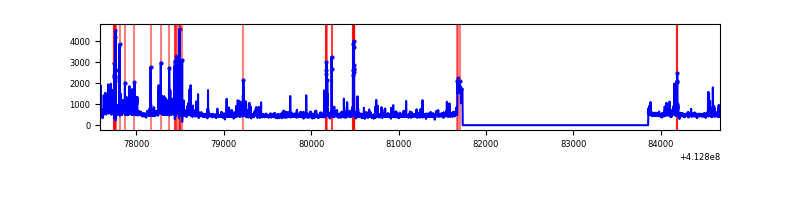 |
| C | 7091 | 4969 | 88 | 88 | 1.24% | 1.77% | 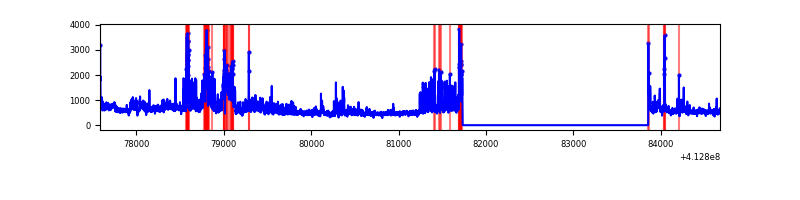 |
| D | 7091 | 4969 | 184 | 184 | 2.59% | 3.70% | 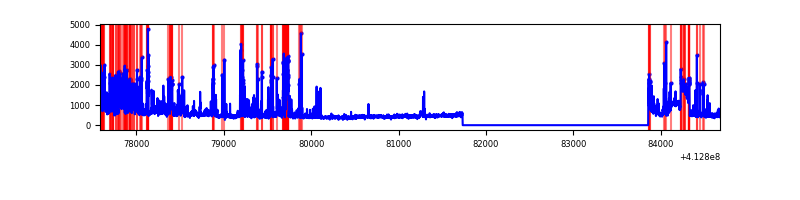 |
Top three noisy pixels from each quadrant. If the there are fewer than three noisy pixels in the level2.evt file, extra rows are filled as -1
| Pixel properties | Quadrant properties | ||||||
|---|---|---|---|---|---|---|---|
| Quadrant | DetID | PixID | Counts | Sigma | Mean | Median | Sigma |
| A | 13 | 248 | 587561 | 5141.16 | 566 | 556 | 114.2 |
| A | 10 | 83 | 430395 | 3764.66 | 566 | 556 | 114.2 |
| A | 15 | 174 | 68929 | 598.83 | 566 | 556 | 114.2 |
| B | 5 | 172 | 505547 | 4655.42 | 573 | 559 | 108.5 |
| B | 5 | 255 | 74048 | 677.49 | 573 | 559 | 108.5 |
| B | 0 | 190 | 41071 | 373.48 | 573 | 559 | 108.5 |
| C | 15 | 208 | 634955 | 4882.9 | 564 | 568 | 129.9 |
| C | 9 | 187 | 509499 | 3917.26 | 564 | 568 | 129.9 |
| C | 15 | 214 | 203284 | 1560.31 | 564 | 568 | 129.9 |
| D | 12 | 233 | 663240 | 4832.08 | 559 | 544 | 137.1 |
| D | 13 | 249 | 381955 | 2781.08 | 559 | 544 | 137.1 |
| D | 13 | 171 | 198680 | 1444.72 | 559 | 544 | 137.1 |
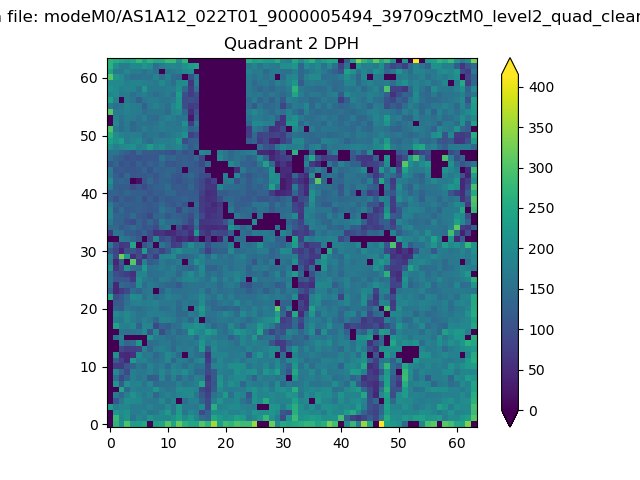
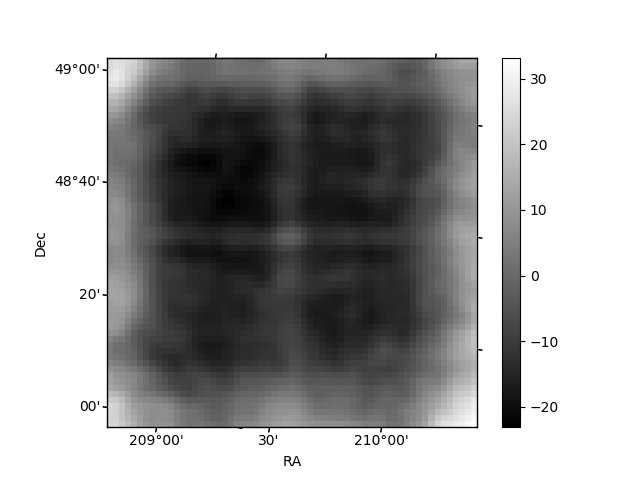
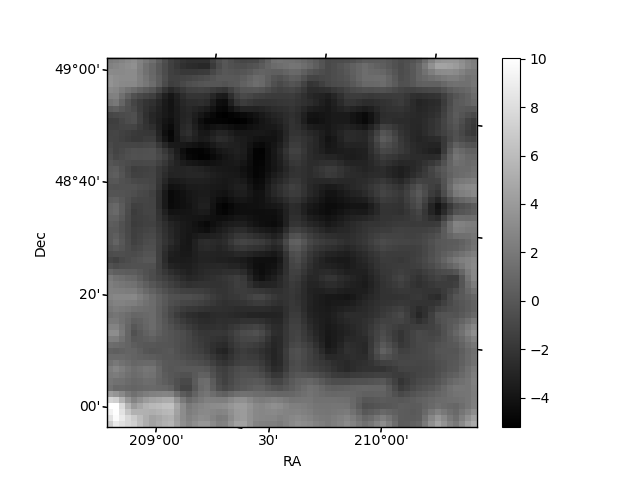
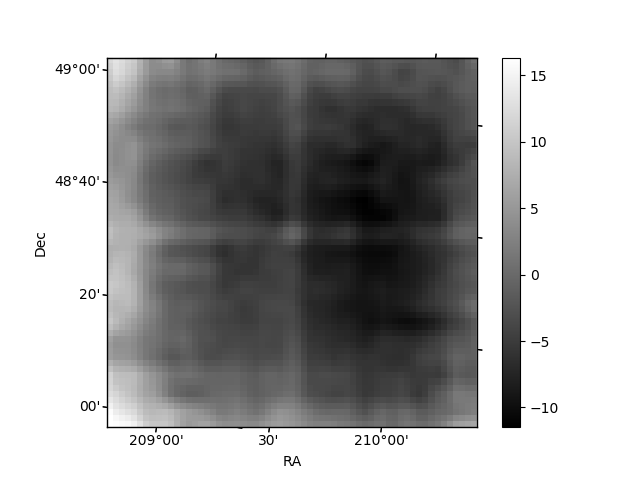
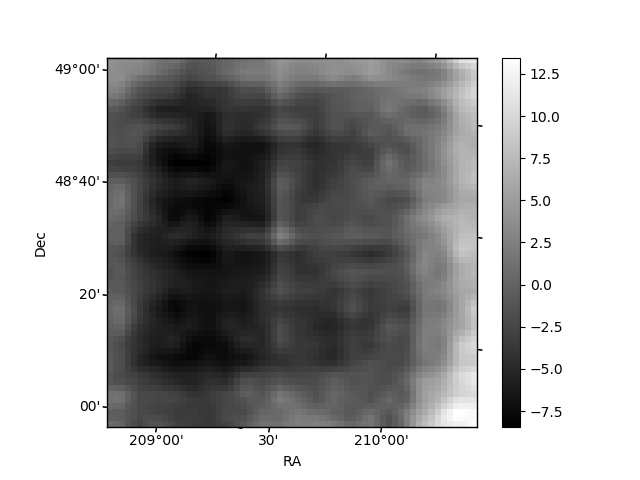
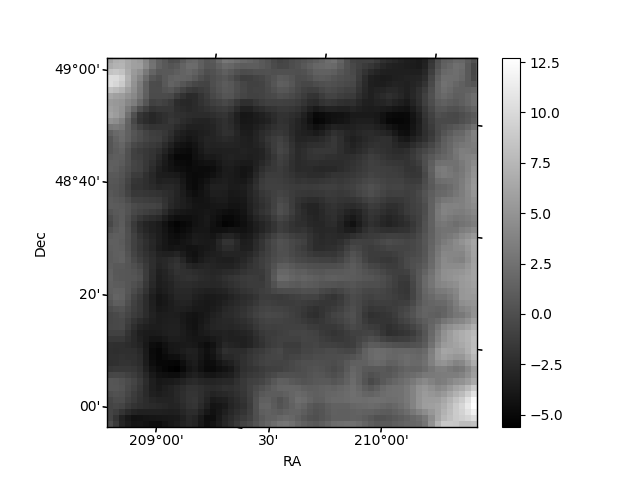
Histogram calculated using DETX and DETY for each event in the final _common_clean file
| Quadrant A | 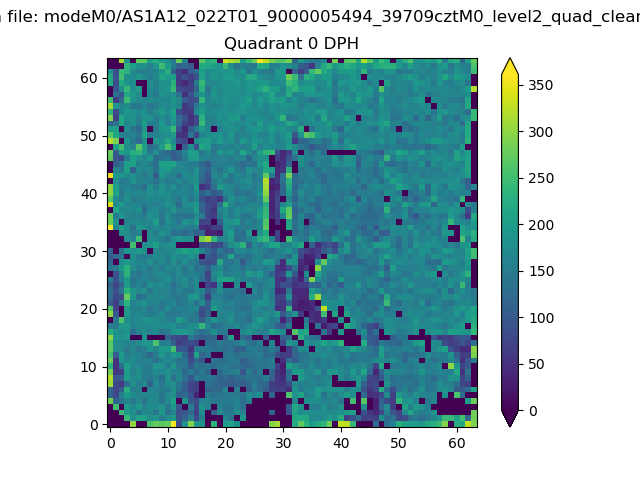 |
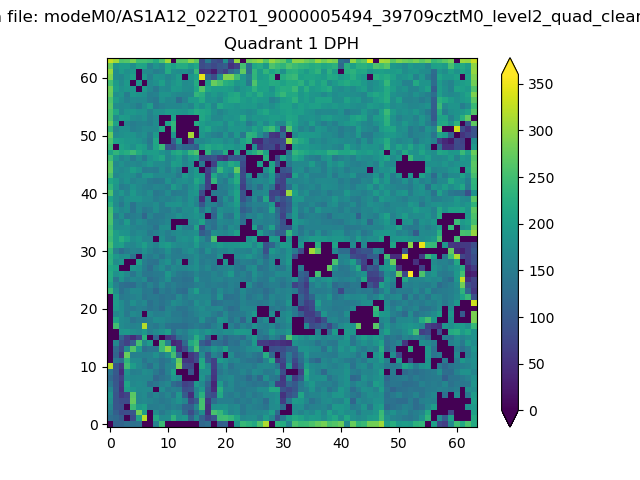 |
Quadrant B |
|---|---|---|---|
| Quadrant D | 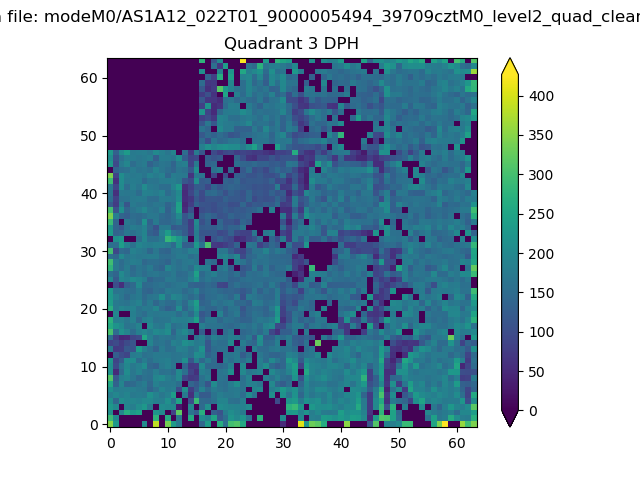 |
 |
Quadrant C |
| Plot type | Count rate plots | Images |
|---|---|---|
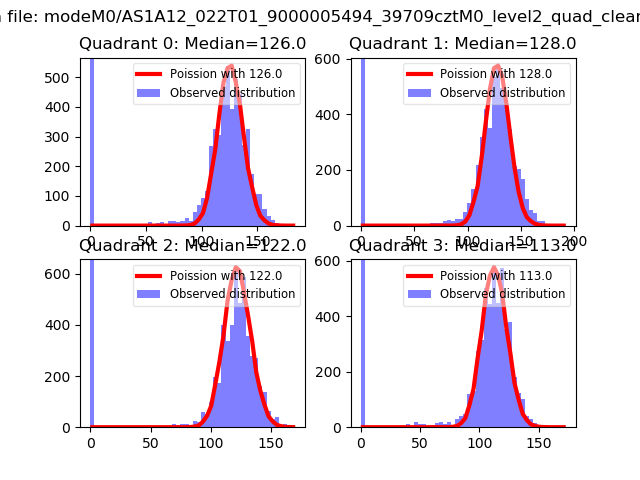
| Comparison with Poisson distribution Blue bars denote a histogram of data divided into 1 sec bins. Red curve is a Poisson curve with rate = median count rate of data. |
 |
 |
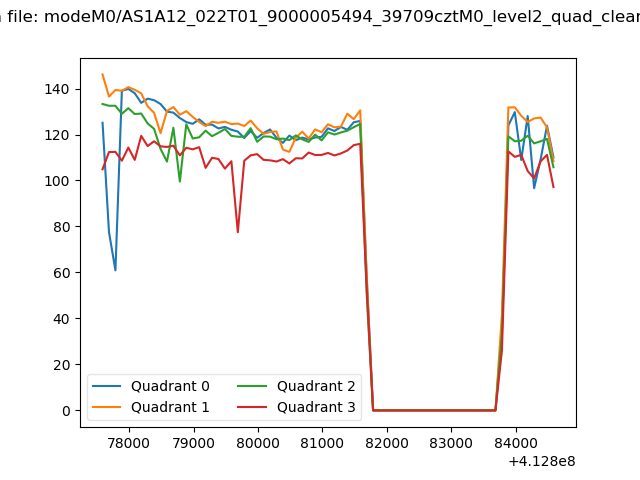
| Quadrant-wise count rates Data is divided into 100 sec bins |
 |
|
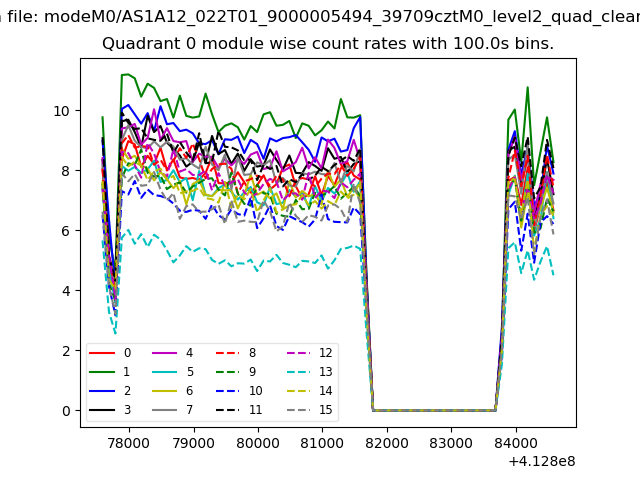
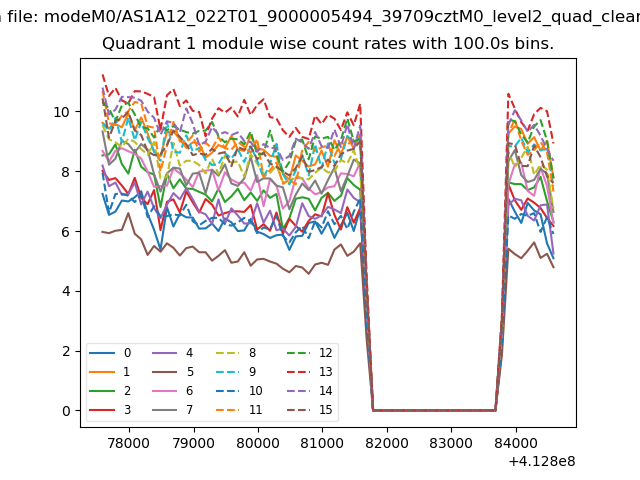
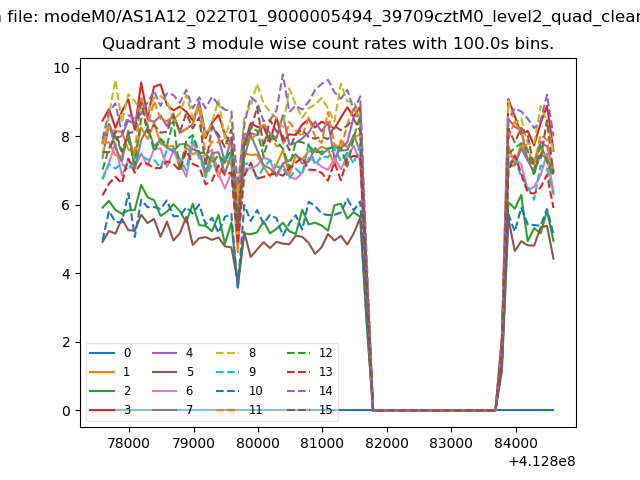
| Module-wise count rates for Quadrant A Data is divided into 100 sec bins |
 |
 |
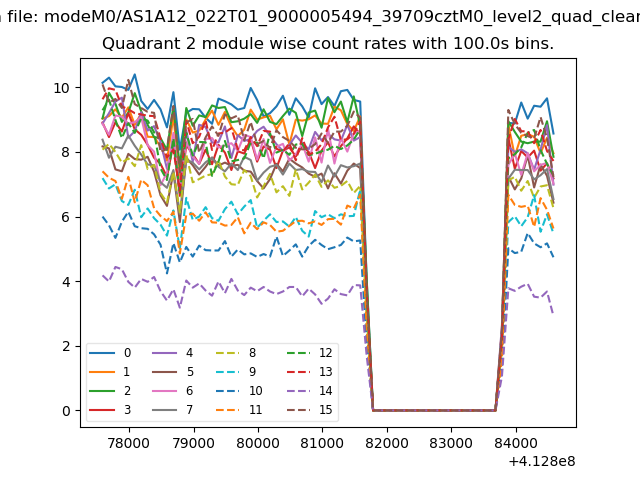
| Module-wise count rates for Quadrant B Data is divided into 100 sec bins |
 |
 |
| Module-wise count rates for Quadrant C Data is divided into 100 sec bins |
 |
 |
| Module-wise count rates for Quadrant D Data is divided into 100 sec bins |
 |
 |
| Parameter | Plot |
|---|---|
| CZT HV Monitor | 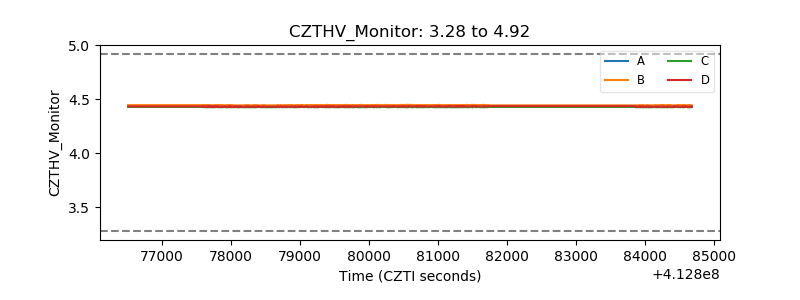 |
| D_VDD | 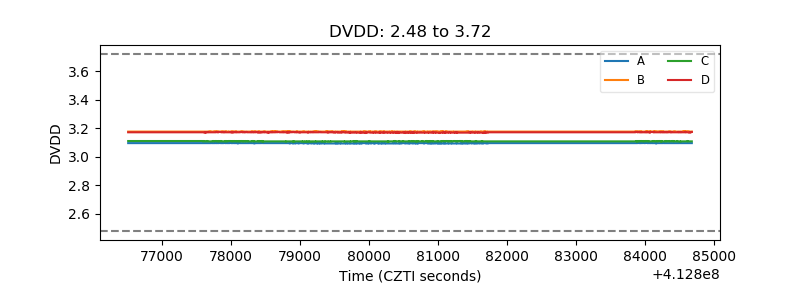 |
| Temperature 1 | 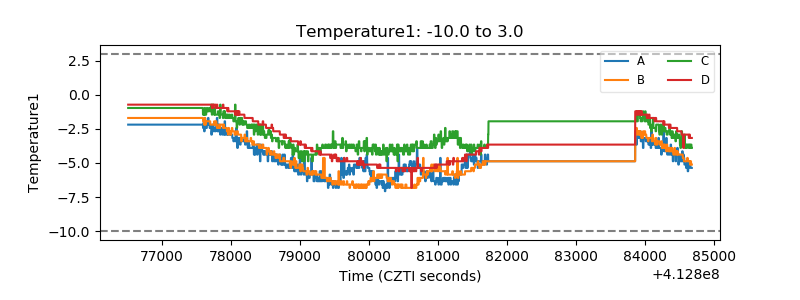 |
| Veto HV Monitor | 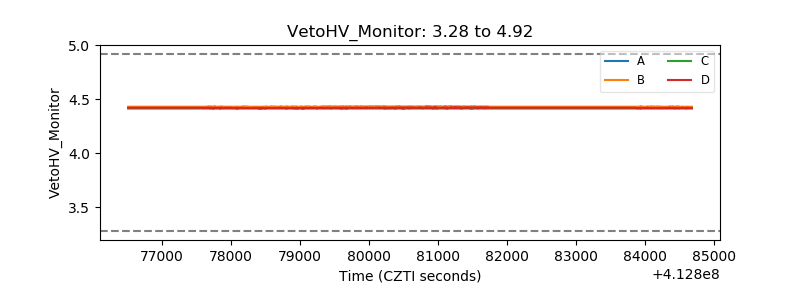 |
| Veto LLD | 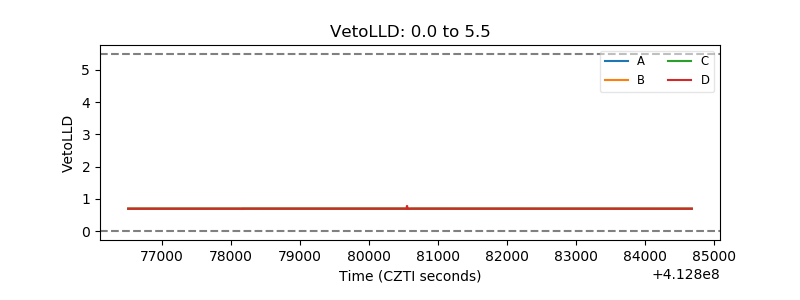 |
| Alpha Counter | 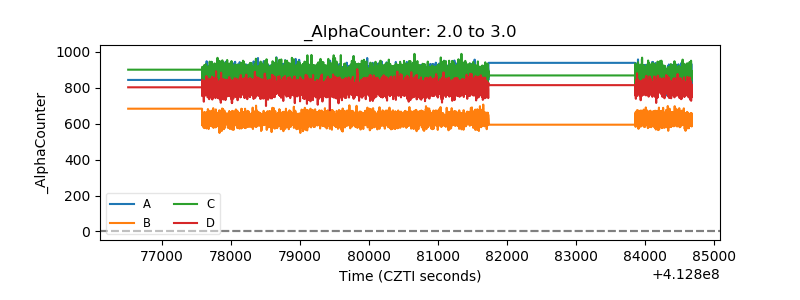 |
| _CPM_Rate | 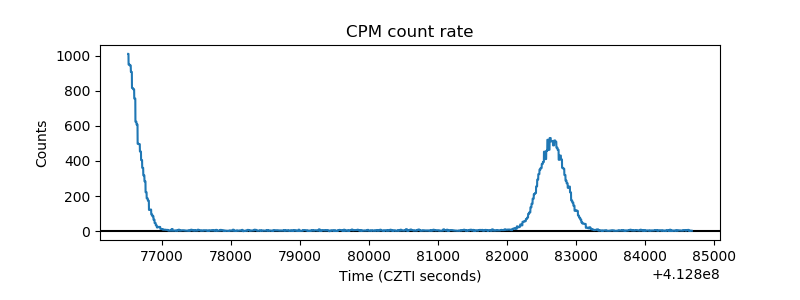 |
| CZT Counter | 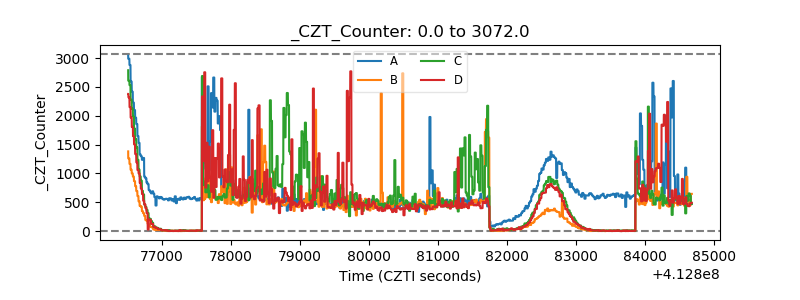 |
| +2.5 Volts monitor | 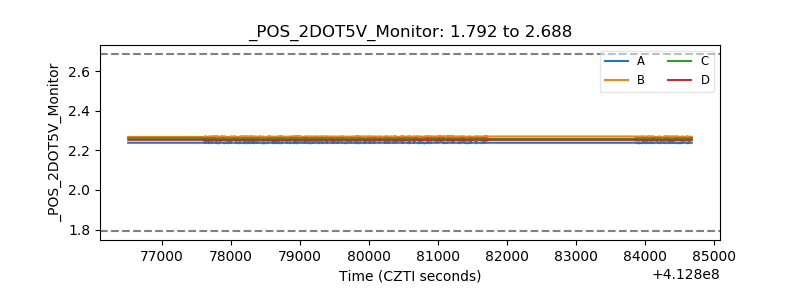 |
| +5 Volts monitor | 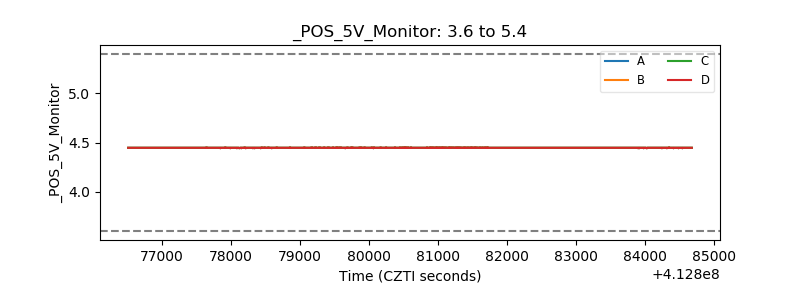 |
| _ROLL_ROT | 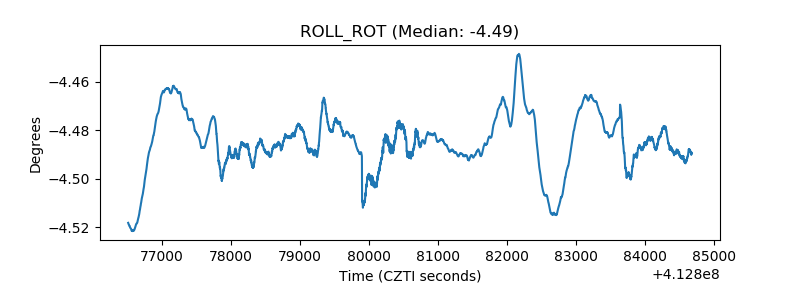 |
| _Roll_DEC | 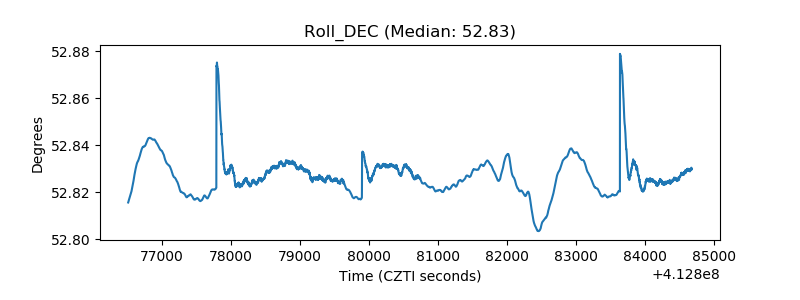 |
| _Roll_RA | 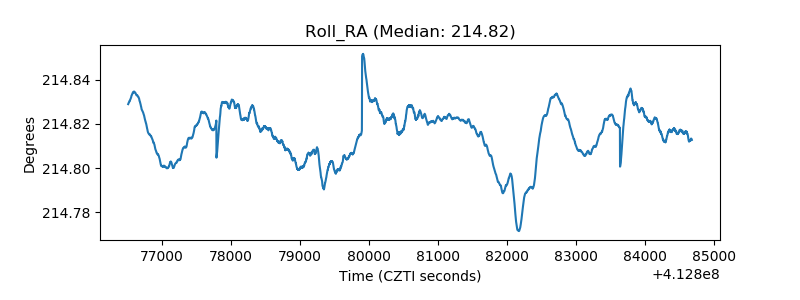 |
| Veto Counter | 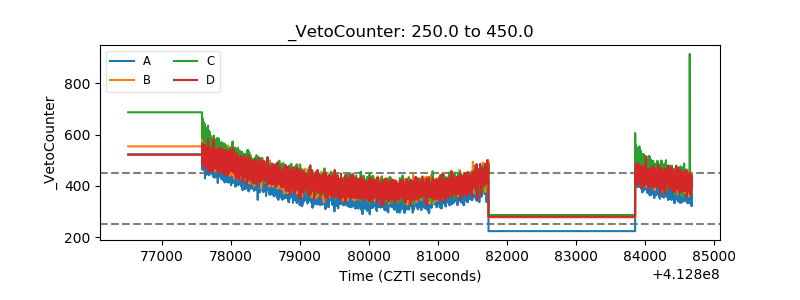 |