| Param | Original file | Final file |
|---|---|---|
| Filename | modeM0/AS1A12_022T01_9000005494_39710cztM0_level2.fits | modeM0/AS1A12_022T01_9000005494_39710cztM0_level2_quad_clean.evt |
| Size (bytes) | 388,658,880 | 85,985,280 |
| Size | 370.7 MB | 82.0 MB |
| Events in quadrant A | 3,454,512 | 570,614 |
| Events in quadrant B | 2,415,979 | 611,944 |
| Events in quadrant C | 4,723,863 | 537,597 |
| Events in quadrant D | 3,395,541 | 526,599 |
| Mode SS | |||
|---|---|---|---|
| Quadrant | BADHDUFLAG | Total packets | Discarded packets |
| A | 0 | 102 | 0 |
| B | 0 | 102 | 0 |
| C | 0 | 102 | 0 |
| D | 0 | 102 | 0 |
| Mode M0 | |||
|---|---|---|---|
| Quadrant | BADHDUFLAG | Total packets | Discarded packets |
| A | 0 | 13438 | 3 |
| B | 0 | 10566 | 2 |
| C | 0 | 17389 | 2 |
| D | 0 | 13787 | 2 |
| Mode M9 | |||
|---|---|---|---|
| Quadrant | BADHDUFLAG | Total packets | Discarded packets |
| A | 0 | 21 | 0 |
| B | 0 | 21 | 0 |
| C | 0 | 21 | 0 |
| D | 0 | 22 | 0 |
| Quadrant | Total seconds | Saturated seconds | Saturation percentage |
|---|---|---|---|
| A | 5099 | 315 | 6.177682% |
| B | 5099 | 11 | 0.215729% |
| C | 5099 | 511 | 10.021573% |
| D | 5099 | 186 | 3.647774% |
Noise dominated data is calculated using 1-second bins in cleaned event files. If a bin has >2000 counts, and if more than 50% of those come from <1% of pixels, then it is considered to be noise-dominated and hence unusable.
| Quadrant | # 1 sec bins | Bins with >0 counts | Bins with >2000 counts | High rate bins dominated by noise | Noise dominated (total time) | Noise dominated (detector-on time) | Marked lightcurve |
|---|---|---|---|---|---|---|---|
| A | 7041 | 5100 | 249 | 249 | 3.54% | 4.88% | 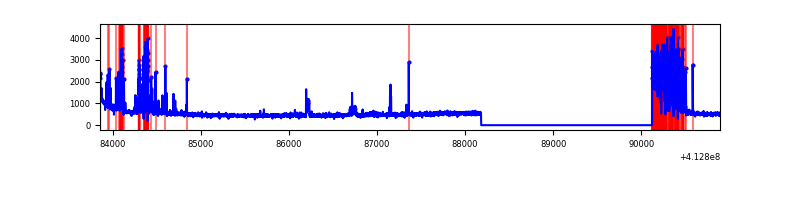 |
| B | 7041 | 5100 | 3 | 3 | 0.04% | 0.06% | 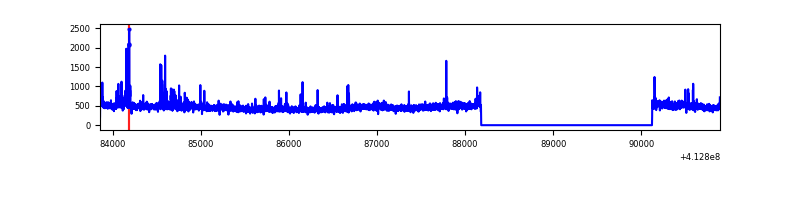 |
| C | 7041 | 5100 | 474 | 474 | 6.73% | 9.29% | 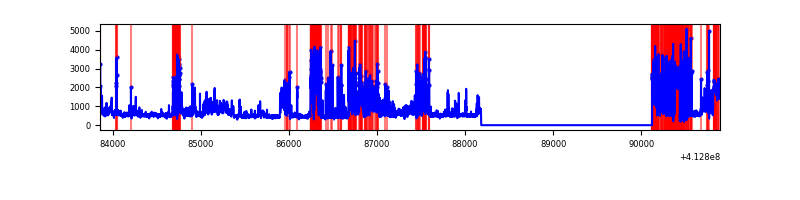 |
| D | 7041 | 5100 | 162 | 162 | 2.30% | 3.18% | 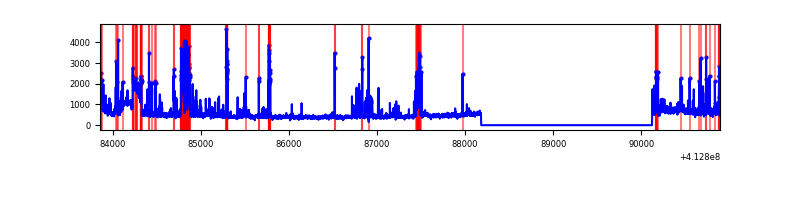 |
Top three noisy pixels from each quadrant. If the there are fewer than three noisy pixels in the level2.evt file, extra rows are filled as -1
| Pixel properties | Quadrant properties | ||||||
|---|---|---|---|---|---|---|---|
| Quadrant | DetID | PixID | Counts | Sigma | Mean | Median | Sigma |
| A | 13 | 248 | 849979 | 7679.55 | 548 | 538 | 110.6 |
| A | 10 | 83 | 397851 | 3591.99 | 548 | 538 | 110.6 |
| A | 15 | 174 | 68927 | 618.29 | 548 | 538 | 110.6 |
| B | 0 | 190 | 68152 | 620.44 | 568 | 553 | 109.0 |
| B | 0 | 230 | 38680 | 349.94 | 568 | 553 | 109.0 |
| B | 5 | 255 | 33681 | 304.05 | 568 | 553 | 109.0 |
| C | 15 | 208 | 1595612 | 12841.48 | 533 | 537 | 124.2 |
| C | 9 | 187 | 819385 | 6592.31 | 533 | 537 | 124.2 |
| C | 15 | 214 | 202024 | 1622.11 | 533 | 537 | 124.2 |
| D | 12 | 227 | 398505 | 2938.78 | 548 | 531 | 135.4 |
| D | 13 | 249 | 357456 | 2635.66 | 548 | 531 | 135.4 |
| D | 12 | 233 | 357323 | 2634.68 | 548 | 531 | 135.4 |
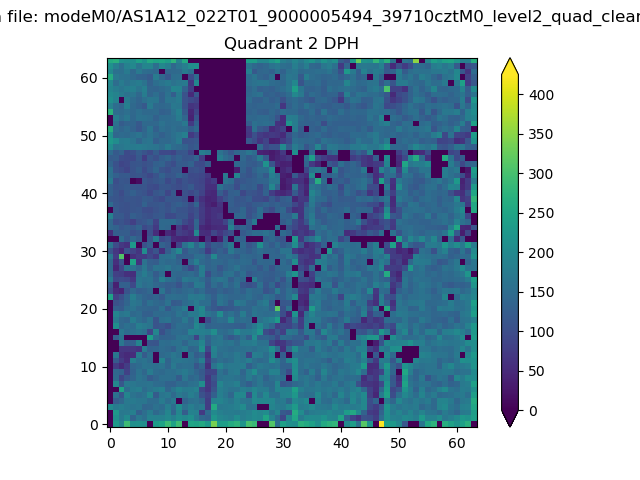
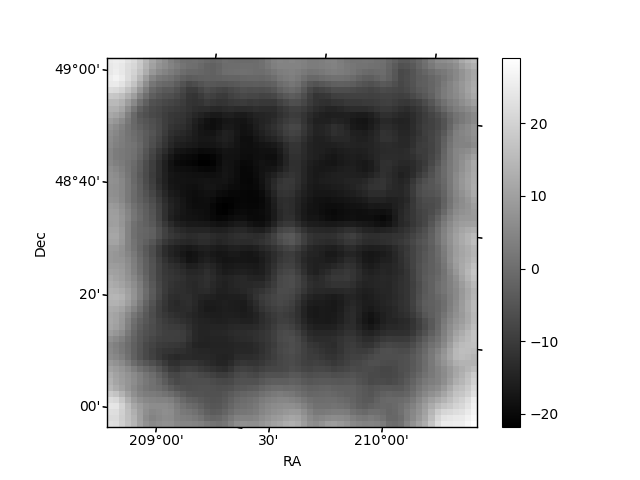
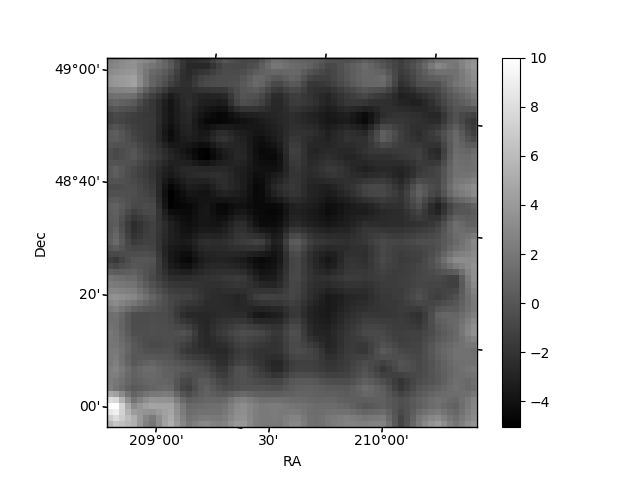
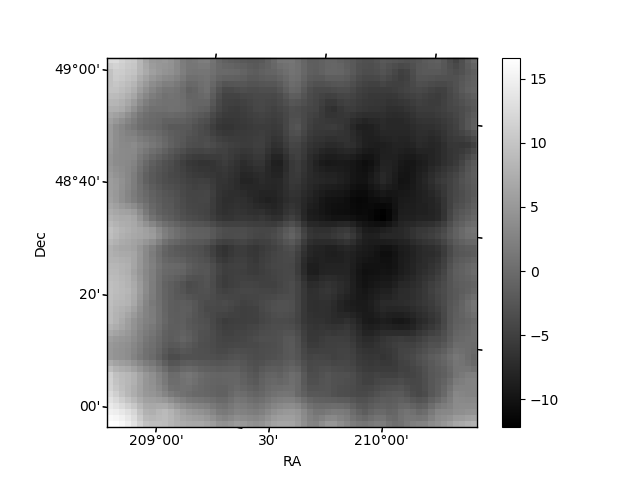
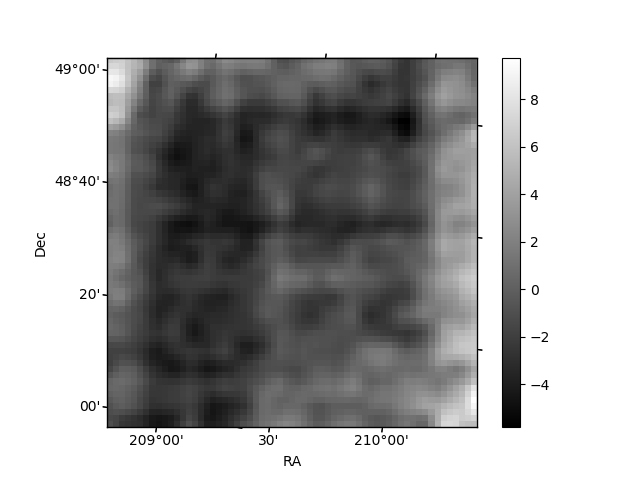
Histogram calculated using DETX and DETY for each event in the final _common_clean file
| Quadrant A | 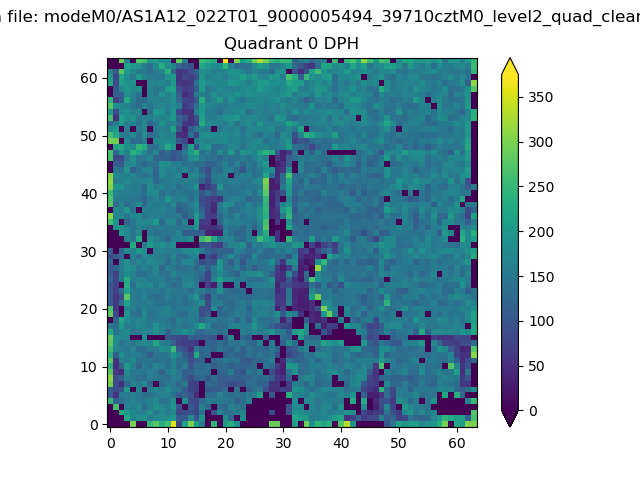 |
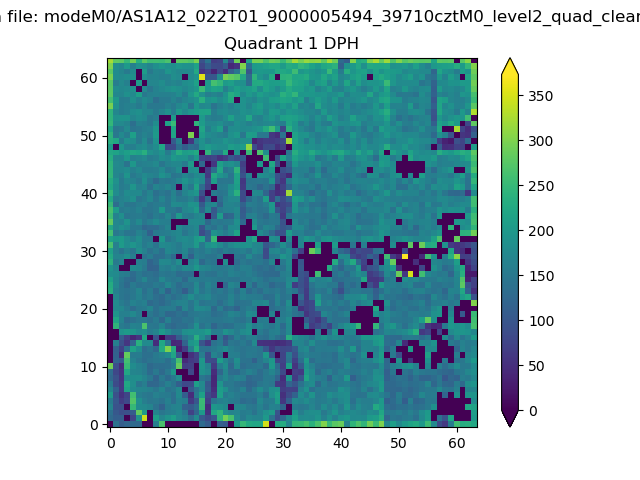 |
Quadrant B |
|---|---|---|---|
| Quadrant D | 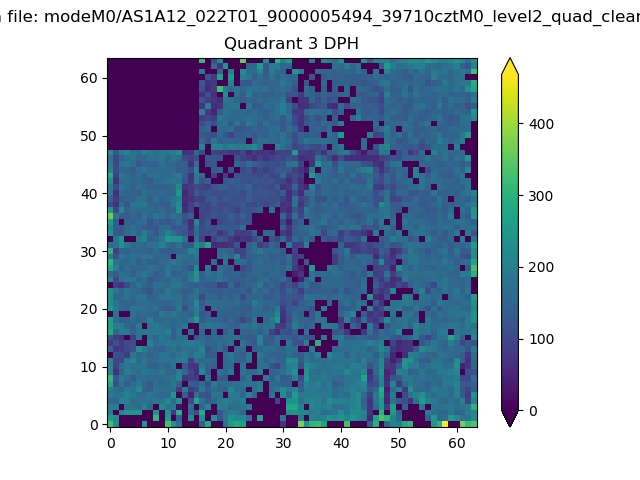 |
 |
Quadrant C |
| Plot type | Count rate plots | Images |
|---|---|---|
| Comparison with Poisson distribution Blue bars denote a histogram of data divided into 1 sec bins. Red curve is a Poisson curve with rate = median count rate of data. |
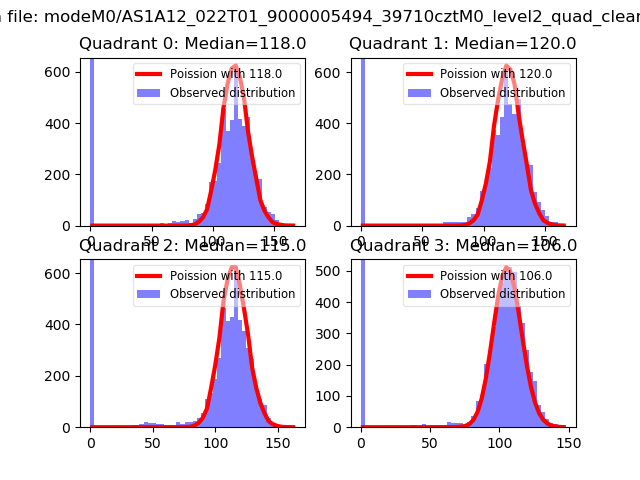 |
 |
| Quadrant-wise count rates Data is divided into 100 sec bins |
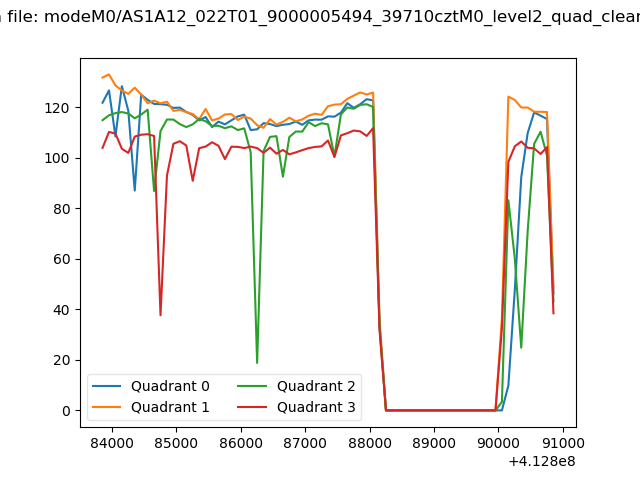 |
|
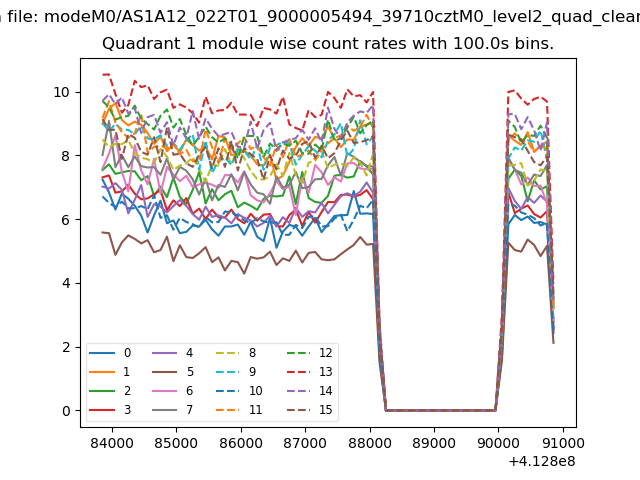
| Module-wise count rates for Quadrant A Data is divided into 100 sec bins |
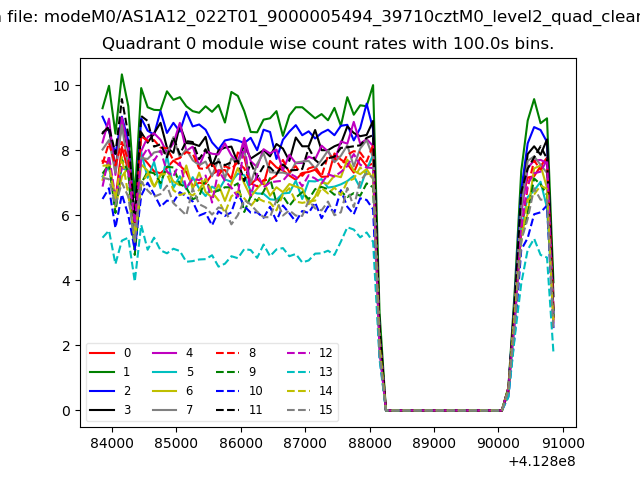 |
 |
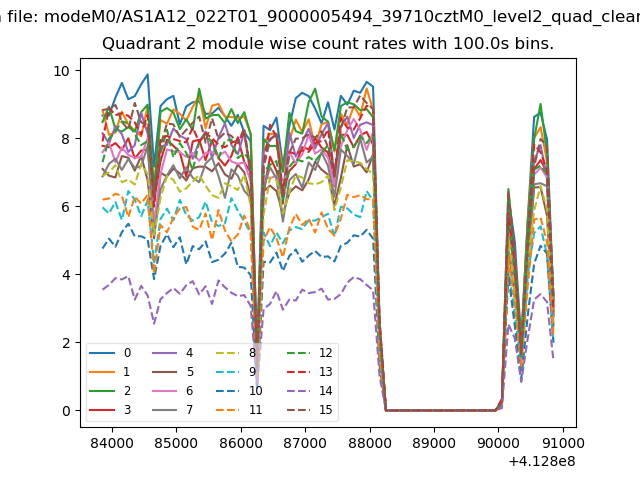
| Module-wise count rates for Quadrant B Data is divided into 100 sec bins |
 |
 |
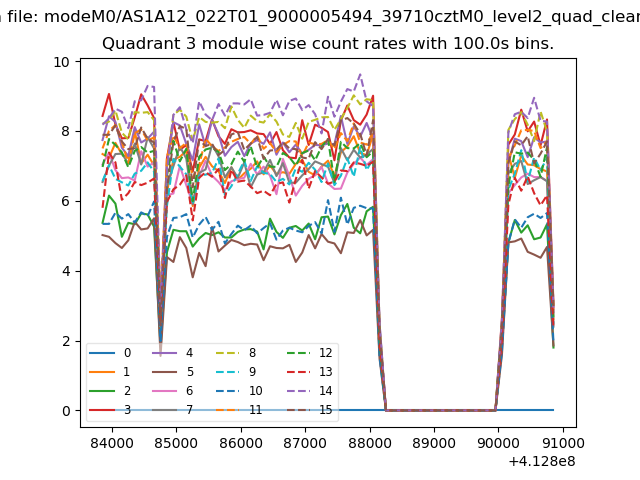
| Module-wise count rates for Quadrant C Data is divided into 100 sec bins |
 |
 |
| Module-wise count rates for Quadrant D Data is divided into 100 sec bins |
 |
 |
| Parameter | Plot |
|---|---|
| CZT HV Monitor | 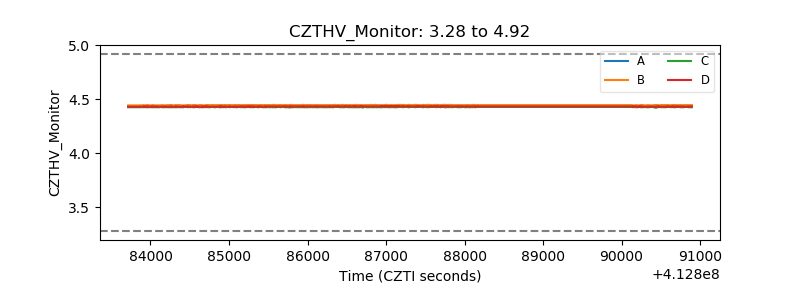 |
| D_VDD | 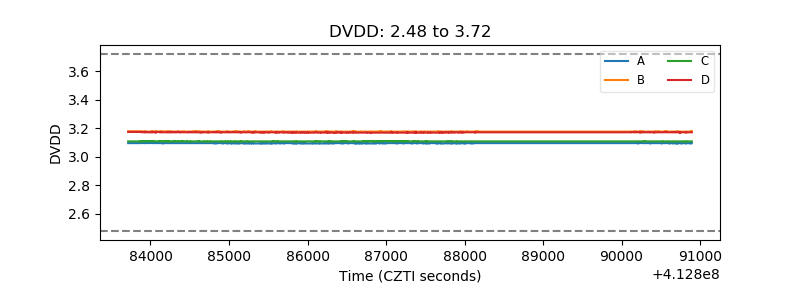 |
| Temperature 1 | 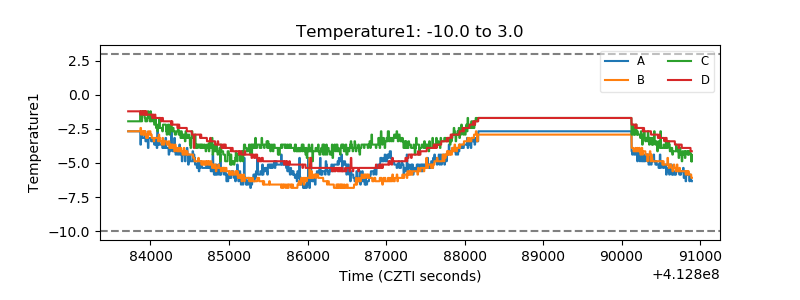 |
| Veto HV Monitor |  |
| Veto LLD | 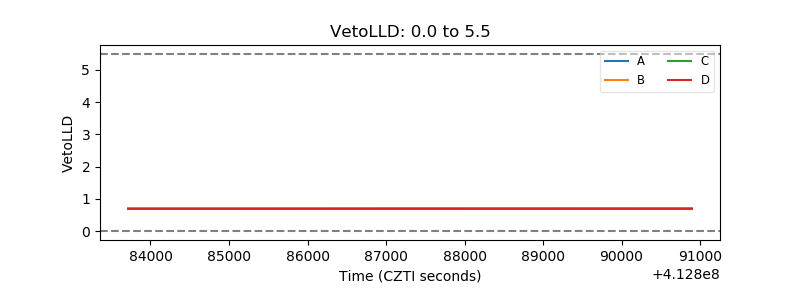 |
| Alpha Counter | 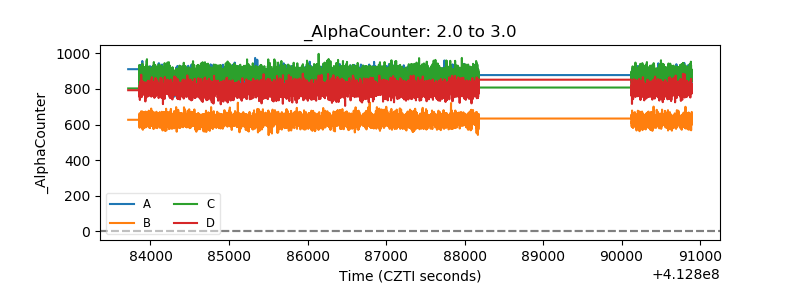 |
| _CPM_Rate | 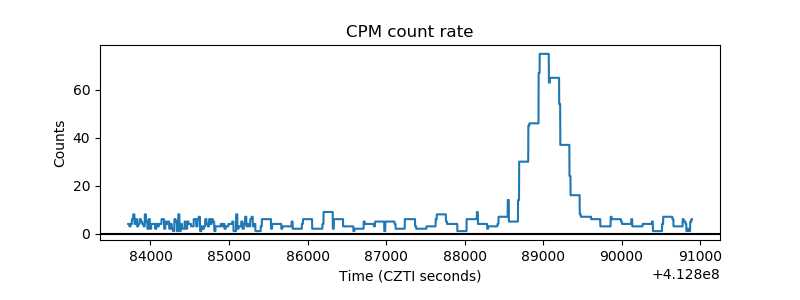 |
| CZT Counter | 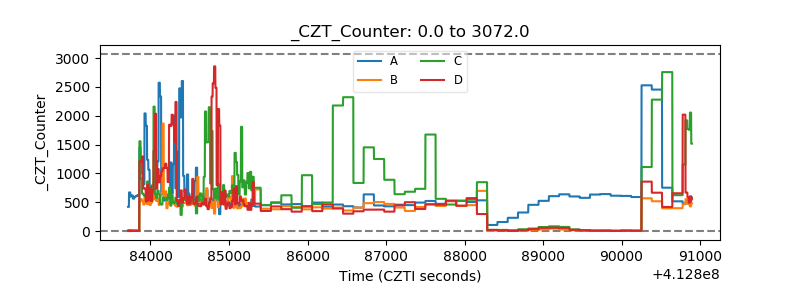 |
| +2.5 Volts monitor | 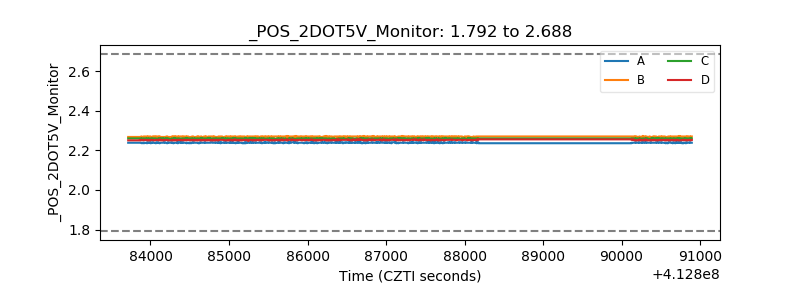 |
| +5 Volts monitor | 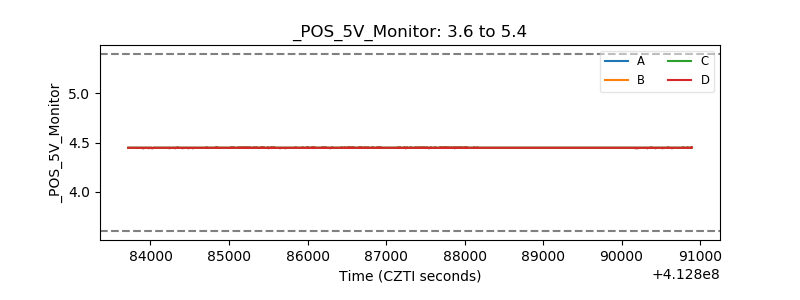 |
| _ROLL_ROT | 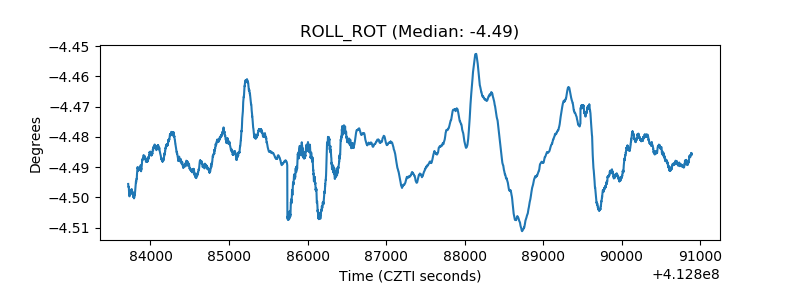 |
| _Roll_DEC | 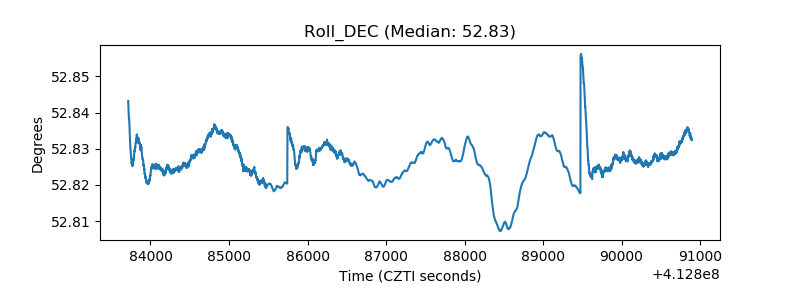 |
| _Roll_RA | 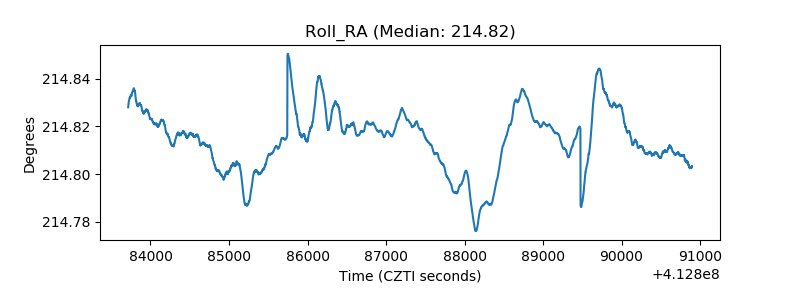 |
| Veto Counter | 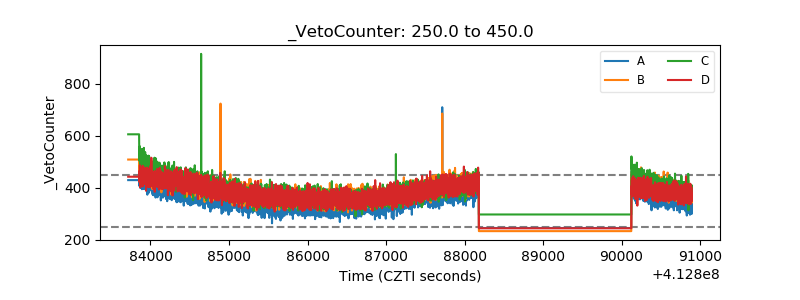 |