| Param | Original file | Final file |
|---|---|---|
| Filename | modeM0/AS1A12_022T01_9000005494_39711cztM0_level2.fits | modeM0/AS1A12_022T01_9000005494_39711cztM0_level2_quad_clean.evt |
| Size (bytes) | 443,583,360 | 90,152,640 |
| Size | 423.0 MB | 86.0 MB |
| Events in quadrant A | 3,347,688 | 600,513 |
| Events in quadrant B | 2,830,660 | 631,262 |
| Events in quadrant C | 5,689,277 | 571,074 |
| Events in quadrant D | 4,124,936 | 542,209 |
| Mode SS | |||
|---|---|---|---|
| Quadrant | BADHDUFLAG | Total packets | Discarded packets |
| A | 0 | 110 | 0 |
| B | 0 | 110 | 0 |
| C | 0 | 110 | 0 |
| D | 0 | 110 | 0 |
| Mode M0 | |||
|---|---|---|---|
| Quadrant | BADHDUFLAG | Total packets | Discarded packets |
| A | 0 | 13470 | 3 |
| B | 0 | 12221 | 2 |
| C | 0 | 20859 | 2 |
| D | 0 | 16090 | 2 |
| Mode M9 | |||
|---|---|---|---|
| Quadrant | BADHDUFLAG | Total packets | Discarded packets |
| A | 0 | 30 | 0 |
| B | 0 | 30 | 0 |
| C | 0 | 30 | 0 |
| D | 0 | 31 | 0 |
| Quadrant | Total seconds | Saturated seconds | Saturation percentage |
|---|---|---|---|
| A | 5503 | 257 | 4.670180% |
| B | 5503 | 100 | 1.817191% |
| C | 5503 | 499 | 9.067781% |
| D | 5503 | 333 | 6.051245% |
Noise dominated data is calculated using 1-second bins in cleaned event files. If a bin has >2000 counts, and if more than 50% of those come from <1% of pixels, then it is considered to be noise-dominated and hence unusable.
| Quadrant | # 1 sec bins | Bins with >0 counts | Bins with >2000 counts | High rate bins dominated by noise | Noise dominated (total time) | Noise dominated (detector-on time) | Marked lightcurve |
|---|---|---|---|---|---|---|---|
| A | 7087 | 5504 | 201 | 201 | 2.84% | 3.65% | 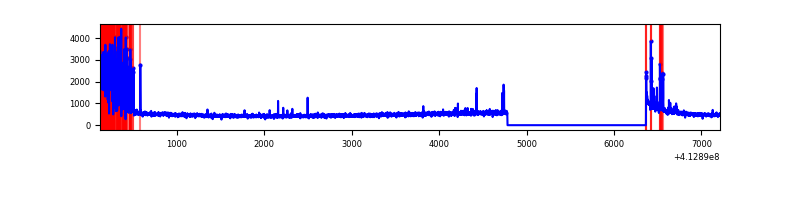 |
| B | 7086 | 5503 | 64 | 64 | 0.90% | 1.16% | 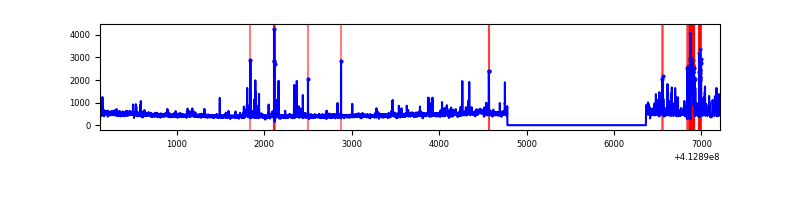 |
| C | 7087 | 5504 | 489 | 489 | 6.90% | 8.88% | 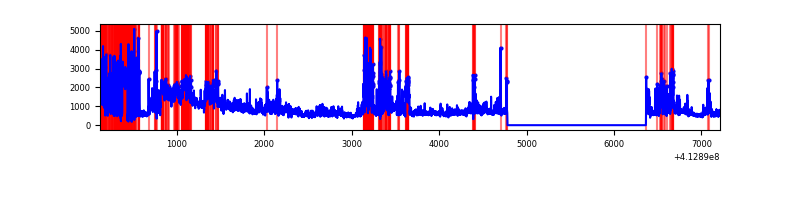 |
| D | 7087 | 5504 | 240 | 240 | 3.39% | 4.36% | 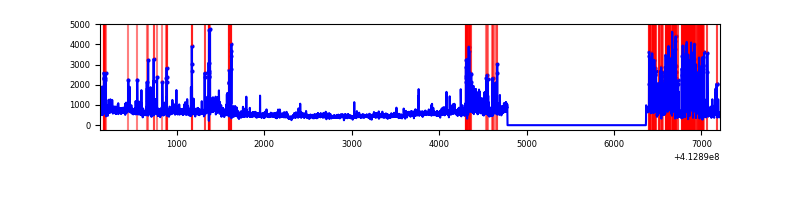 |
Top three noisy pixels from each quadrant. If the there are fewer than three noisy pixels in the level2.evt file, extra rows are filled as -1
| Pixel properties | Quadrant properties | ||||||
|---|---|---|---|---|---|---|---|
| Quadrant | DetID | PixID | Counts | Sigma | Mean | Median | Sigma |
| A | 13 | 248 | 622718 | 5195.62 | 587 | 574 | 119.7 |
| A | 10 | 83 | 409904 | 3418.38 | 587 | 574 | 119.7 |
| A | 15 | 174 | 22115 | 179.89 | 587 | 574 | 119.7 |
| B | 5 | 172 | 270613 | 2357.16 | 596 | 579 | 114.6 |
| B | 5 | 255 | 119033 | 1034.0 | 596 | 579 | 114.6 |
| B | 0 | 190 | 61541 | 532.14 | 596 | 579 | 114.6 |
| C | 9 | 187 | 1758950 | 13315.24 | 566 | 569 | 132.1 |
| C | 15 | 208 | 1476477 | 11176.23 | 566 | 569 | 132.1 |
| C | 15 | 214 | 217076 | 1639.49 | 566 | 569 | 132.1 |
| D | 12 | 227 | 919032 | 6458.28 | 573 | 556 | 142.2 |
| D | 2 | 250 | 775231 | 5447.14 | 573 | 556 | 142.2 |
| D | 13 | 249 | 68106 | 474.98 | 573 | 556 | 142.2 |
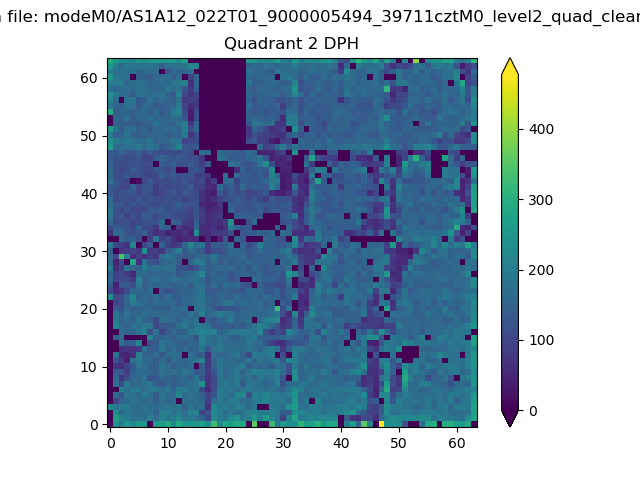
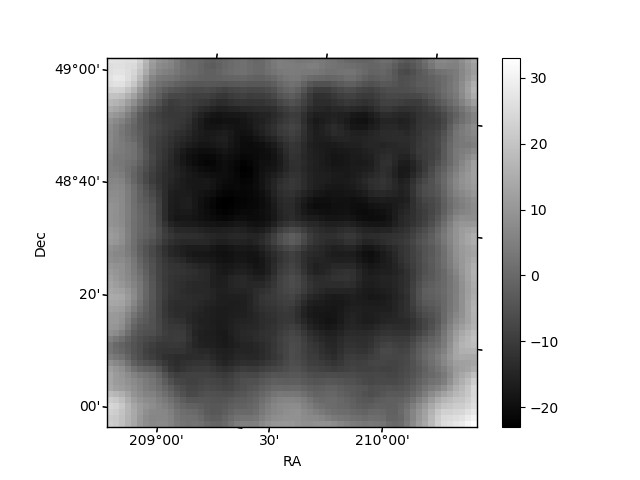
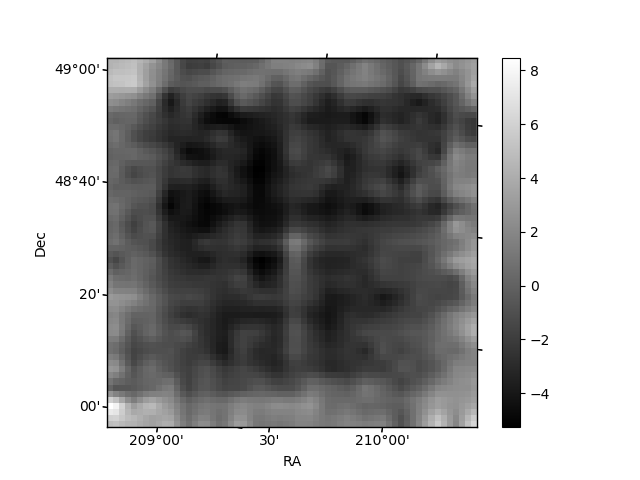
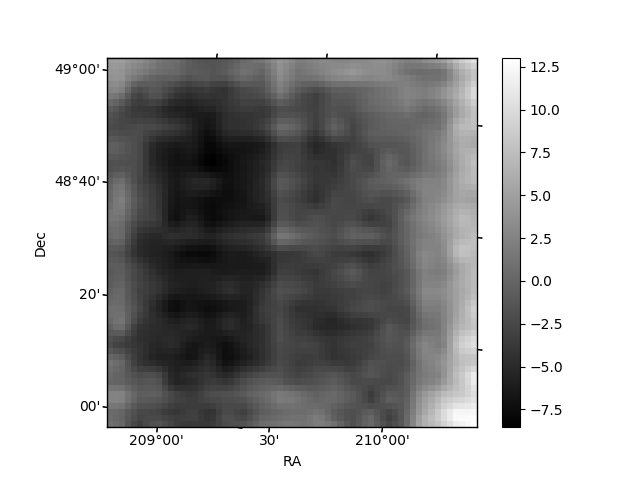
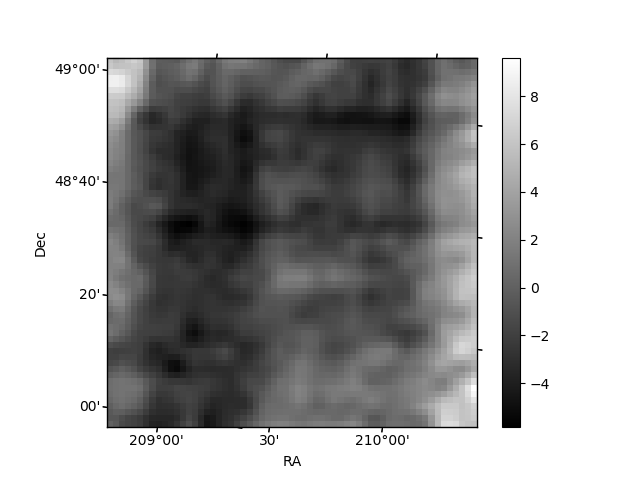
Histogram calculated using DETX and DETY for each event in the final _common_clean file
| Quadrant A | 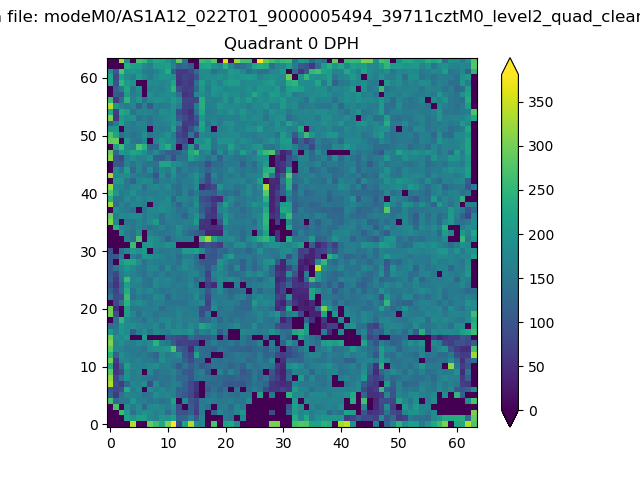 |
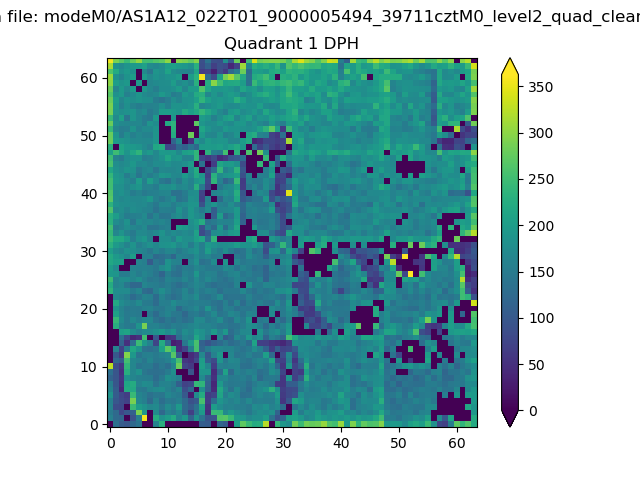 |
Quadrant B |
|---|---|---|---|
| Quadrant D | 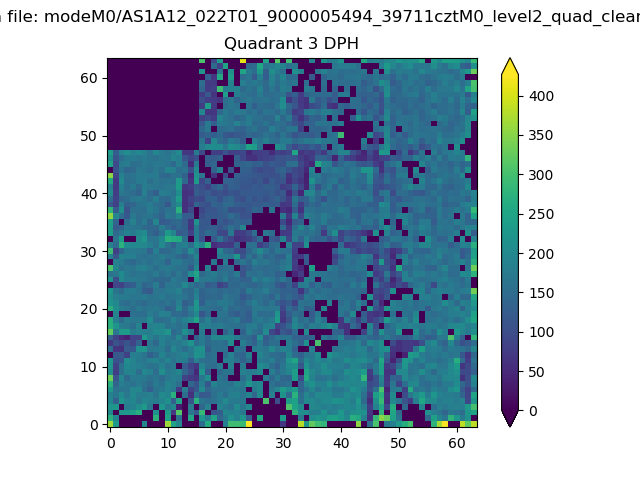 |
 |
Quadrant C |
| Plot type | Count rate plots | Images |
|---|---|---|
| Comparison with Poisson distribution Blue bars denote a histogram of data divided into 1 sec bins. Red curve is a Poisson curve with rate = median count rate of data. |
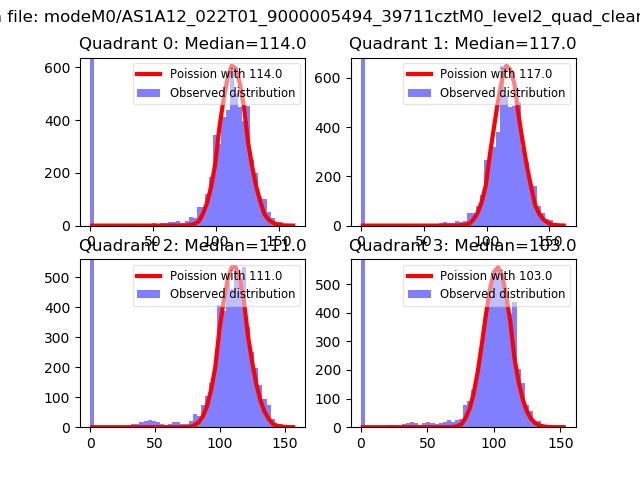 |
 |
| Quadrant-wise count rates Data is divided into 100 sec bins |
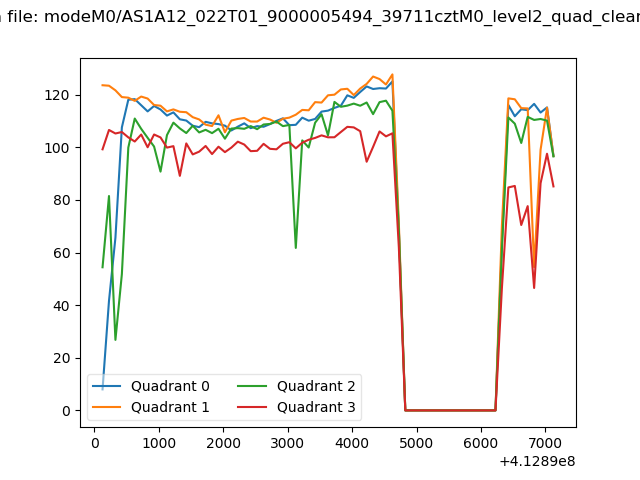 |
|
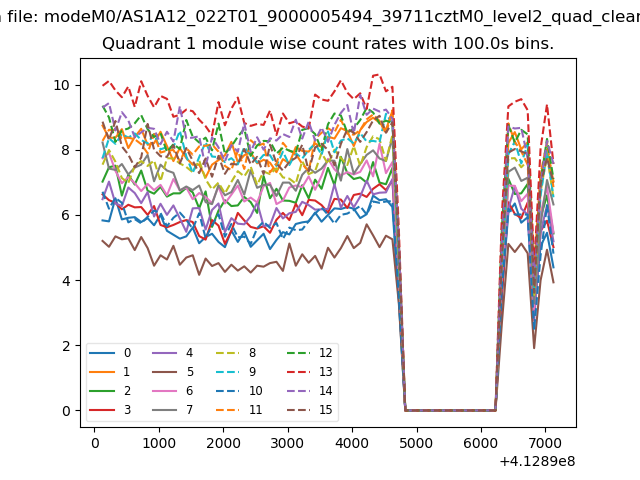
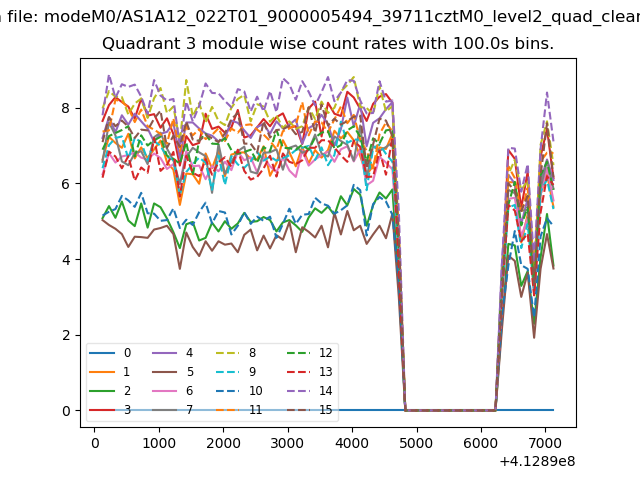
| Module-wise count rates for Quadrant A Data is divided into 100 sec bins |
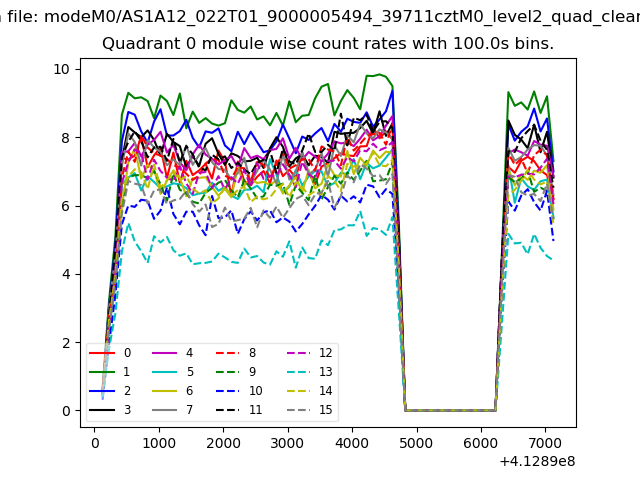 |
 |
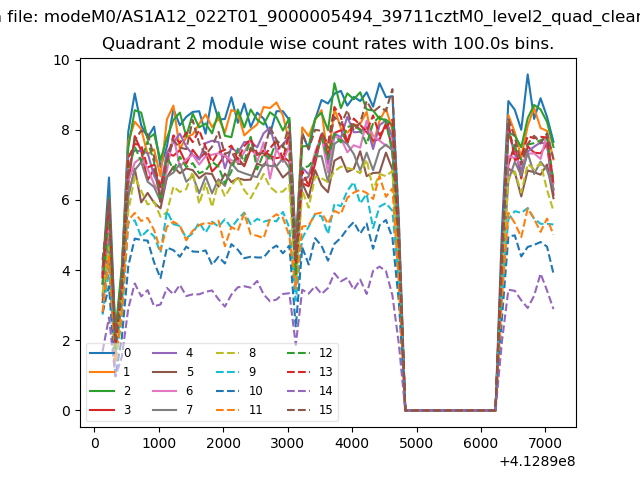
| Module-wise count rates for Quadrant B Data is divided into 100 sec bins |
 |
 |
| Module-wise count rates for Quadrant C Data is divided into 100 sec bins |
 |
 |
| Module-wise count rates for Quadrant D Data is divided into 100 sec bins |
 |
 |
| Parameter | Plot |
|---|---|
| CZT HV Monitor | 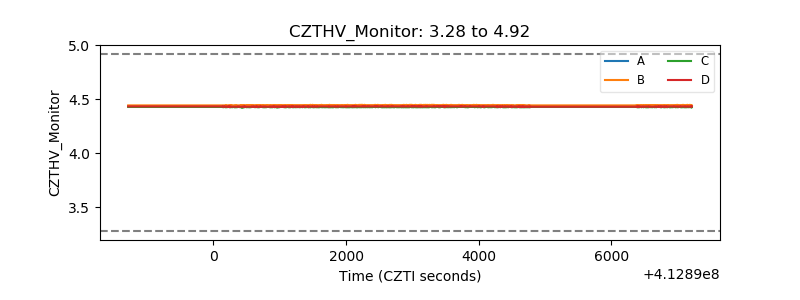 |
| D_VDD | 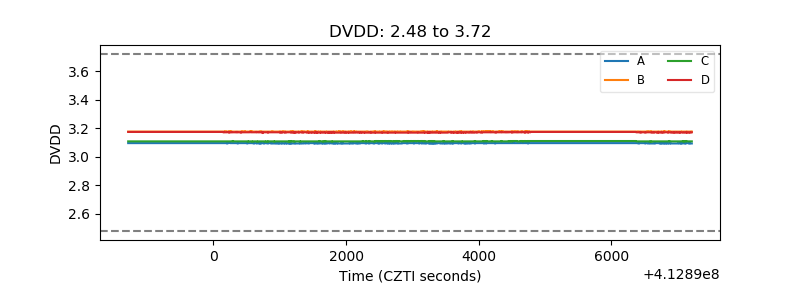 |
| Temperature 1 | 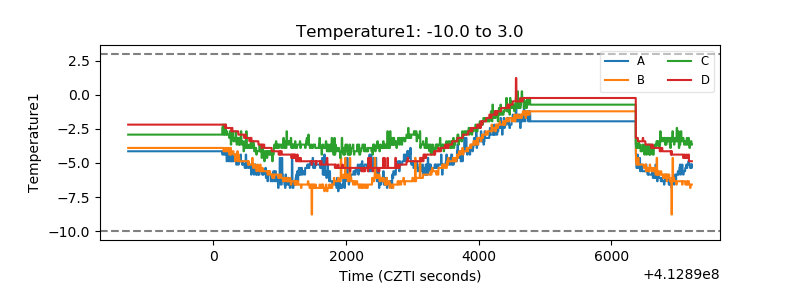 |
| Veto HV Monitor | 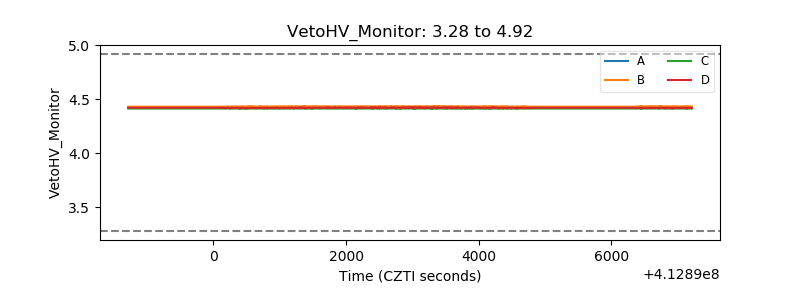 |
| Veto LLD | 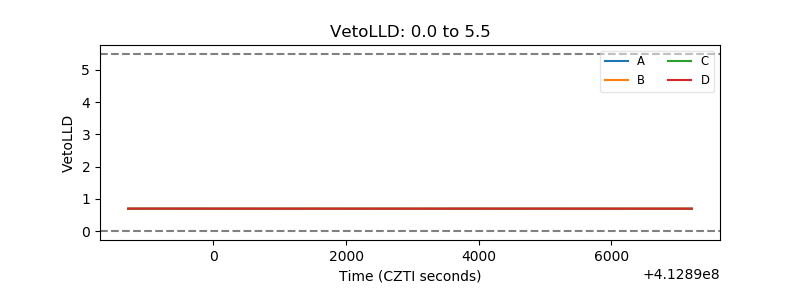 |
| Alpha Counter | 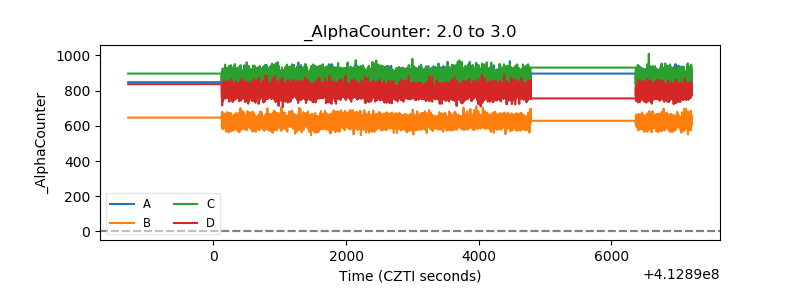 |
| _CPM_Rate | 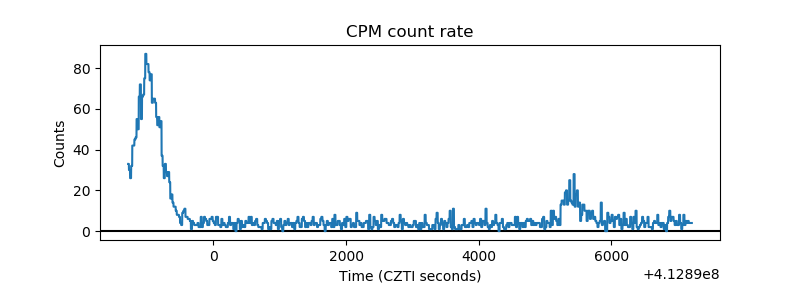 |
| CZT Counter | 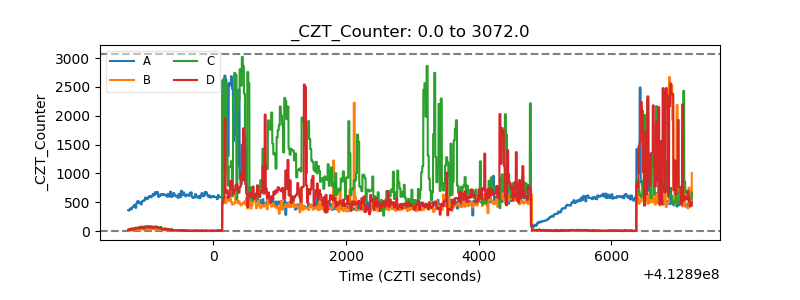 |
| +2.5 Volts monitor | 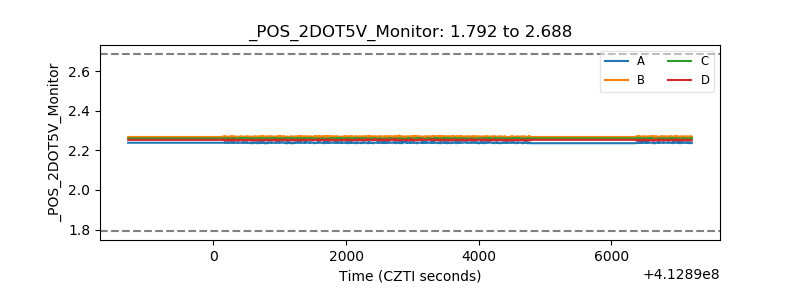 |
| +5 Volts monitor | 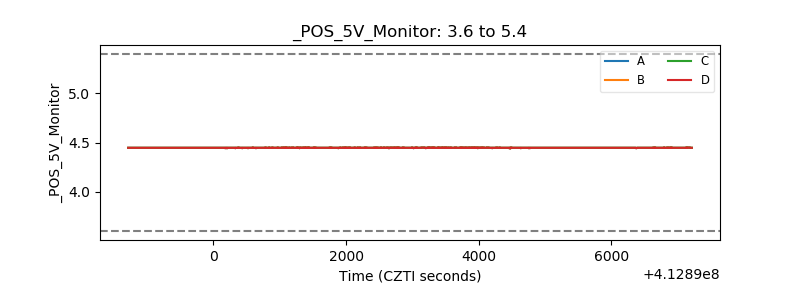 |
| _ROLL_ROT | 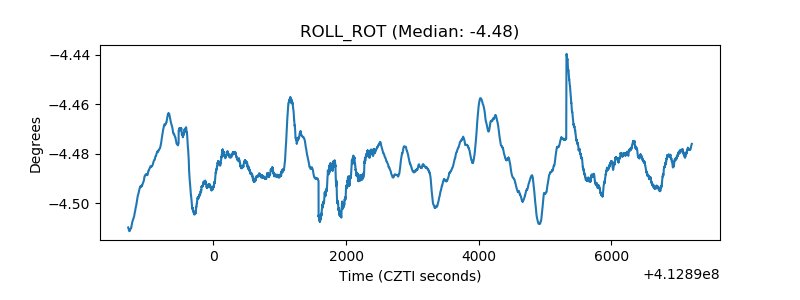 |
| _Roll_DEC | 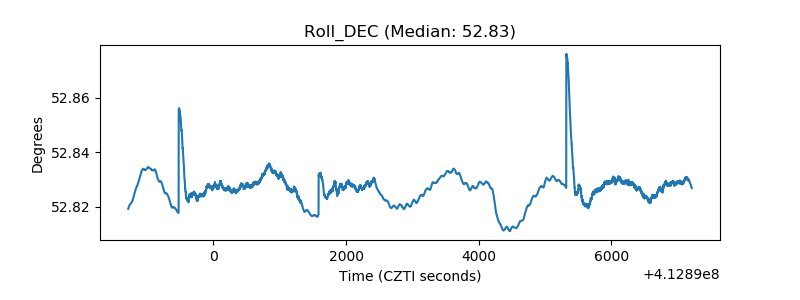 |
| _Roll_RA | 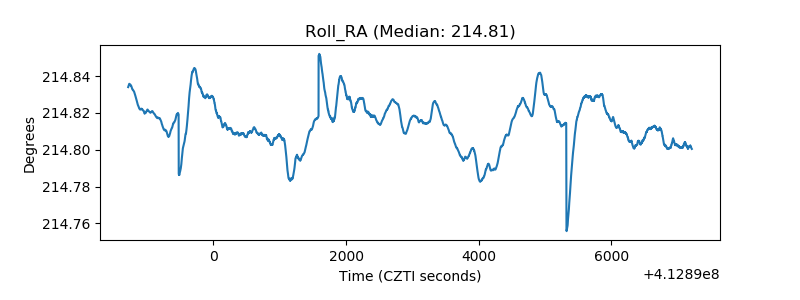 |
| Veto Counter | 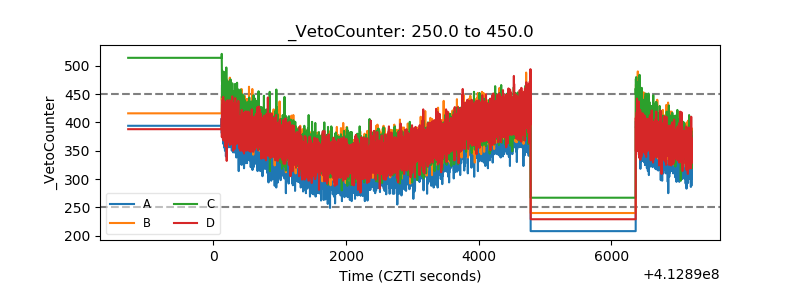 |