| Param | Original file | Final file |
|---|---|---|
| Filename | modeM0/AS1A12_022T01_9000005494_39712cztM0_level2.fits | modeM0/AS1A12_022T01_9000005494_39712cztM0_level2_quad_clean.evt |
| Size (bytes) | 445,633,920 | 94,775,040 |
| Size | 425.0 MB | 90.4 MB |
| Events in quadrant A | 3,648,016 | 638,362 |
| Events in quadrant B | 3,242,022 | 652,963 |
| Events in quadrant C | 4,667,351 | 613,620 |
| Events in quadrant D | 4,487,766 | 559,297 |
| Mode SS | |||
|---|---|---|---|
| Quadrant | BADHDUFLAG | Total packets | Discarded packets |
| A | 0 | 116 | 0 |
| B | 0 | 116 | 0 |
| C | 0 | 116 | 0 |
| D | 0 | 116 | 0 |
| Mode M0 | |||
|---|---|---|---|
| Quadrant | BADHDUFLAG | Total packets | Discarded packets |
| A | 0 | 14544 | 3 |
| B | 0 | 13655 | 2 |
| C | 0 | 17841 | 2 |
| D | 0 | 17370 | 2 |
| Mode M9 | |||
|---|---|---|---|
| Quadrant | BADHDUFLAG | Total packets | Discarded packets |
| A | 0 | 22 | 0 |
| B | 0 | 22 | 0 |
| C | 0 | 22 | 0 |
| D | 0 | 23 | 0 |
| Quadrant | Total seconds | Saturated seconds | Saturation percentage |
|---|---|---|---|
| A | 5805 | 120 | 2.067183% |
| B | 5805 | 137 | 2.360034% |
| C | 5805 | 262 | 4.513351% |
| D | 5805 | 405 | 6.976744% |
Noise dominated data is calculated using 1-second bins in cleaned event files. If a bin has >2000 counts, and if more than 50% of those come from <1% of pixels, then it is considered to be noise-dominated and hence unusable.
| Quadrant | # 1 sec bins | Bins with >0 counts | Bins with >2000 counts | High rate bins dominated by noise | Noise dominated (total time) | Noise dominated (detector-on time) | Marked lightcurve |
|---|---|---|---|---|---|---|---|
| A | 7147 | 5806 | 98 | 98 | 1.37% | 1.69% | 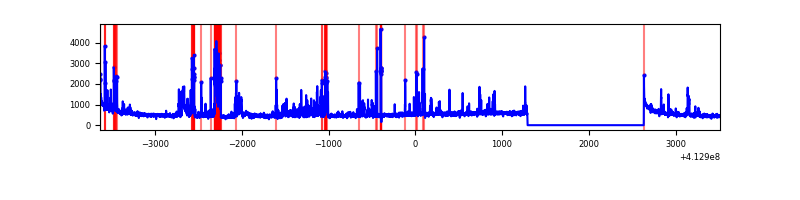 |
| B | 7147 | 5806 | 80 | 80 | 1.12% | 1.38% | 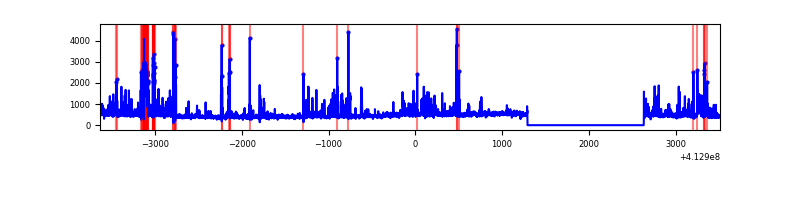 |
| C | 7147 | 5806 | 216 | 216 | 3.02% | 3.72% | 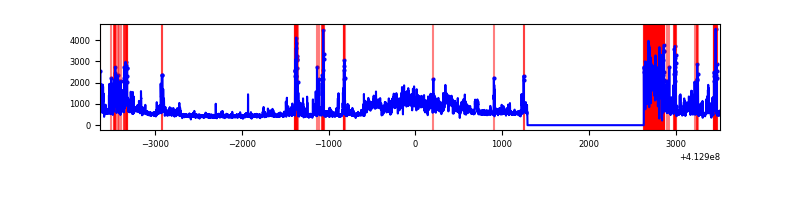 |
| D | 7147 | 5806 | 311 | 311 | 4.35% | 5.36% | 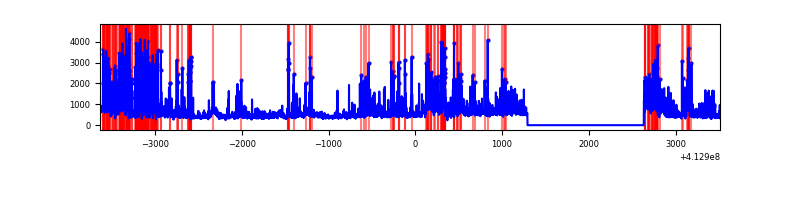 |
Top three noisy pixels from each quadrant. If the there are fewer than three noisy pixels in the level2.evt file, extra rows are filled as -1
| Pixel properties | Quadrant properties | ||||||
|---|---|---|---|---|---|---|---|
| Quadrant | DetID | PixID | Counts | Sigma | Mean | Median | Sigma |
| A | 15 | 174 | 674149 | 5287.51 | 630 | 618 | 127.4 |
| A | 10 | 83 | 459697 | 3603.97 | 630 | 618 | 127.4 |
| A | 13 | 248 | 52588 | 407.99 | 630 | 618 | 127.4 |
| B | 5 | 172 | 617722 | 5044.66 | 627 | 609 | 122.3 |
| B | 5 | 255 | 49176 | 397.02 | 627 | 609 | 122.3 |
| B | 0 | 190 | 47490 | 383.23 | 627 | 609 | 122.3 |
| C | 9 | 187 | 1094451 | 7718.56 | 609 | 612 | 141.7 |
| C | 15 | 208 | 932494 | 6575.72 | 609 | 612 | 141.7 |
| C | 15 | 214 | 237653 | 1672.65 | 609 | 612 | 141.7 |
| D | 2 | 250 | 1167553 | 7901.31 | 601 | 583 | 147.7 |
| D | 12 | 227 | 827171 | 5596.65 | 601 | 583 | 147.7 |
| D | 2 | 249 | 73442 | 493.31 | 601 | 583 | 147.7 |
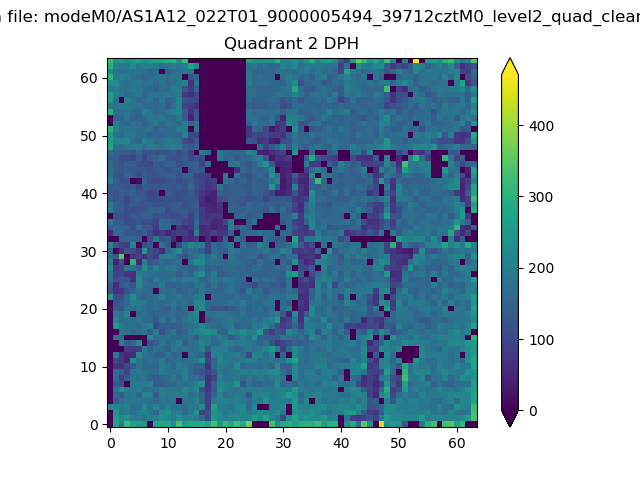
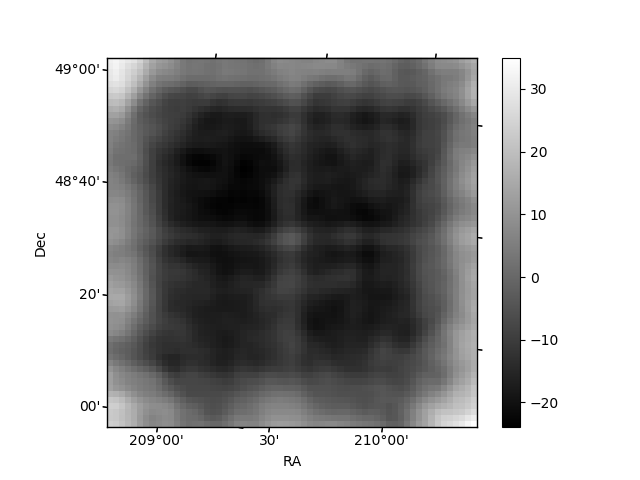
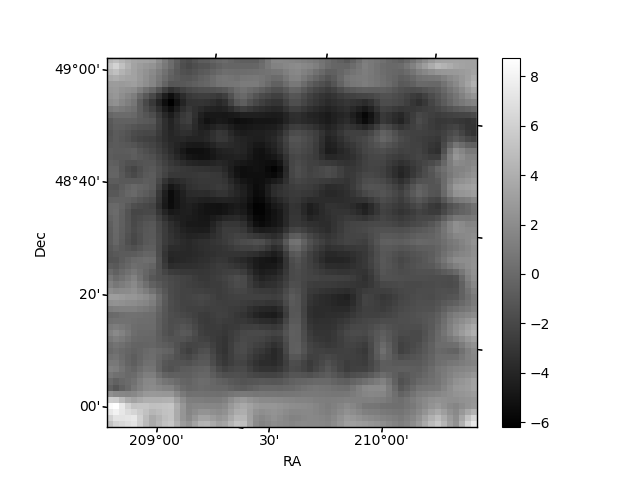
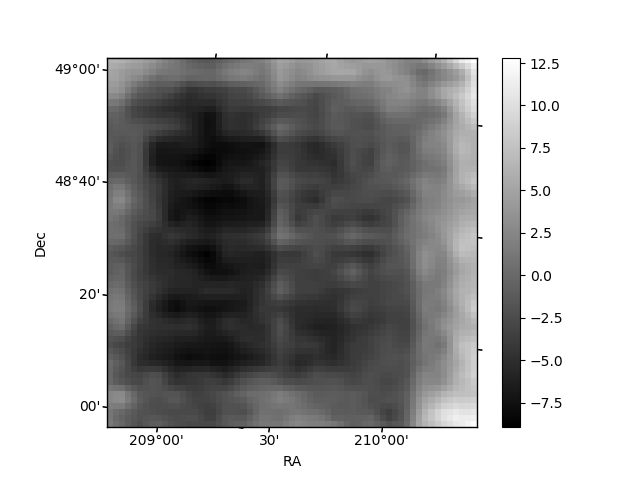
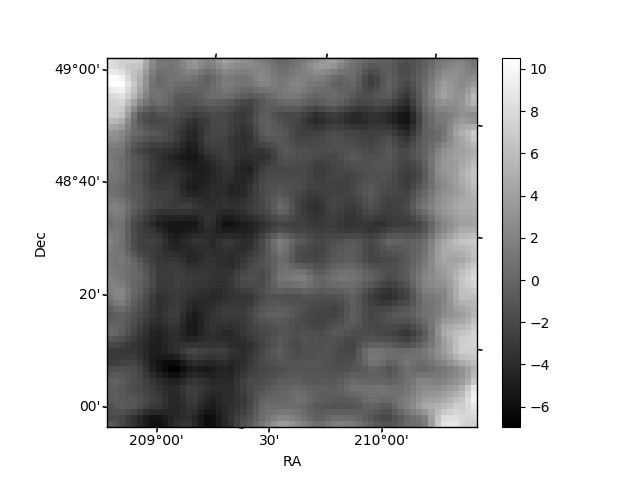
Histogram calculated using DETX and DETY for each event in the final _common_clean file
| Quadrant A | 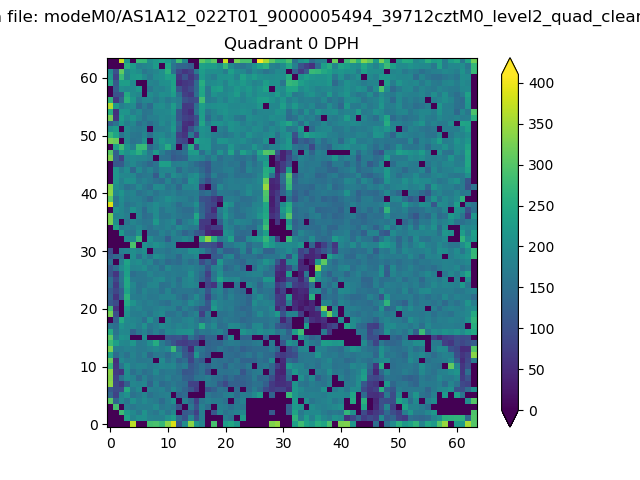 |
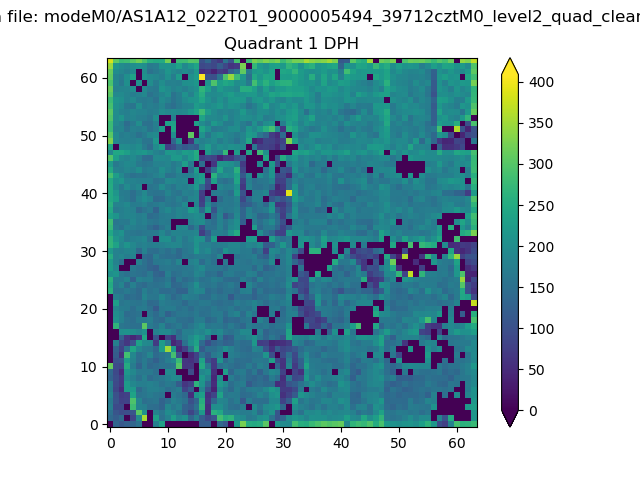 |
Quadrant B |
|---|---|---|---|
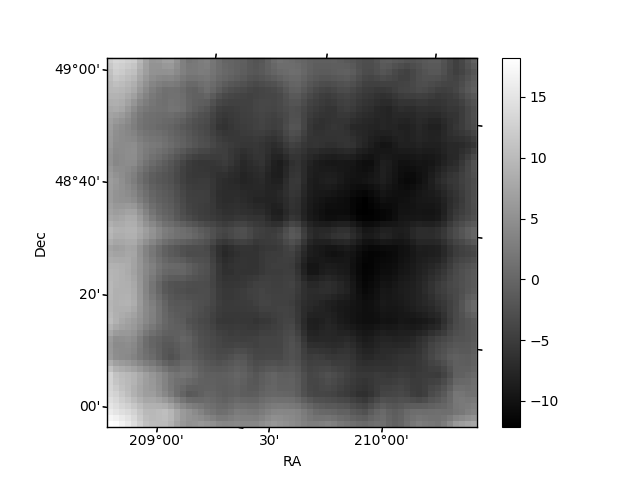
| Quadrant D | 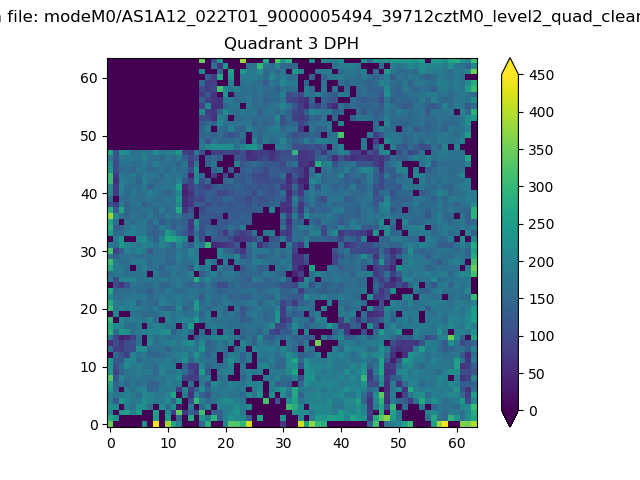 |
 |
Quadrant C |
| Plot type | Count rate plots | Images |
|---|---|---|
| Comparison with Poisson distribution Blue bars denote a histogram of data divided into 1 sec bins. Red curve is a Poisson curve with rate = median count rate of data. |
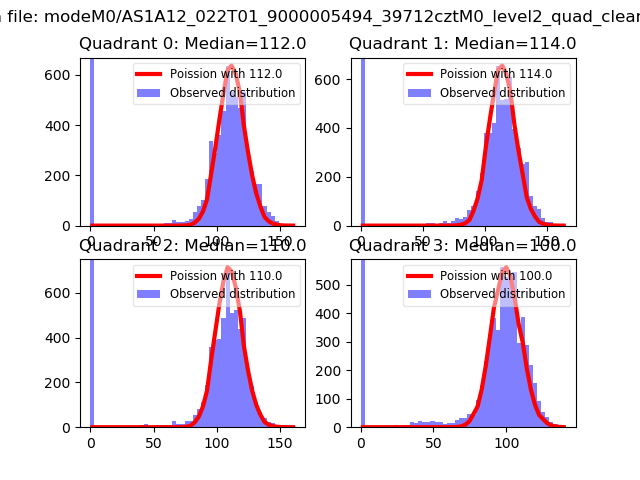 |
 |
| Quadrant-wise count rates Data is divided into 100 sec bins |
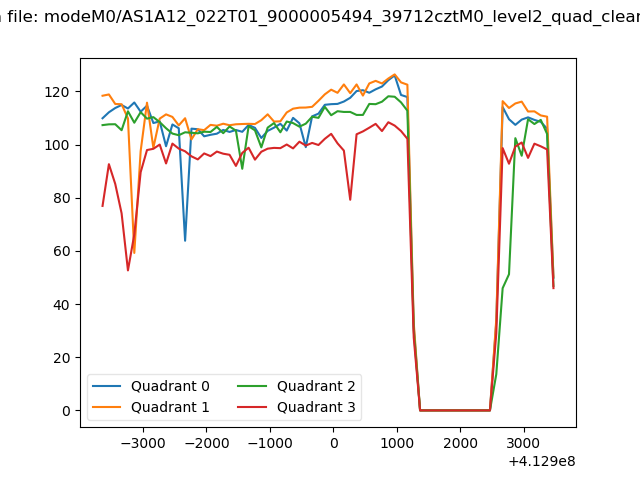 |
|
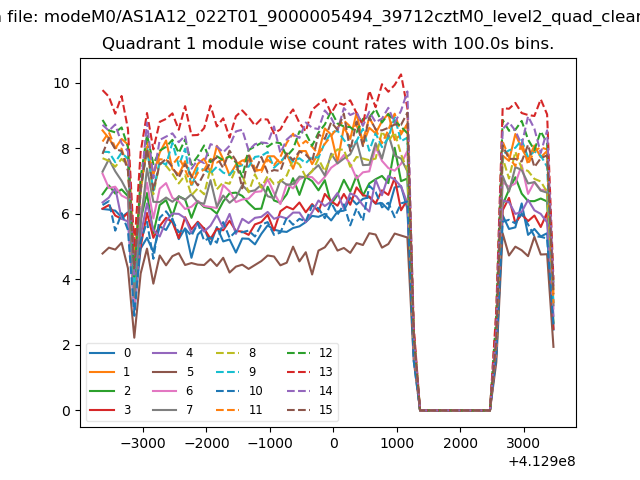
| Module-wise count rates for Quadrant A Data is divided into 100 sec bins |
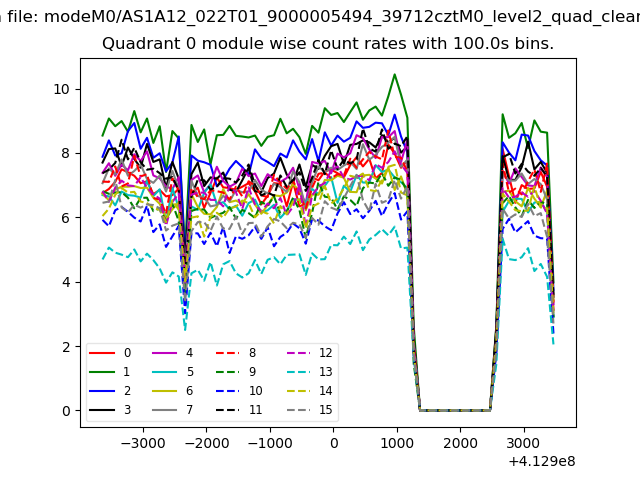 |
 |
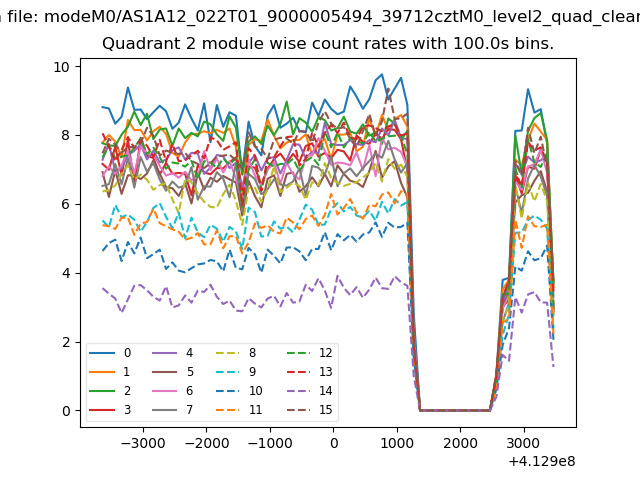
| Module-wise count rates for Quadrant B Data is divided into 100 sec bins |
 |
 |
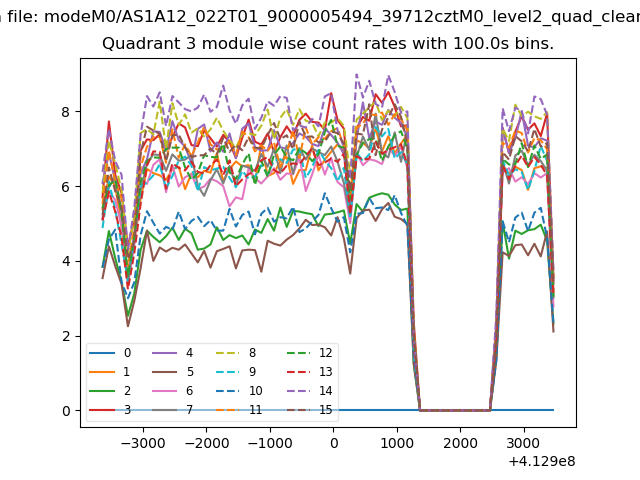
| Module-wise count rates for Quadrant C Data is divided into 100 sec bins |
 |
 |
| Module-wise count rates for Quadrant D Data is divided into 100 sec bins |
 |
 |
| Parameter | Plot |
|---|---|
| CZT HV Monitor | 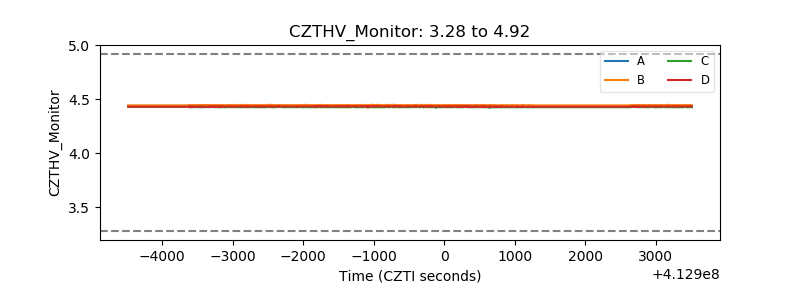 |
| D_VDD | 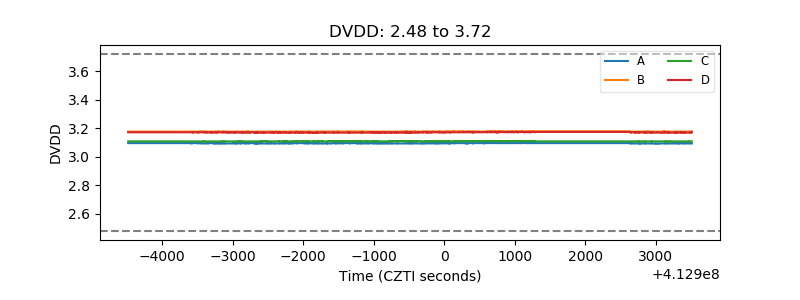 |
| Temperature 1 | 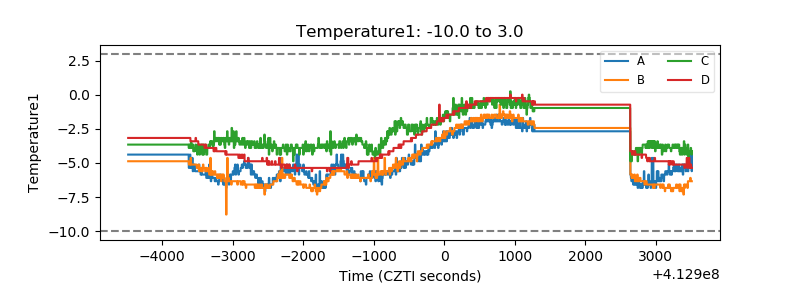 |
| Veto HV Monitor | 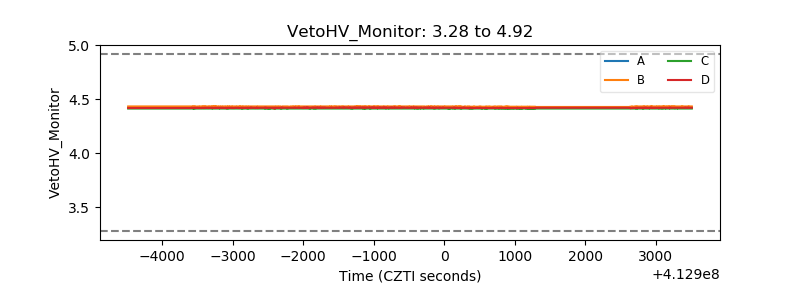 |
| Veto LLD | 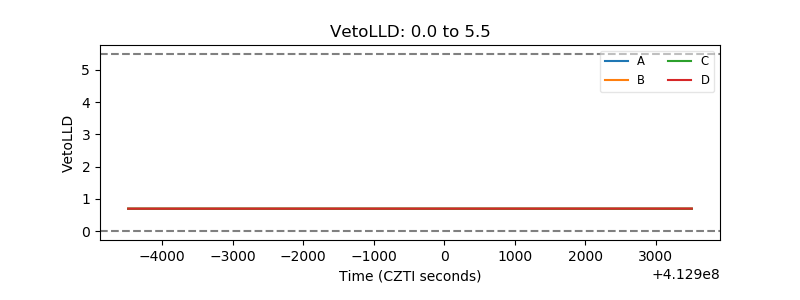 |
| Alpha Counter | 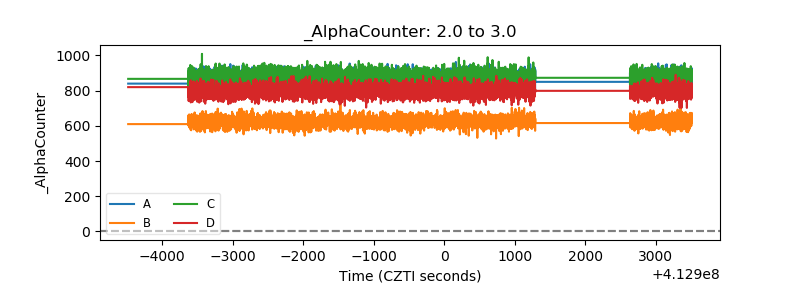 |
| _CPM_Rate | 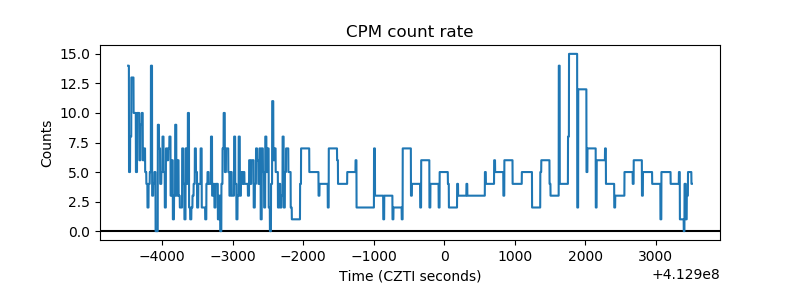 |
| CZT Counter | 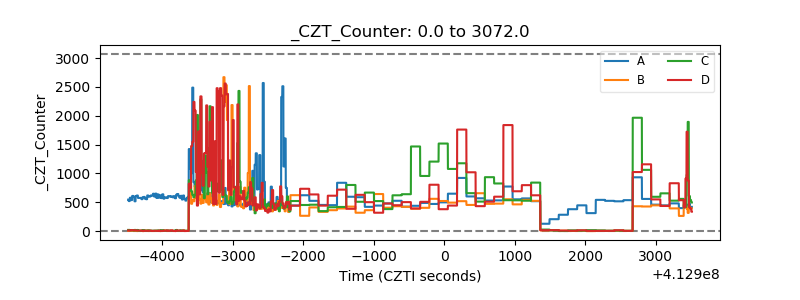 |
| +2.5 Volts monitor | 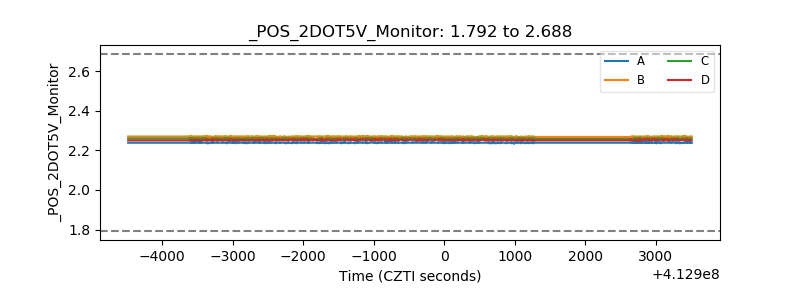 |
| +5 Volts monitor | 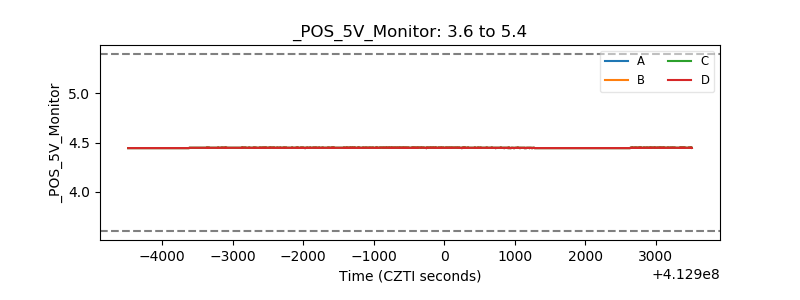 |
| _ROLL_ROT | 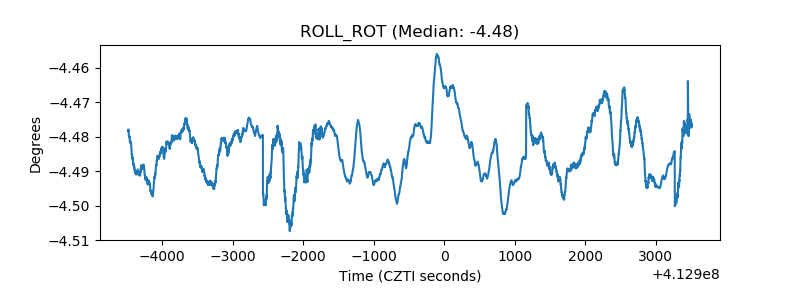 |
| _Roll_DEC | 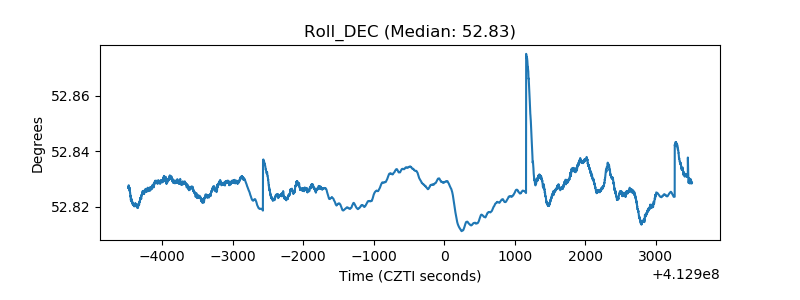 |
| _Roll_RA | 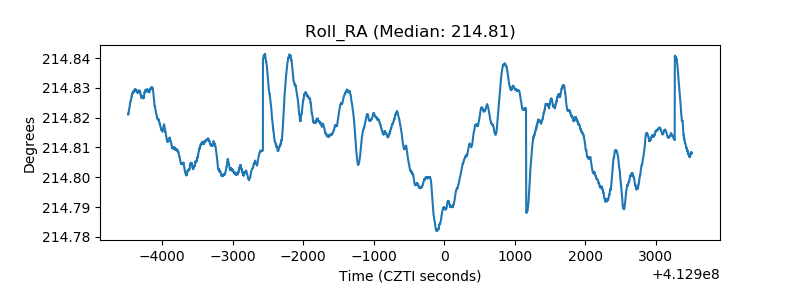 |
| Veto Counter | 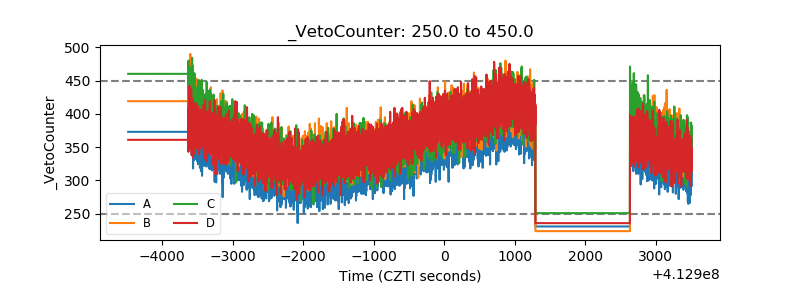 |