| Param | Original file | Final file |
|---|---|---|
| Filename | modeM0/AS1A12_022T01_9000005494_39713cztM0_level2.fits | modeM0/AS1A12_022T01_9000005494_39713cztM0_level2_quad_clean.evt |
| Size (bytes) | 425,557,440 | 97,450,560 |
| Size | 405.8 MB | 92.9 MB |
| Events in quadrant A | 3,256,043 | 658,690 |
| Events in quadrant B | 3,079,491 | 678,636 |
| Events in quadrant C | 5,143,725 | 608,769 |
| Events in quadrant D | 3,806,839 | 584,813 |
| Mode SS | |||
|---|---|---|---|
| Quadrant | BADHDUFLAG | Total packets | Discarded packets |
| A | 0 | 124 | 0 |
| B | 0 | 124 | 0 |
| C | 0 | 124 | 0 |
| D | 0 | 124 | 0 |
| Mode M0 | |||
|---|---|---|---|
| Quadrant | BADHDUFLAG | Total packets | Discarded packets |
| A | 0 | 13517 | 3 |
| B | 0 | 13276 | 2 |
| C | 0 | 19235 | 2 |
| D | 0 | 15747 | 2 |
| Mode M9 | |||
|---|---|---|---|
| Quadrant | BADHDUFLAG | Total packets | Discarded packets |
| A | 0 | 20 | 0 |
| B | 0 | 20 | 0 |
| C | 0 | 20 | 0 |
| D | 0 | 21 | 0 |
| Quadrant | Total seconds | Saturated seconds | Saturation percentage |
|---|---|---|---|
| A | 6001 | 62 | 1.033161% |
| B | 6001 | 57 | 0.949842% |
| C | 6001 | 500 | 8.331945% |
| D | 6001 | 234 | 3.899350% |
Noise dominated data is calculated using 1-second bins in cleaned event files. If a bin has >2000 counts, and if more than 50% of those come from <1% of pixels, then it is considered to be noise-dominated and hence unusable.
| Quadrant | # 1 sec bins | Bins with >0 counts | Bins with >2000 counts | High rate bins dominated by noise | Noise dominated (total time) | Noise dominated (detector-on time) | Marked lightcurve |
|---|---|---|---|---|---|---|---|
| A | 7282 | 6002 | 35 | 35 | 0.48% | 0.58% | 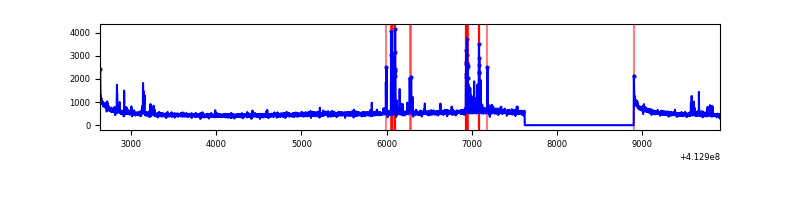 |
| B | 7282 | 6002 | 32 | 32 | 0.44% | 0.53% | 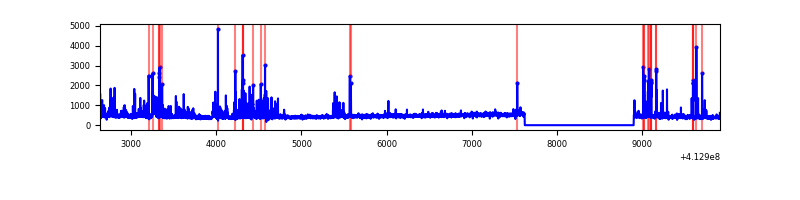 |
| C | 7282 | 6002 | 449 | 449 | 6.17% | 7.48% | 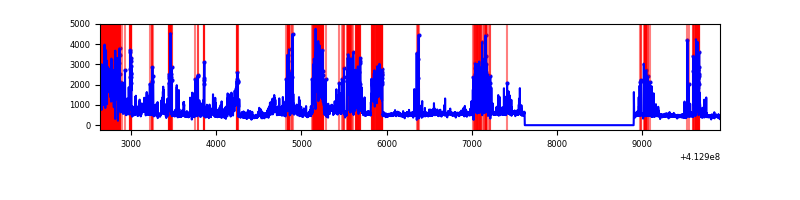 |
| D | 7282 | 6002 | 201 | 201 | 2.76% | 3.35% | 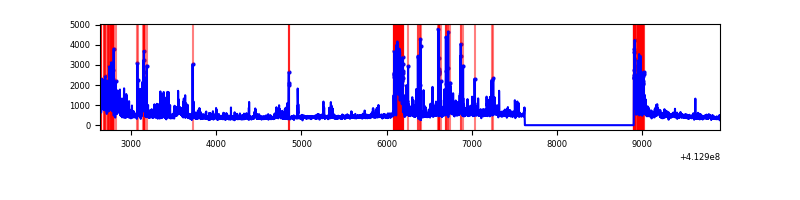 |
Top three noisy pixels from each quadrant. If the there are fewer than three noisy pixels in the level2.evt file, extra rows are filled as -1
| Pixel properties | Quadrant properties | ||||||
|---|---|---|---|---|---|---|---|
| Quadrant | DetID | PixID | Counts | Sigma | Mean | Median | Sigma |
| A | 10 | 83 | 482607 | 3648.87 | 651 | 637 | 132.1 |
| A | 15 | 174 | 152645 | 1150.81 | 651 | 637 | 132.1 |
| A | 13 | 248 | 91972 | 691.47 | 651 | 637 | 132.1 |
| B | 5 | 172 | 420043 | 3299.95 | 650 | 631 | 127.1 |
| B | 5 | 255 | 34004 | 262.58 | 650 | 631 | 127.1 |
| B | 10 | 246 | 33797 | 260.95 | 650 | 631 | 127.1 |
| C | 9 | 187 | 1732909 | 12029.17 | 619 | 622 | 144.0 |
| C | 15 | 208 | 735304 | 5101.7 | 619 | 622 | 144.0 |
| C | 15 | 214 | 242765 | 1681.46 | 619 | 622 | 144.0 |
| D | 2 | 250 | 712985 | 4638.99 | 623 | 604 | 153.6 |
| D | 12 | 227 | 572474 | 3723.99 | 623 | 604 | 153.6 |
| D | 13 | 249 | 61356 | 395.61 | 623 | 604 | 153.6 |
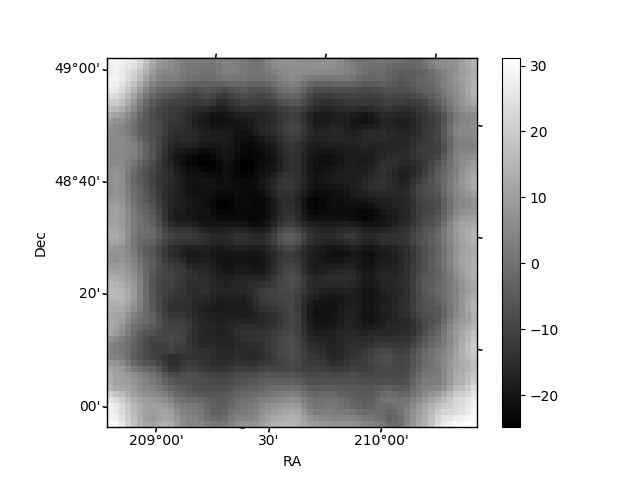
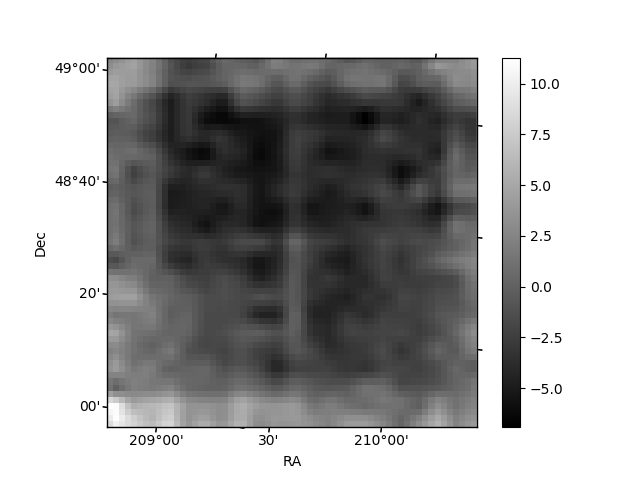
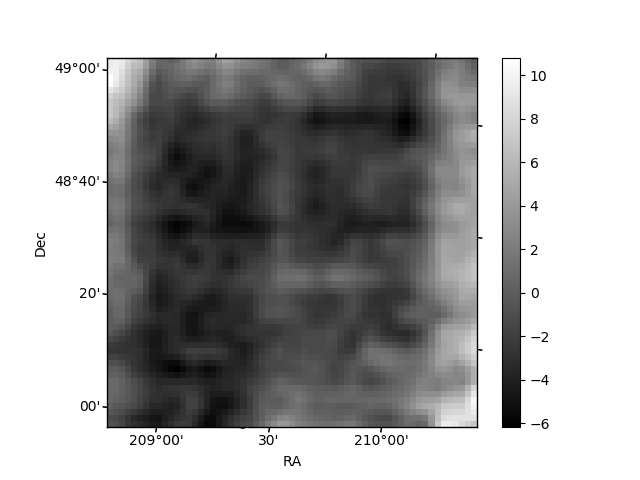
Histogram calculated using DETX and DETY for each event in the final _common_clean file
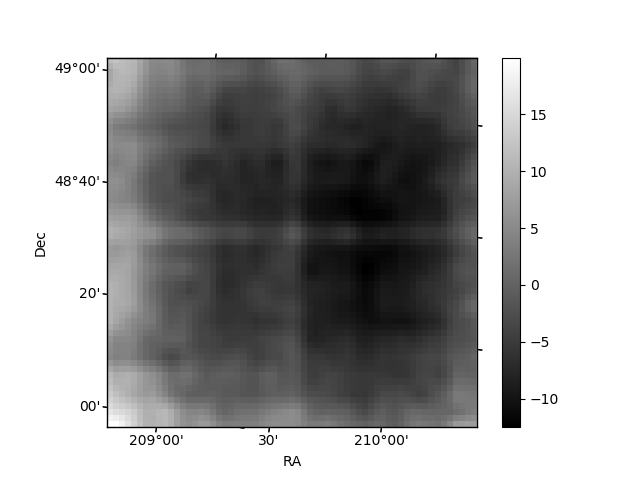
| Quadrant A | 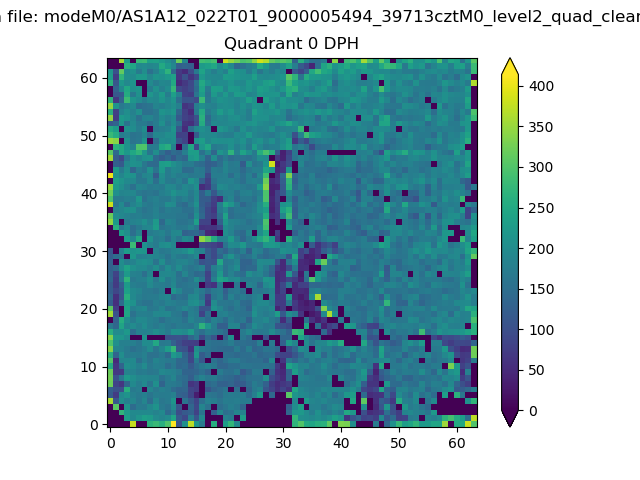 |
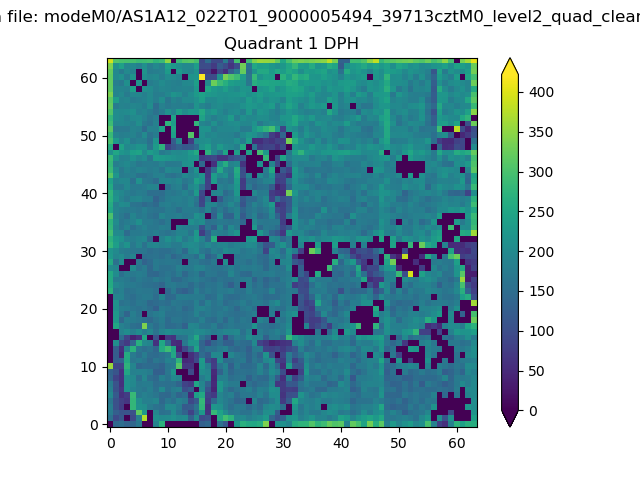 |
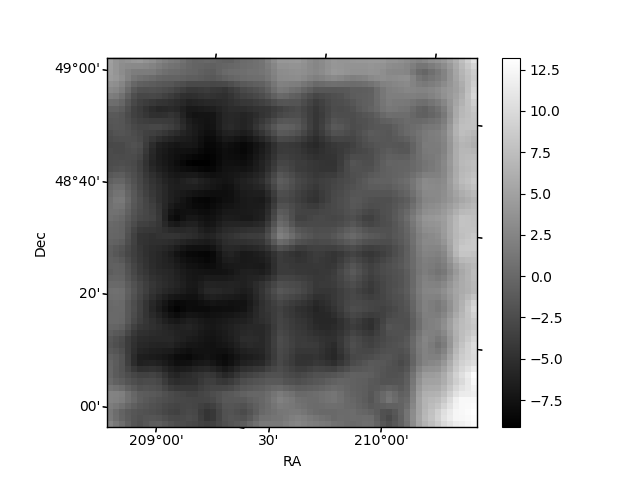
Quadrant B |
|---|---|---|---|
| Quadrant D |  |
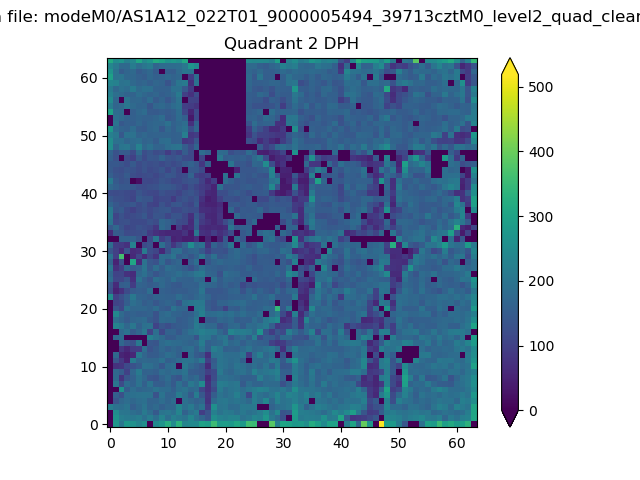 |
Quadrant C |
| Plot type | Count rate plots | Images |
|---|---|---|
| Comparison with Poisson distribution Blue bars denote a histogram of data divided into 1 sec bins. Red curve is a Poisson curve with rate = median count rate of data. |
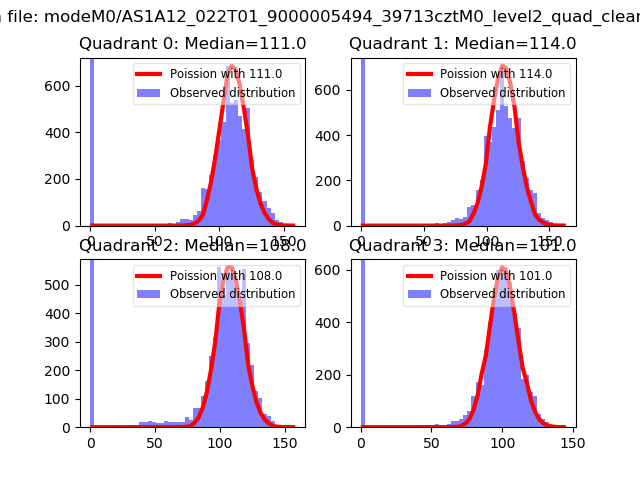 |
 |
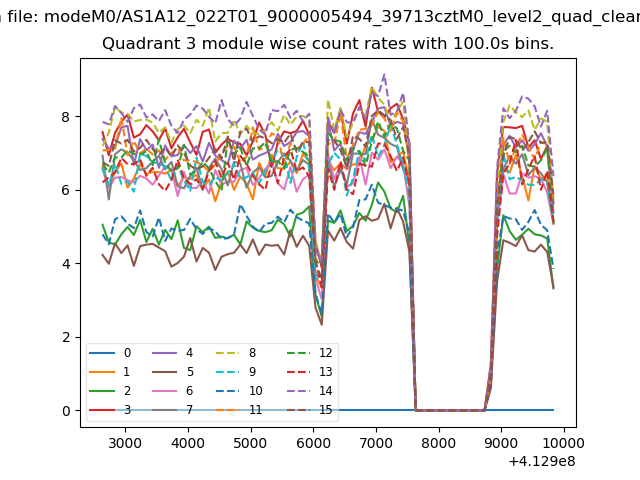
| Quadrant-wise count rates Data is divided into 100 sec bins |
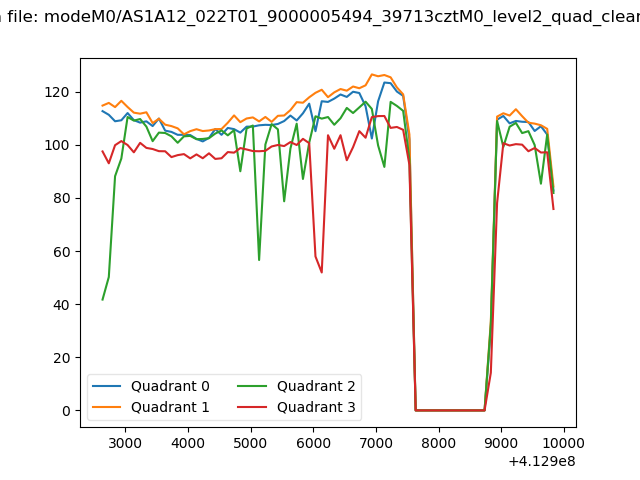 |
|
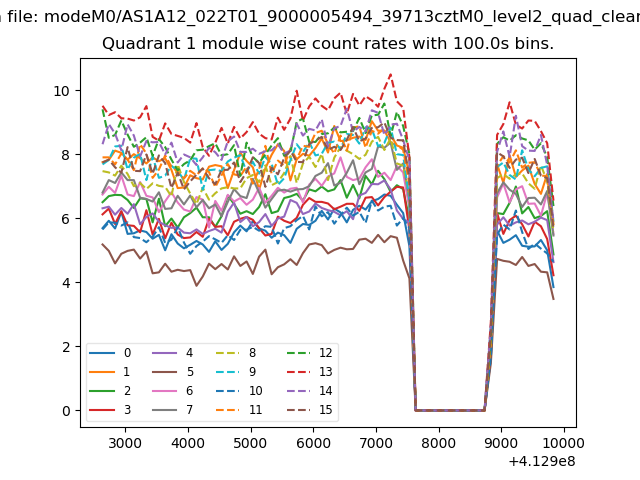
| Module-wise count rates for Quadrant A Data is divided into 100 sec bins |
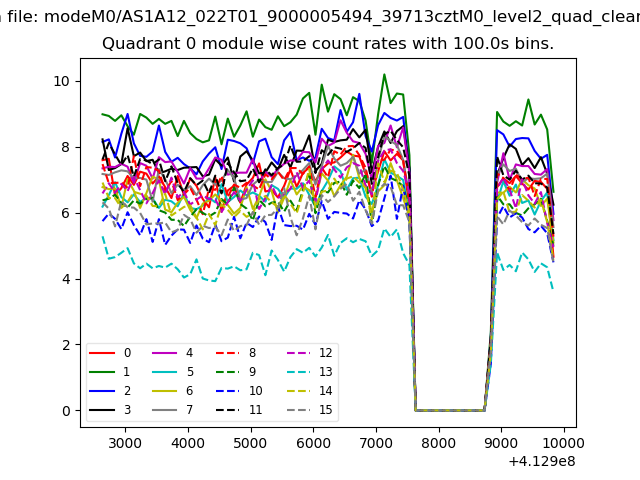 |
 |
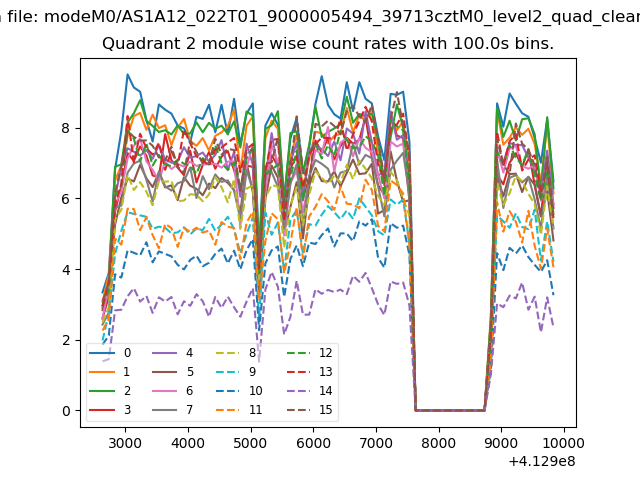
| Module-wise count rates for Quadrant B Data is divided into 100 sec bins |
 |
 |
| Module-wise count rates for Quadrant C Data is divided into 100 sec bins |
 |
 |
| Module-wise count rates for Quadrant D Data is divided into 100 sec bins |
 |
 |
| Parameter | Plot |
|---|---|
| CZT HV Monitor | 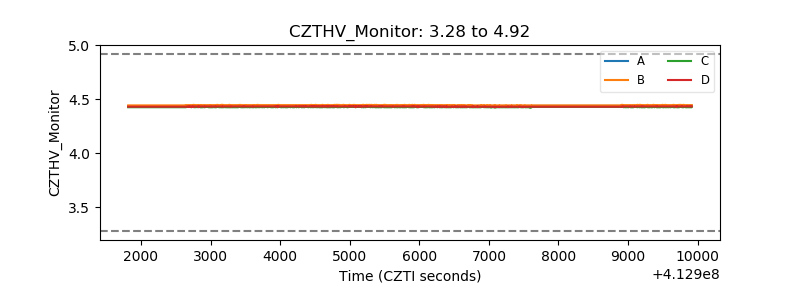 |
| D_VDD | 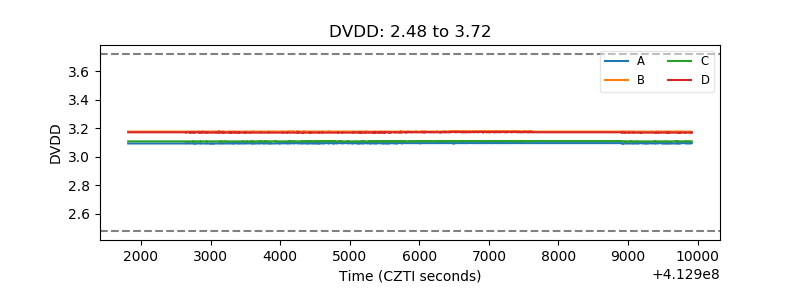 |
| Temperature 1 | 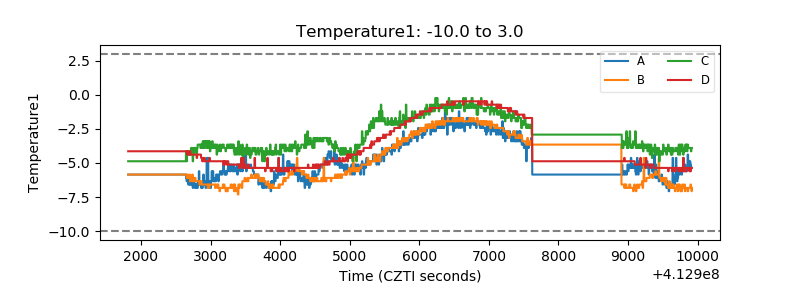 |
| Veto HV Monitor | 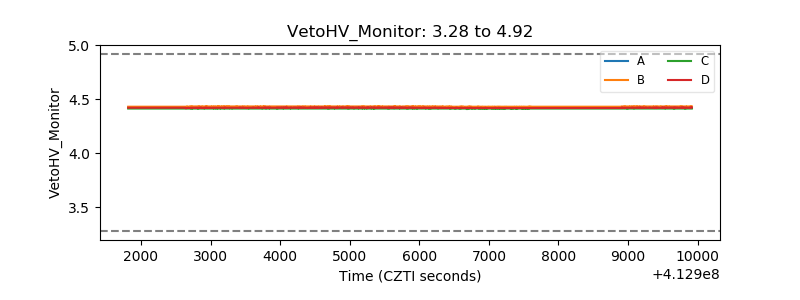 |
| Veto LLD | 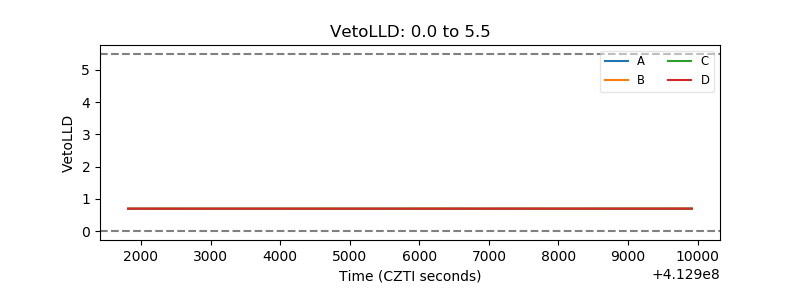 |
| Alpha Counter | 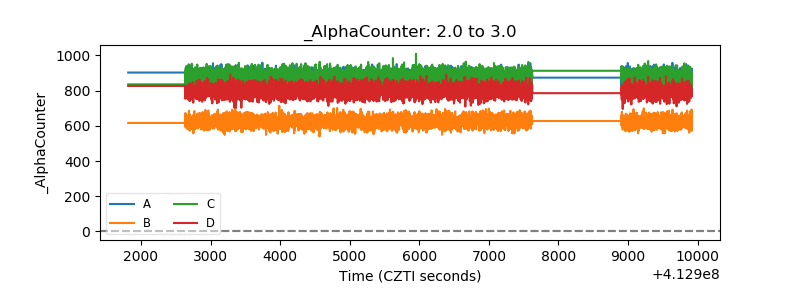 |
| _CPM_Rate | 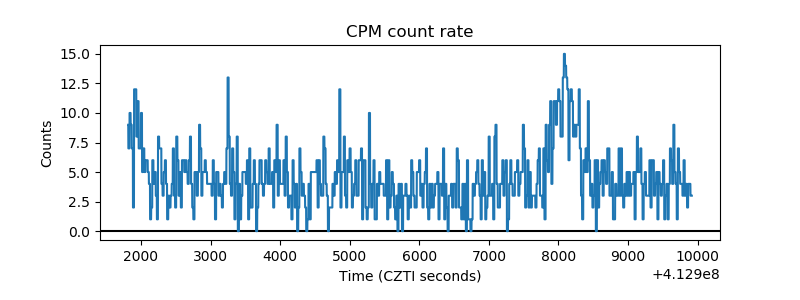 |
| CZT Counter | 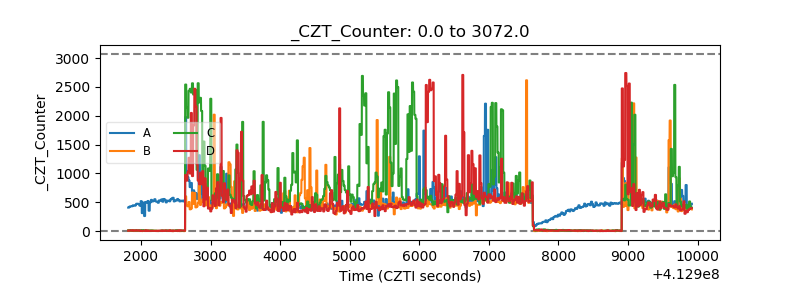 |
| +2.5 Volts monitor | 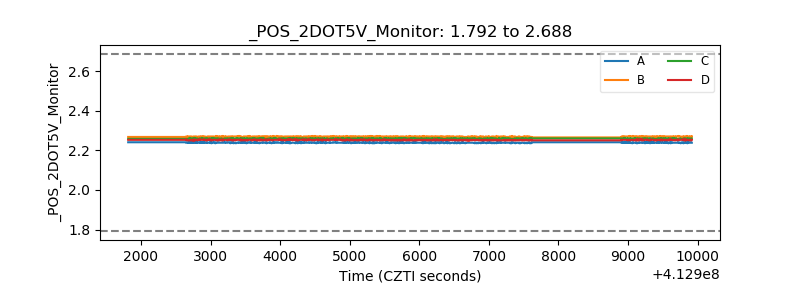 |
| +5 Volts monitor |  |
| _ROLL_ROT | 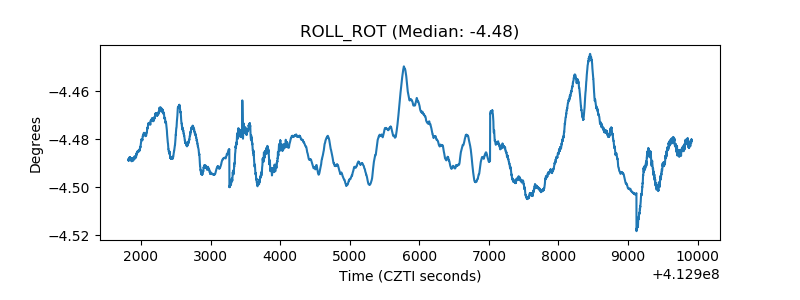 |
| _Roll_DEC | 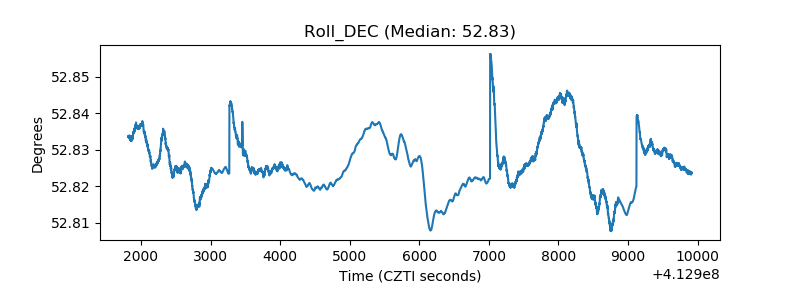 |
| _Roll_RA | 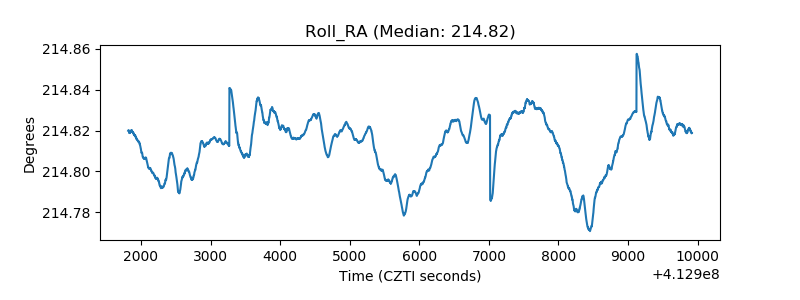 |
| Veto Counter | 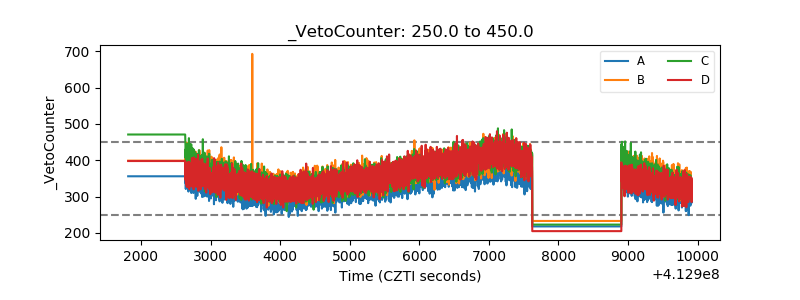 |