| Param | Original file | Final file |
|---|---|---|
| Filename | modeM0/AS1A12_022T01_9000005494_39715cztM0_level2.fits | modeM0/AS1A12_022T01_9000005494_39715cztM0_level2_quad_clean.evt |
| Size (bytes) | 882,743,040 | 177,739,200 |
| Size | 841.8 MB | 169.5 MB |
| Events in quadrant A | 6,436,047 | 1,228,071 |
| Events in quadrant B | 5,357,839 | 1,269,053 |
| Events in quadrant C | 12,600,829 | 1,030,111 |
| Events in quadrant D | 7,410,147 | 1,074,644 |
| Mode SS | |||
|---|---|---|---|
| Quadrant | BADHDUFLAG | Total packets | Discarded packets |
| A | 0 | 232 | 0 |
| B | 0 | 232 | 0 |
| C | 0 | 232 | 0 |
| D | 0 | 232 | 0 |
| Mode M0 | |||
|---|---|---|---|
| Quadrant | BADHDUFLAG | Total packets | Discarded packets |
| A | 0 | 26171 | 4 |
| B | 0 | 23740 | 3 |
| C | 0 | 45256 | 3 |
| D | 0 | 29934 | 3 |
| Mode M9 | |||
|---|---|---|---|
| Quadrant | BADHDUFLAG | Total packets | Discarded packets |
| A | 0 | 40 | 0 |
| B | 0 | 40 | 0 |
| C | 0 | 40 | 0 |
| D | 0 | 40 | 0 |
| Quadrant | Total seconds | Saturated seconds | Saturation percentage |
|---|---|---|---|
| A | 11259 | 164 | 1.456612% |
| B | 11259 | 86 | 0.763833% |
| C | 11259 | 1844 | 16.378009% |
| D | 11259 | 525 | 4.662936% |
Noise dominated data is calculated using 1-second bins in cleaned event files. If a bin has >2000 counts, and if more than 50% of those come from <1% of pixels, then it is considered to be noise-dominated and hence unusable.
| Quadrant | # 1 sec bins | Bins with >0 counts | Bins with >2000 counts | High rate bins dominated by noise | Noise dominated (total time) | Noise dominated (detector-on time) | Marked lightcurve |
|---|---|---|---|---|---|---|---|
| A | 15313 | 11262 | 107 | 107 | 0.70% | 0.95% | 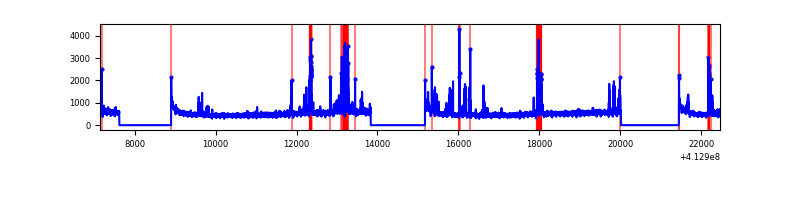 |
| B | 15313 | 11262 | 46 | 46 | 0.30% | 0.41% | 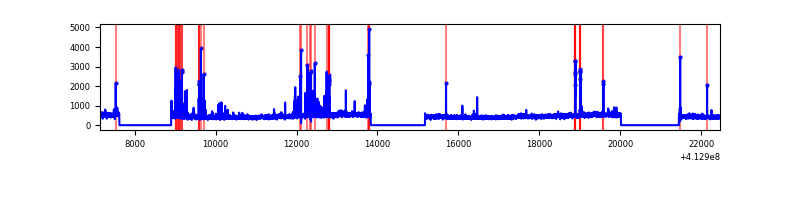 |
| C | 15313 | 11262 | 1520 | 1520 | 9.93% | 13.50% | 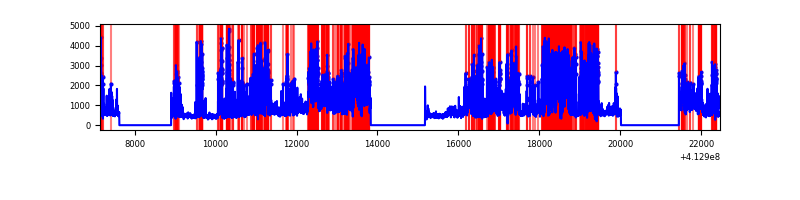 |
| D | 15313 | 11262 | 414 | 414 | 2.70% | 3.68% | 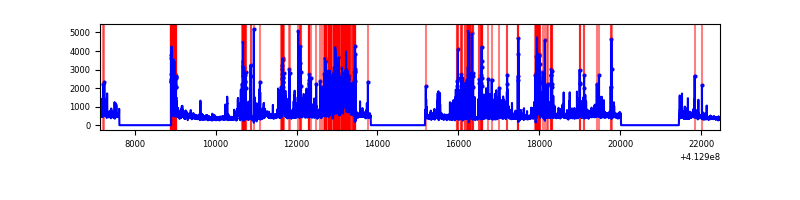 |
Top three noisy pixels from each quadrant. If the there are fewer than three noisy pixels in the level2.evt file, extra rows are filled as -1
| Pixel properties | Quadrant properties | ||||||
|---|---|---|---|---|---|---|---|
| Quadrant | DetID | PixID | Counts | Sigma | Mean | Median | Sigma |
| A | 10 | 83 | 839876 | 3351.14 | 1240 | 1214 | 250.3 |
| A | 15 | 174 | 711000 | 2836.18 | 1240 | 1214 | 250.3 |
| A | 13 | 248 | 40474 | 156.88 | 1240 | 1214 | 250.3 |
| B | 5 | 172 | 256931 | 1075.61 | 1238 | 1200 | 237.8 |
| B | 5 | 255 | 69213 | 286.06 | 1238 | 1200 | 237.8 |
| B | 0 | 190 | 49693 | 203.96 | 1238 | 1200 | 237.8 |
| C | 9 | 187 | 6365195 | 24368.47 | 1127 | 1136 | 261.2 |
| C | 15 | 208 | 1351134 | 5169.25 | 1127 | 1136 | 261.2 |
| C | 15 | 214 | 433254 | 1654.61 | 1127 | 1136 | 261.2 |
| D | 12 | 227 | 1831010 | 6257.07 | 1194 | 1160 | 292.4 |
| D | 2 | 250 | 253328 | 862.27 | 1194 | 1160 | 292.4 |
| D | 13 | 171 | 231325 | 787.04 | 1194 | 1160 | 292.4 |
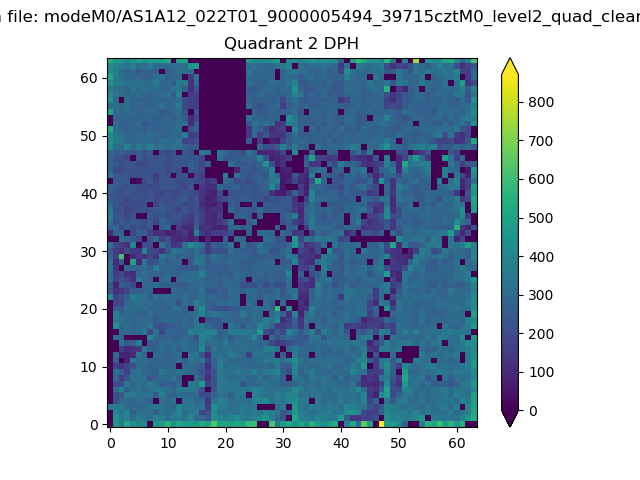
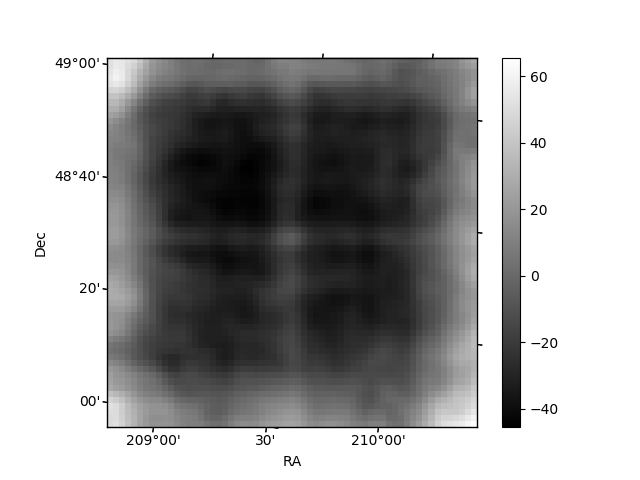
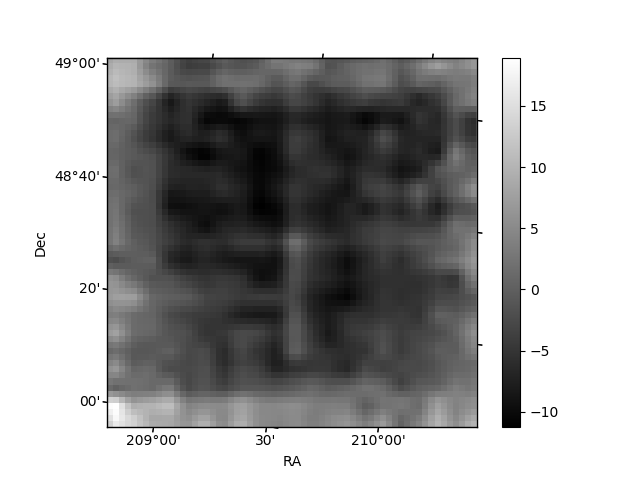
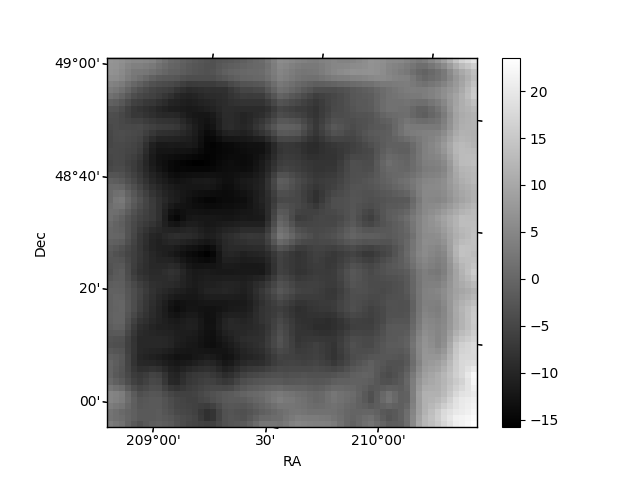
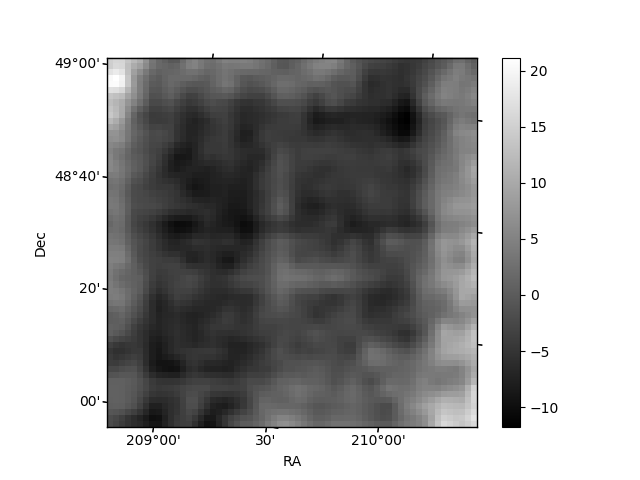
Histogram calculated using DETX and DETY for each event in the final _common_clean file
| Quadrant A | 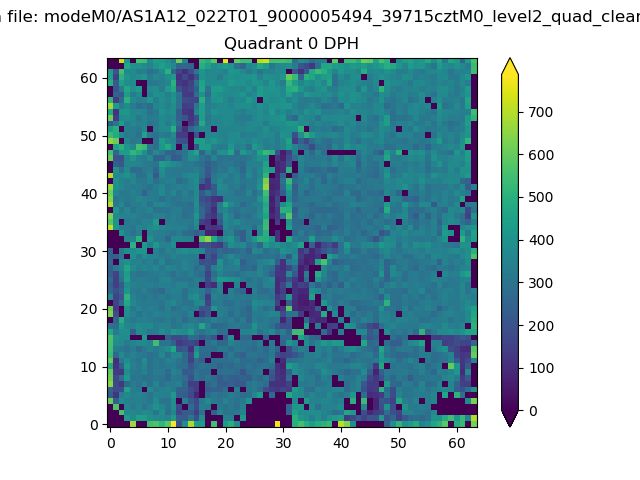 |
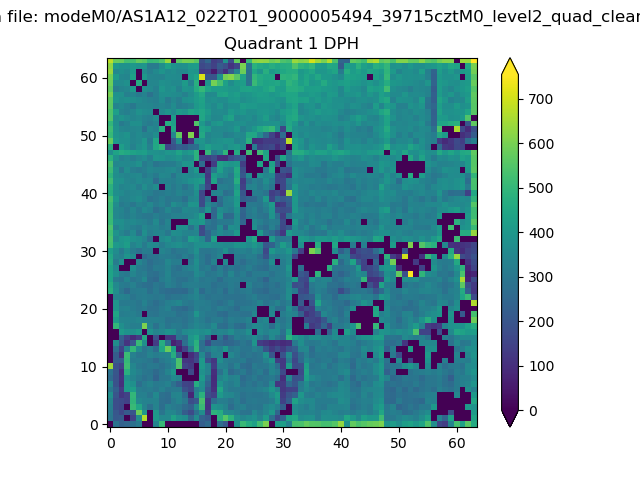 |
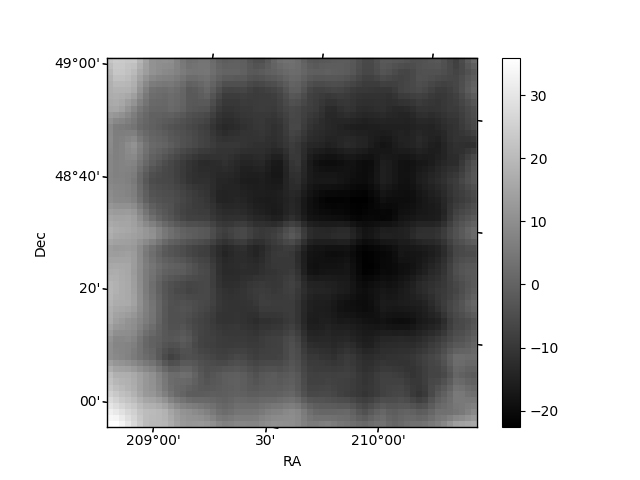
Quadrant B |
|---|---|---|---|
| Quadrant D | 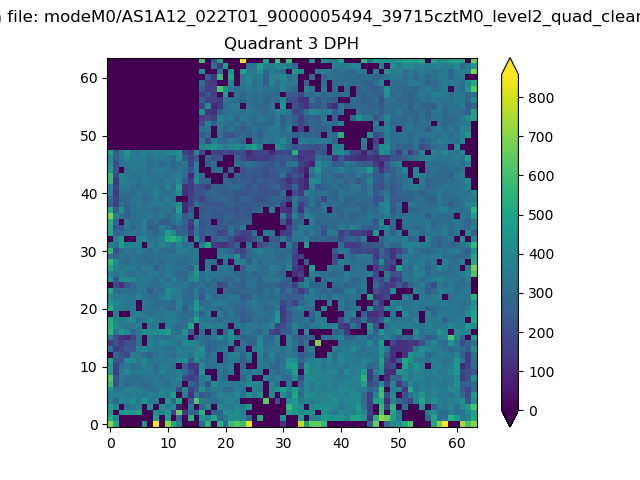 |
 |
Quadrant C |
| Plot type | Count rate plots | Images |
|---|---|---|
| Comparison with Poisson distribution Blue bars denote a histogram of data divided into 1 sec bins. Red curve is a Poisson curve with rate = median count rate of data. |
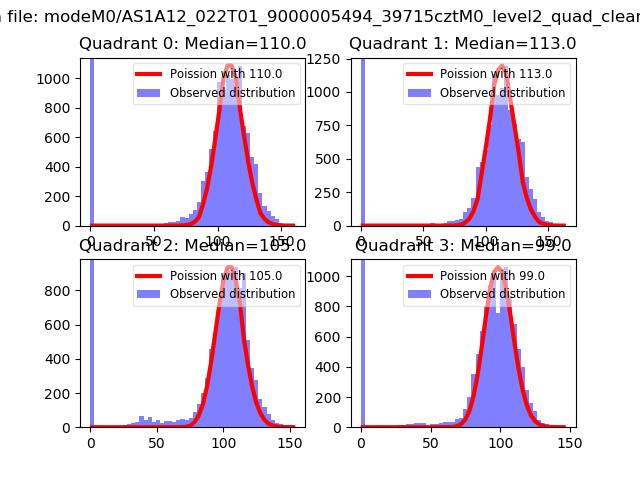 |
 |
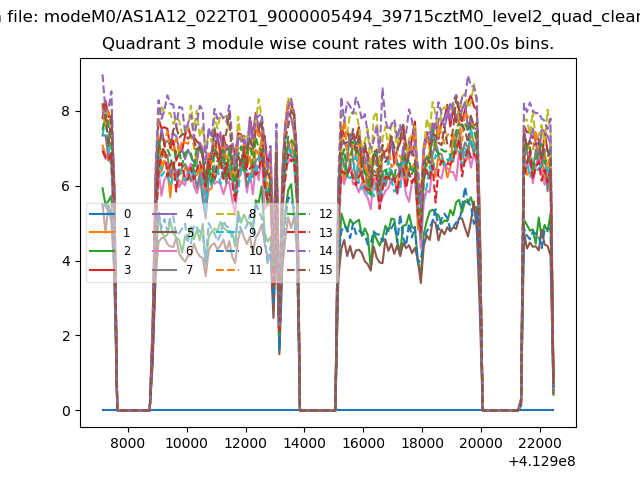
| Quadrant-wise count rates Data is divided into 100 sec bins |
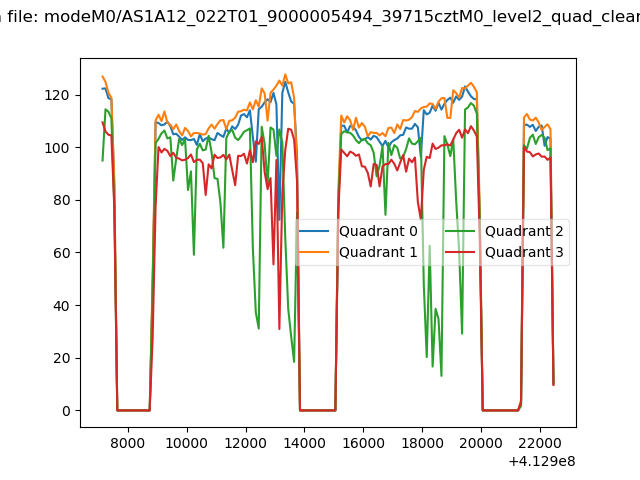 |
|
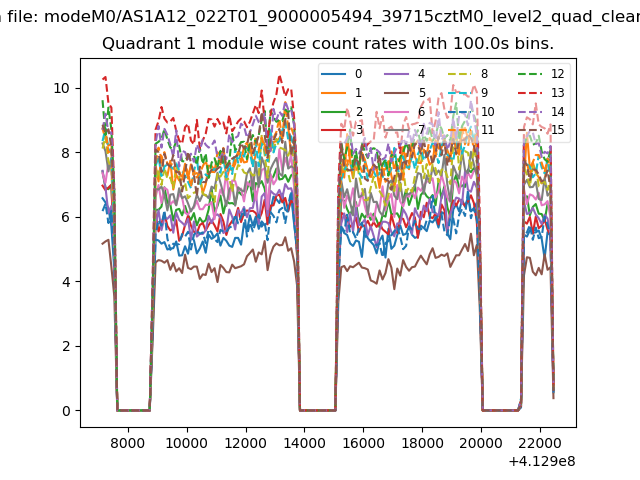
| Module-wise count rates for Quadrant A Data is divided into 100 sec bins |
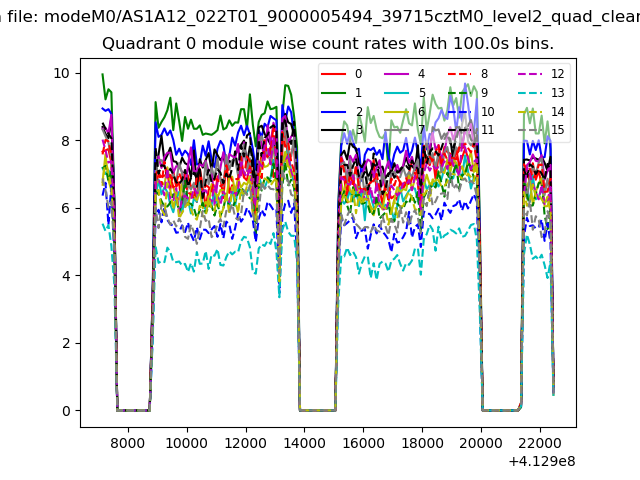 |
 |
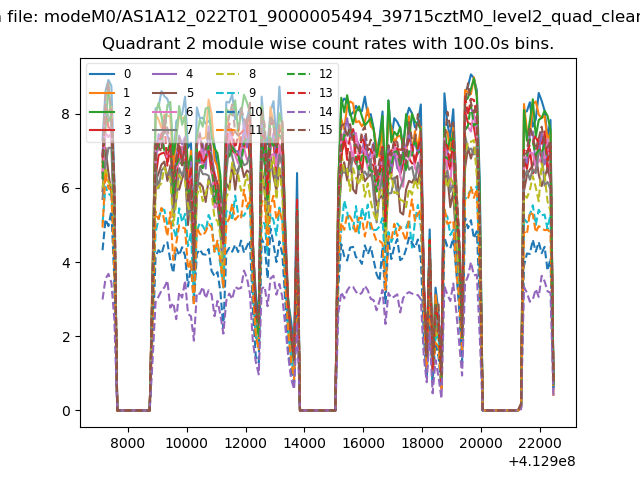
| Module-wise count rates for Quadrant B Data is divided into 100 sec bins |
 |
 |
| Module-wise count rates for Quadrant C Data is divided into 100 sec bins |
 |
 |
| Module-wise count rates for Quadrant D Data is divided into 100 sec bins |
 |
 |
| Parameter | Plot |
|---|---|
| CZT HV Monitor | 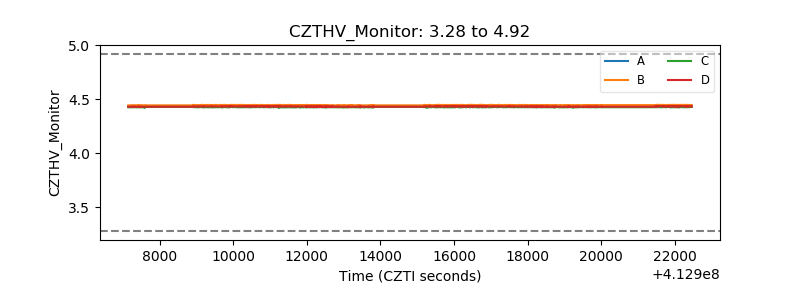 |
| D_VDD |  |
| Temperature 1 | 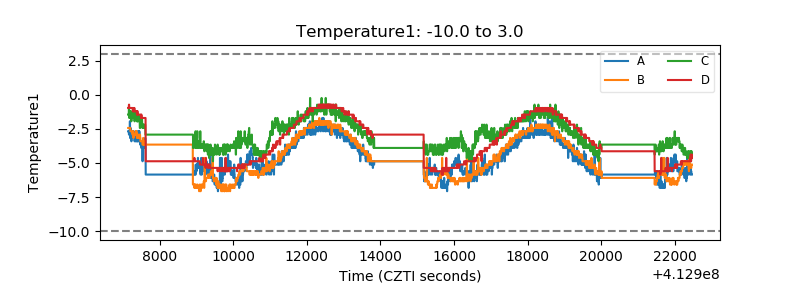 |
| Veto HV Monitor | 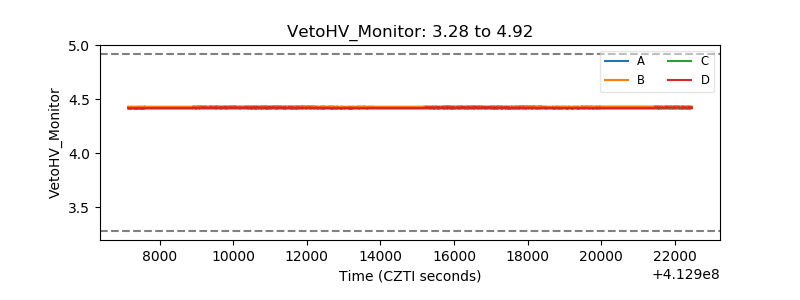 |
| Veto LLD | 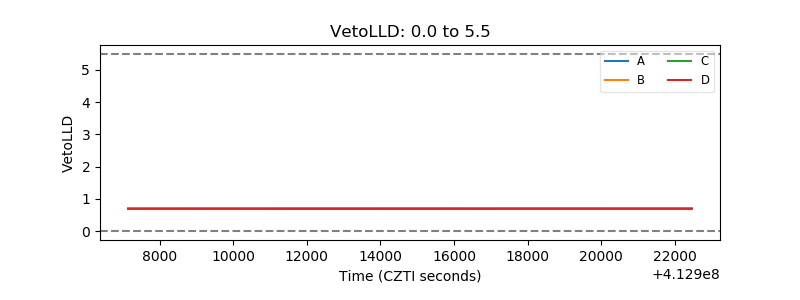 |
| Alpha Counter | 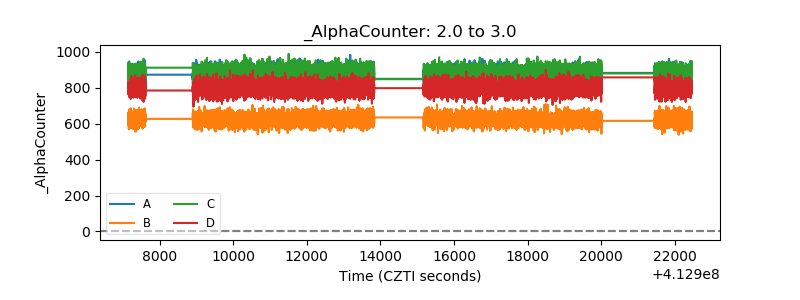 |
| _CPM_Rate | 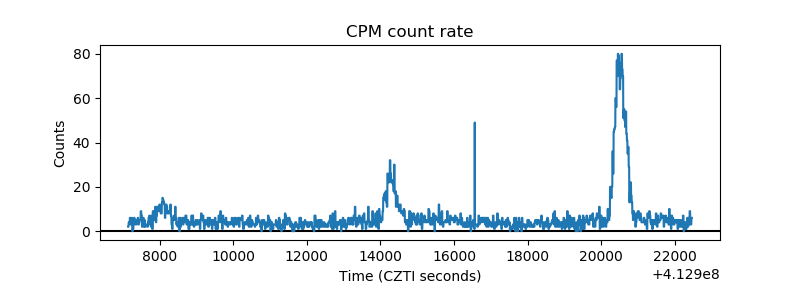 |
| CZT Counter | 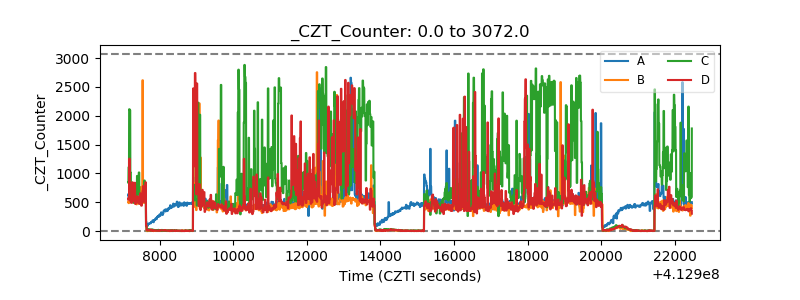 |
| +2.5 Volts monitor | 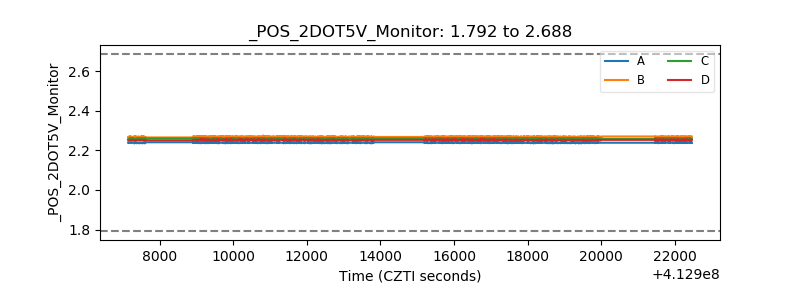 |
| +5 Volts monitor | 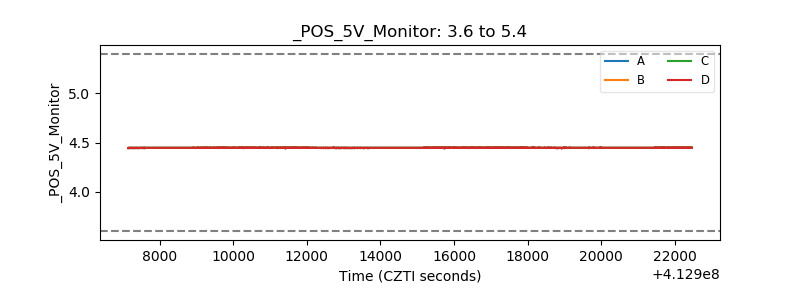 |
| _ROLL_ROT | 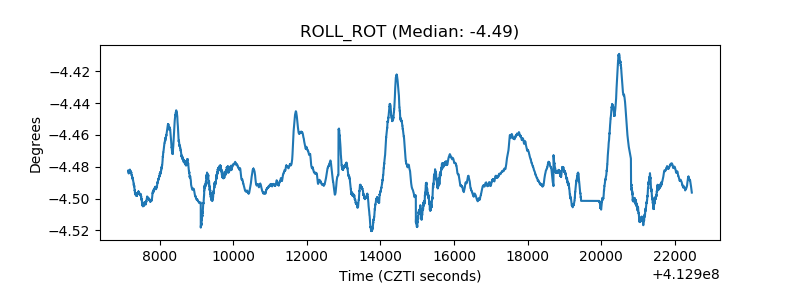 |
| _Roll_DEC | 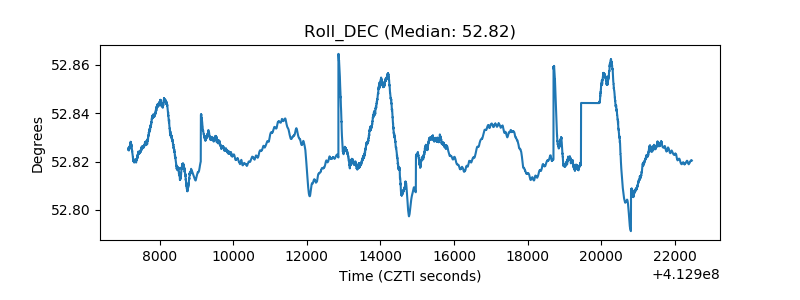 |
| _Roll_RA | 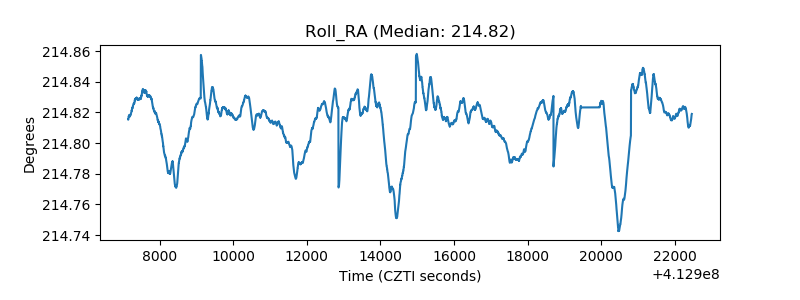 |
| Veto Counter | 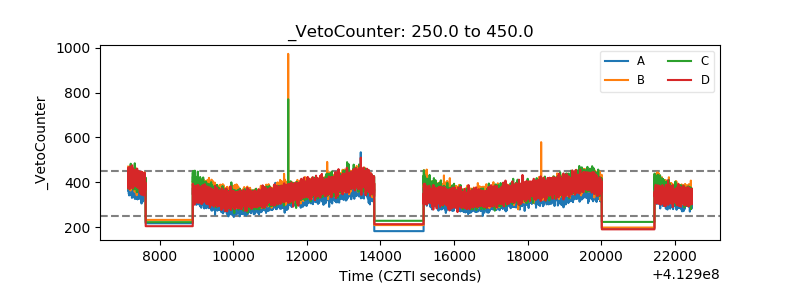 |