| Param | Original file | Final file |
|---|---|---|
| Filename | modeM0/AS1A12_022T01_9000005494_39716cztM0_level2.fits | modeM0/AS1A12_022T01_9000005494_39716cztM0_level2_quad_clean.evt |
| Size (bytes) | 407,188,800 | 89,055,360 |
| Size | 388.3 MB | 84.9 MB |
| Events in quadrant A | 3,322,454 | 602,110 |
| Events in quadrant B | 2,687,294 | 619,392 |
| Events in quadrant C | 4,918,478 | 562,167 |
| Events in quadrant D | 3,717,505 | 528,374 |
| Mode SS | |||
|---|---|---|---|
| Quadrant | BADHDUFLAG | Total packets | Discarded packets |
| A | 0 | 110 | 0 |
| B | 0 | 110 | 0 |
| C | 0 | 110 | 0 |
| D | 0 | 110 | 0 |
| Mode M0 | |||
|---|---|---|---|
| Quadrant | BADHDUFLAG | Total packets | Discarded packets |
| A | 0 | 13190 | 1 |
| B | 0 | 11769 | 0 |
| C | 0 | 18496 | 0 |
| D | 0 | 15041 | 0 |
| Mode M9 | |||
|---|---|---|---|
| Quadrant | BADHDUFLAG | Total packets | Discarded packets |
| A | 0 | 16 | 0 |
| B | 0 | 16 | 0 |
| C | 0 | 16 | 0 |
| D | 0 | 16 | 0 |
| Quadrant | Total seconds | Saturated seconds | Saturation percentage |
|---|---|---|---|
| A | 5495 | 84 | 1.528662% |
| B | 5495 | 38 | 0.691538% |
| C | 5495 | 339 | 6.169245% |
| D | 5495 | 214 | 3.894449% |
Noise dominated data is calculated using 1-second bins in cleaned event files. If a bin has >2000 counts, and if more than 50% of those come from <1% of pixels, then it is considered to be noise-dominated and hence unusable.
| Quadrant | # 1 sec bins | Bins with >0 counts | Bins with >2000 counts | High rate bins dominated by noise | Noise dominated (total time) | Noise dominated (detector-on time) | Marked lightcurve |
|---|---|---|---|---|---|---|---|
| A | 7047 | 5496 | 62 | 62 | 0.88% | 1.13% | 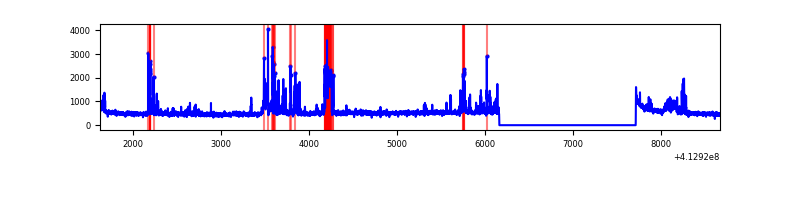 |
| B | 7047 | 5496 | 33 | 33 | 0.47% | 0.60% | 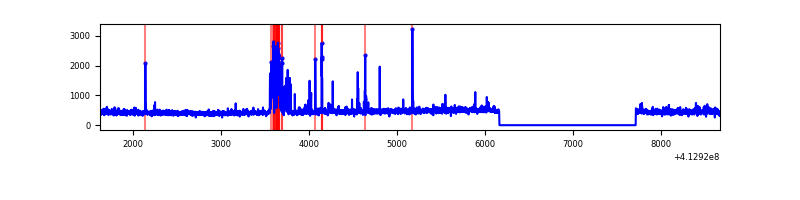 |
| C | 7047 | 5496 | 299 | 299 | 4.24% | 5.44% | 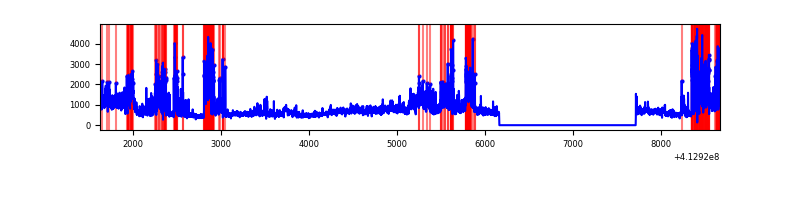 |
| D | 7047 | 5496 | 190 | 190 | 2.70% | 3.46% | 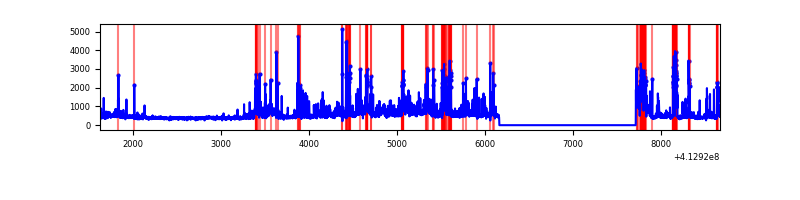 |
Top three noisy pixels from each quadrant. If the there are fewer than three noisy pixels in the level2.evt file, extra rows are filled as -1
| Pixel properties | Quadrant properties | ||||||
|---|---|---|---|---|---|---|---|
| Quadrant | DetID | PixID | Counts | Sigma | Mean | Median | Sigma |
| A | 10 | 83 | 392024 | 3137.46 | 605 | 593 | 124.8 |
| A | 15 | 174 | 361257 | 2890.85 | 605 | 593 | 124.8 |
| A | 9 | 143 | 224242 | 1792.63 | 605 | 593 | 124.8 |
| B | 5 | 172 | 222787 | 1886.47 | 601 | 584 | 117.8 |
| B | 0 | 190 | 54195 | 455.15 | 601 | 584 | 117.8 |
| B | 5 | 255 | 19932 | 164.26 | 601 | 584 | 117.8 |
| C | 9 | 187 | 1530883 | 11364.57 | 575 | 579 | 134.7 |
| C | 15 | 208 | 835751 | 6202.28 | 575 | 579 | 134.7 |
| C | 15 | 214 | 220009 | 1629.56 | 575 | 579 | 134.7 |
| D | 12 | 227 | 1135243 | 7959.37 | 580 | 561 | 142.6 |
| D | 2 | 250 | 193244 | 1351.6 | 580 | 561 | 142.6 |
| D | 12 | 233 | 84770 | 590.69 | 580 | 561 | 142.6 |
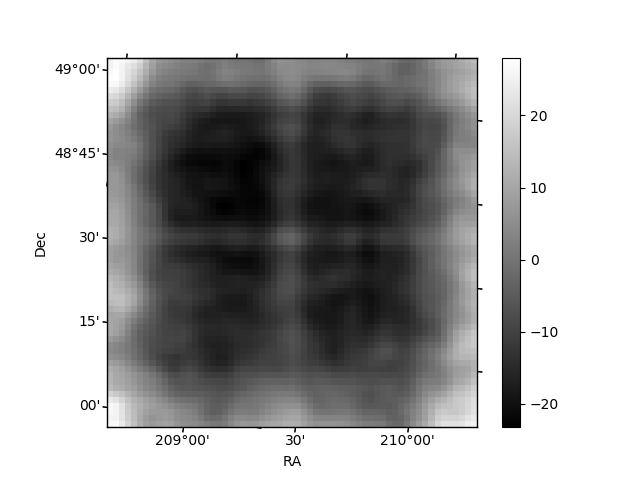
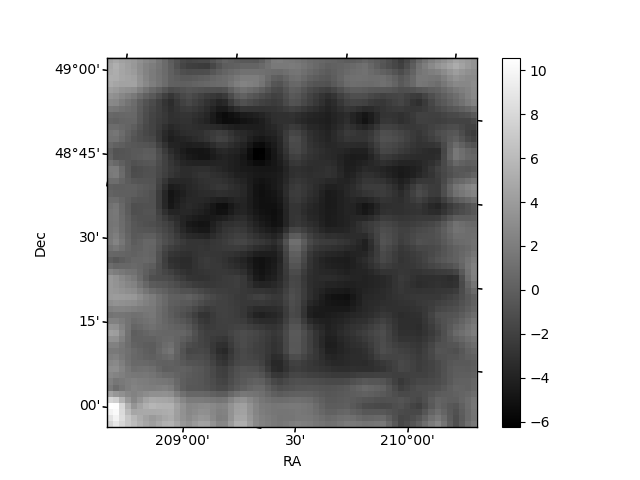
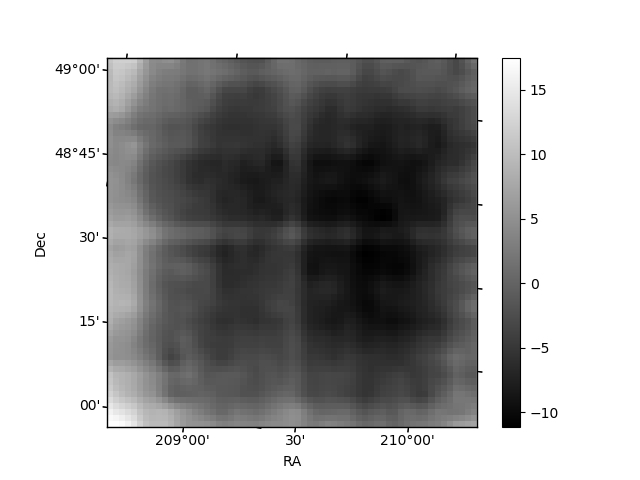
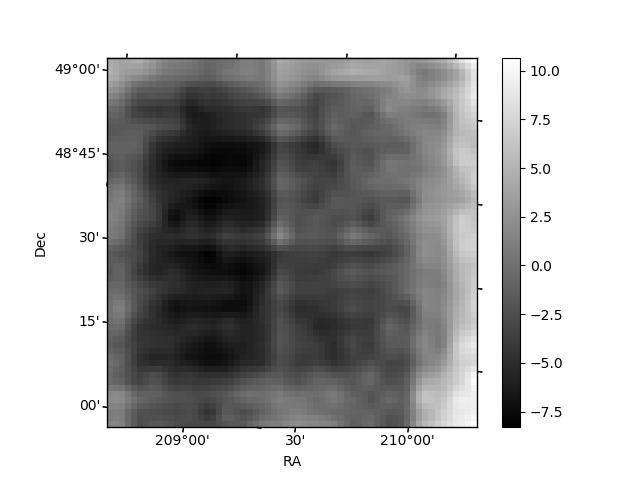
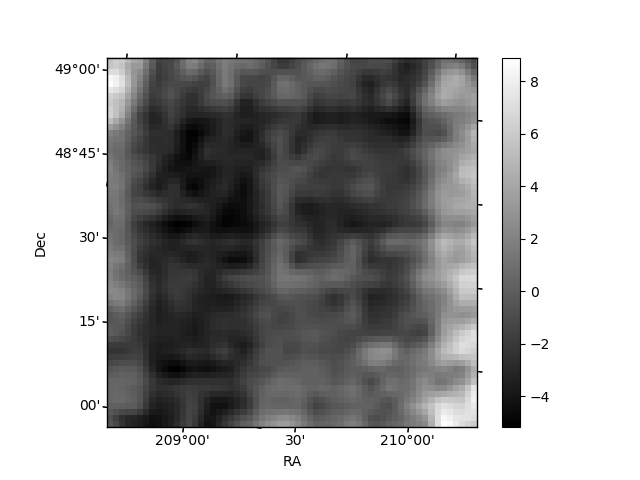
Histogram calculated using DETX and DETY for each event in the final _common_clean file
| Quadrant A | 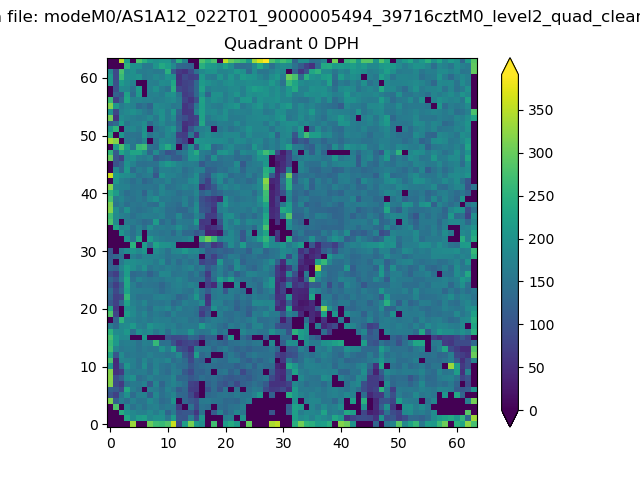 |
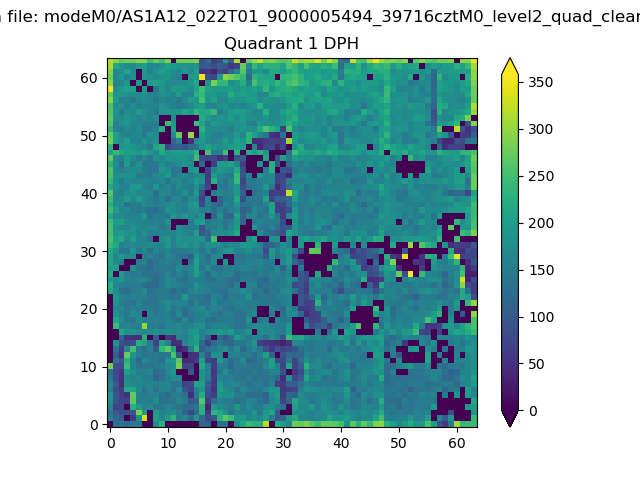 |
Quadrant B |
|---|---|---|---|
| Quadrant D | 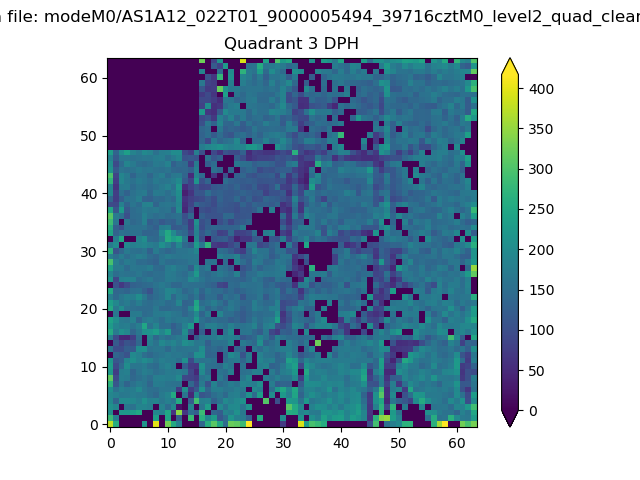 |
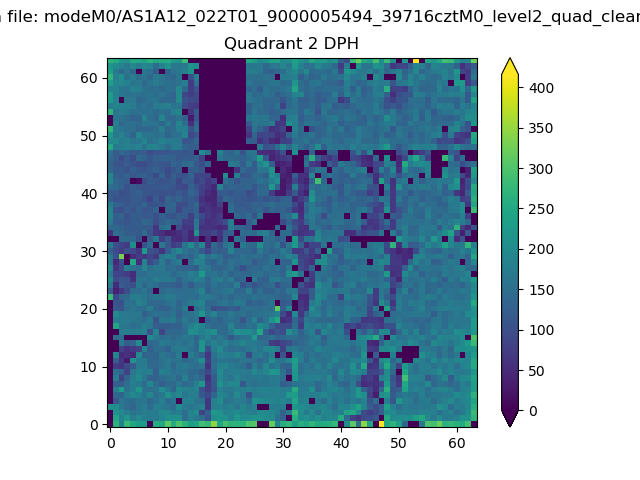 |
Quadrant C |
| Plot type | Count rate plots | Images |
|---|---|---|
| Comparison with Poisson distribution Blue bars denote a histogram of data divided into 1 sec bins. Red curve is a Poisson curve with rate = median count rate of data. |
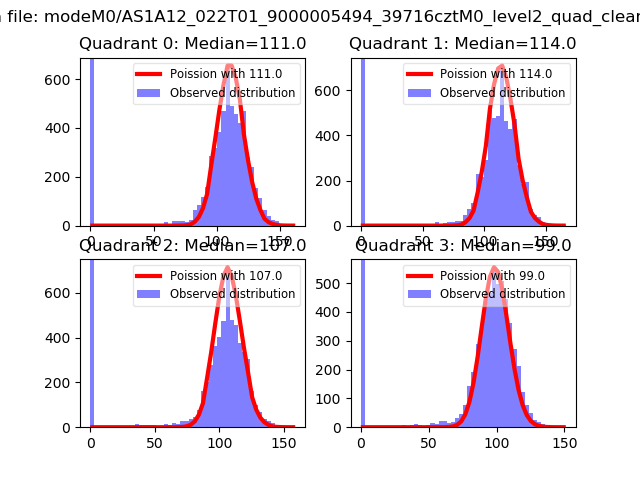 |
 |
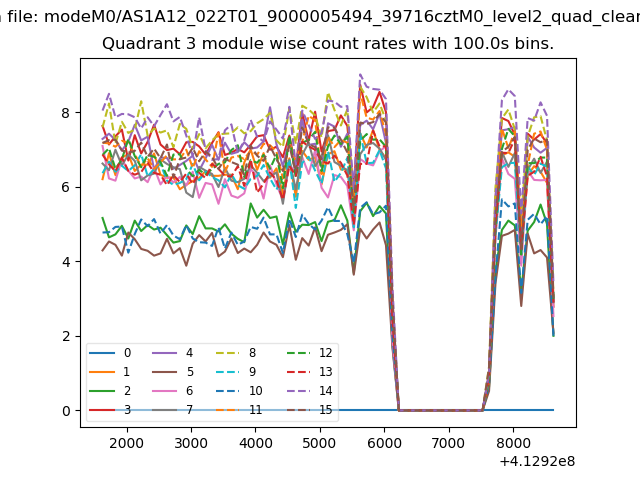
| Quadrant-wise count rates Data is divided into 100 sec bins |
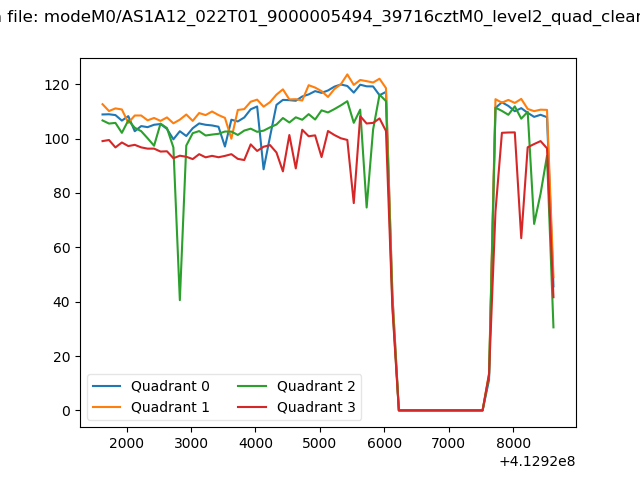 |
|
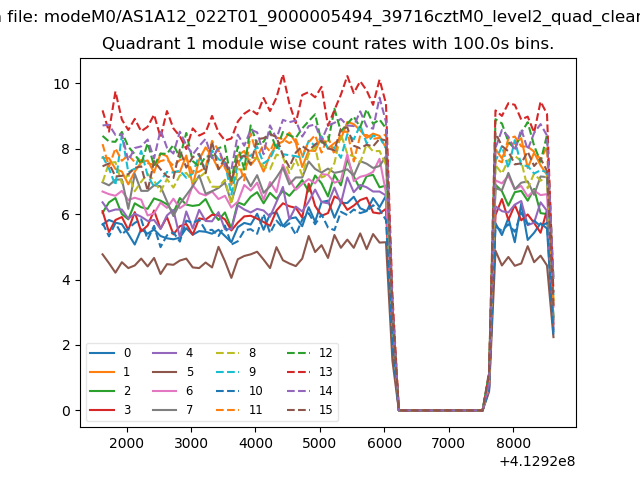
| Module-wise count rates for Quadrant A Data is divided into 100 sec bins |
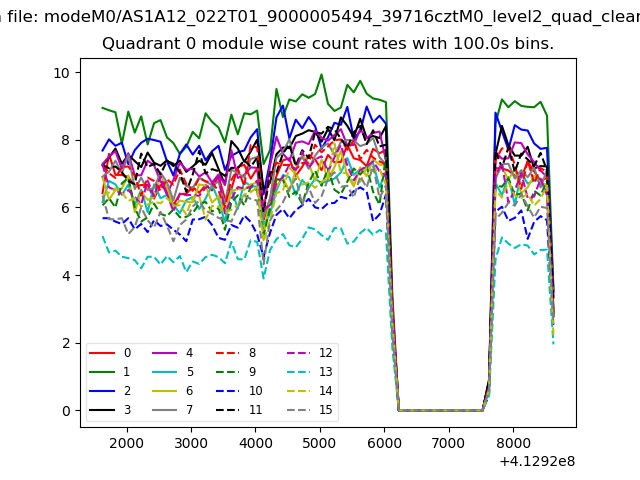 |
 |
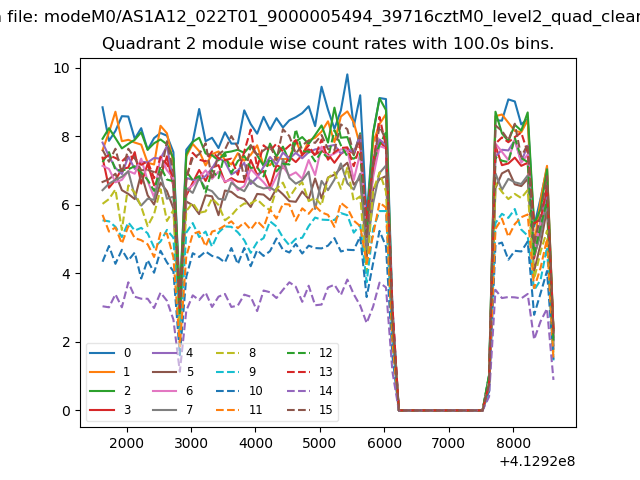
| Module-wise count rates for Quadrant B Data is divided into 100 sec bins |
 |
 |
| Module-wise count rates for Quadrant C Data is divided into 100 sec bins |
 |
 |
| Module-wise count rates for Quadrant D Data is divided into 100 sec bins |
 |
 |
| Parameter | Plot |
|---|---|
| CZT HV Monitor | 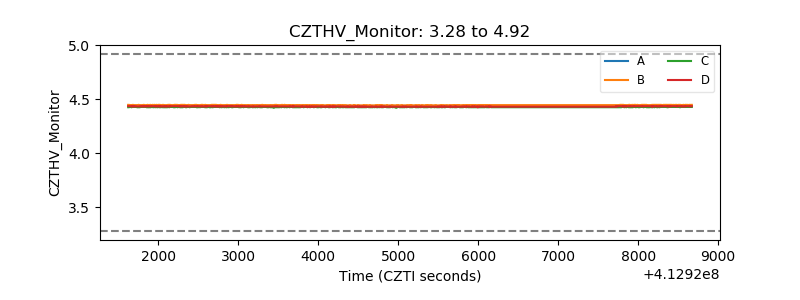 |
| D_VDD | 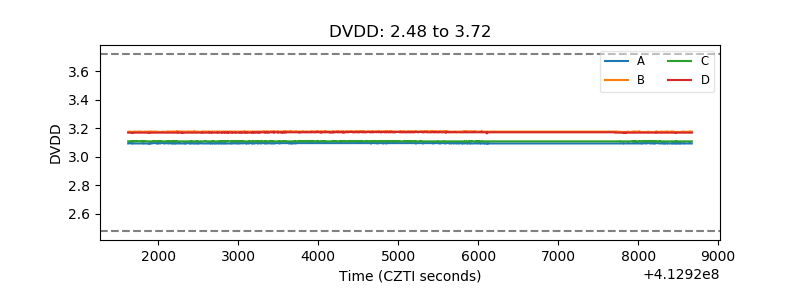 |
| Temperature 1 |  |
| Veto HV Monitor | 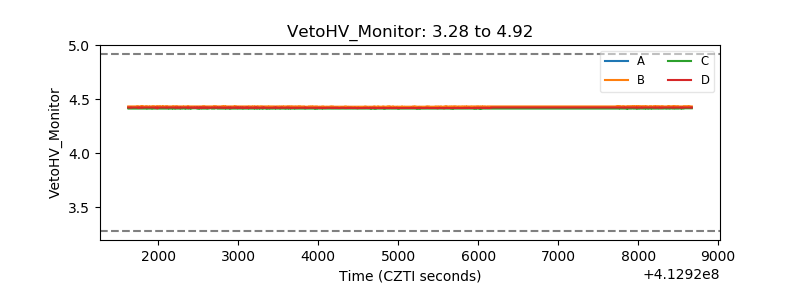 |
| Veto LLD | 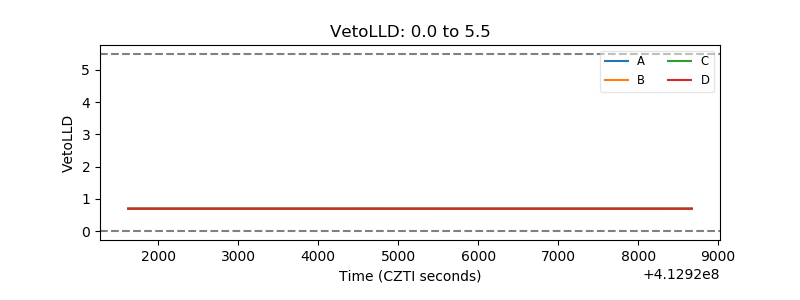 |
| Alpha Counter | 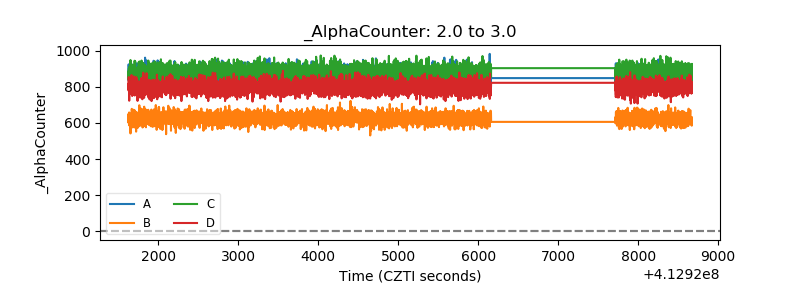 |
| _CPM_Rate | 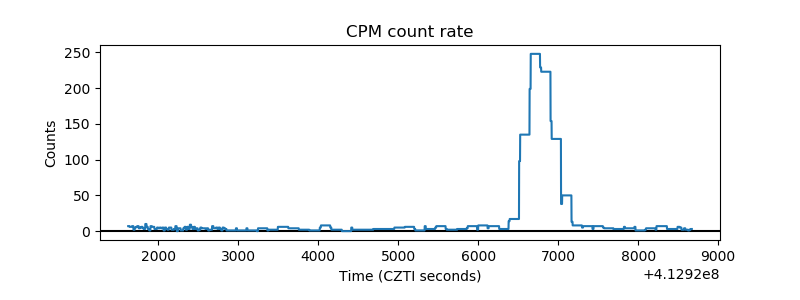 |
| CZT Counter | 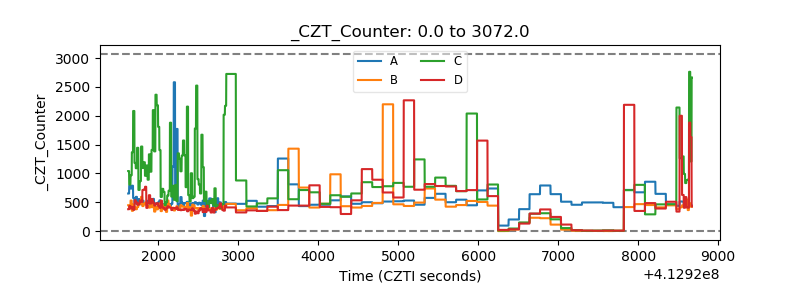 |
| +2.5 Volts monitor | 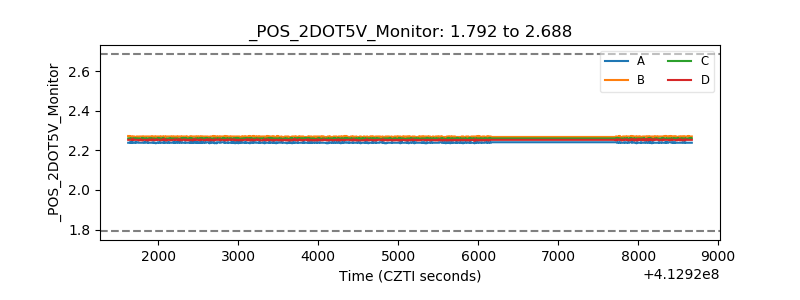 |
| +5 Volts monitor | 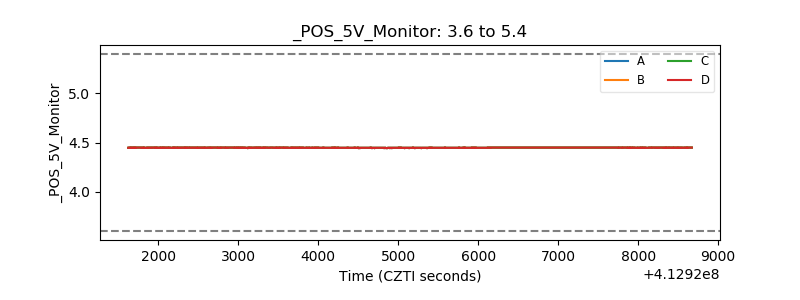 |
| _ROLL_ROT | 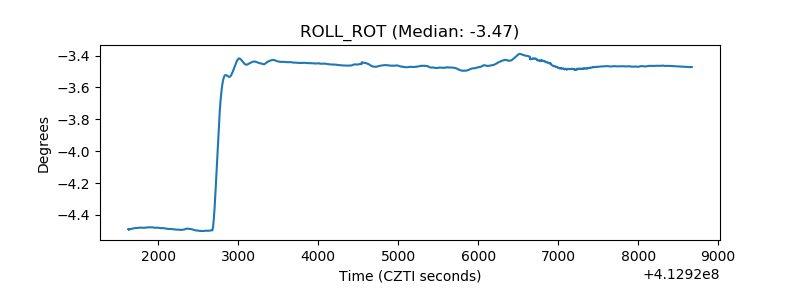 |
| _Roll_DEC | 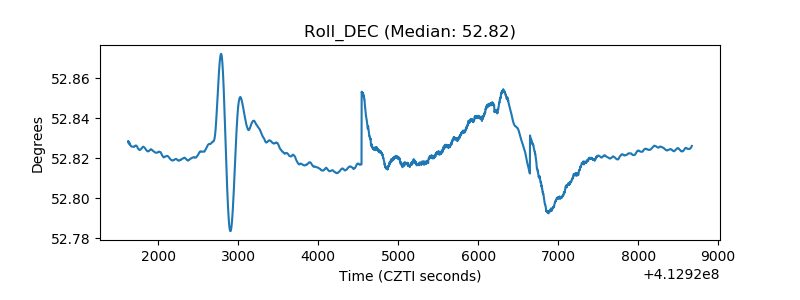 |
| _Roll_RA | 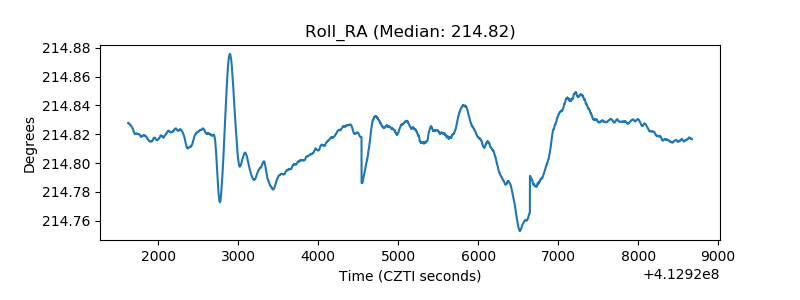 |
| Veto Counter | 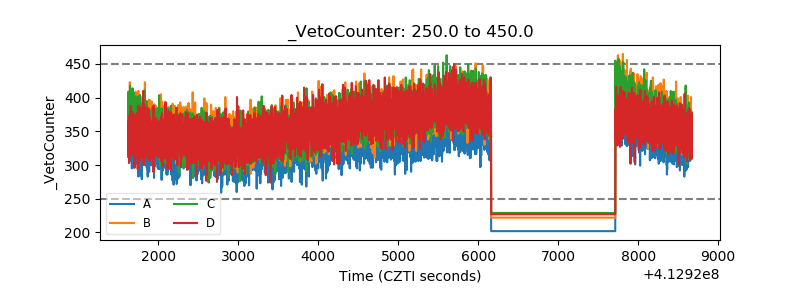 |