| Param | Original file | Final file |
|---|---|---|
| Filename | modeM0/AS1A12_022T01_9000005494_39717cztM0_level2.fits | modeM0/AS1A12_022T01_9000005494_39717cztM0_level2_quad_clean.evt |
| Size (bytes) | 458,372,160 | 85,875,840 |
| Size | 437.1 MB | 81.9 MB |
| Events in quadrant A | 2,969,928 | 602,797 |
| Events in quadrant B | 2,881,051 | 604,219 |
| Events in quadrant C | 7,365,557 | 489,969 |
| Events in quadrant D | 3,334,742 | 528,236 |
| Mode SS | |||
|---|---|---|---|
| Quadrant | BADHDUFLAG | Total packets | Discarded packets |
| A | 0 | 108 | 0 |
| B | 0 | 108 | 0 |
| C | 0 | 108 | 0 |
| D | 0 | 108 | 0 |
| Mode M0 | |||
|---|---|---|---|
| Quadrant | BADHDUFLAG | Total packets | Discarded packets |
| A | 0 | 12010 | 2 |
| B | 0 | 12118 | 1 |
| C | 0 | 25711 | 1 |
| D | 0 | 13550 | 1 |
| Mode M9 | |||
|---|---|---|---|
| Quadrant | BADHDUFLAG | Total packets | Discarded packets |
| A | 0 | 17 | 0 |
| B | 0 | 17 | 0 |
| C | 0 | 17 | 0 |
| D | 0 | 17 | 0 |
| Quadrant | Total seconds | Saturated seconds | Saturation percentage |
|---|---|---|---|
| A | 5356 | 32 | 0.597461% |
| B | 5356 | 141 | 2.632562% |
| C | 5356 | 1100 | 20.537715% |
| D | 5356 | 153 | 2.856609% |
Noise dominated data is calculated using 1-second bins in cleaned event files. If a bin has >2000 counts, and if more than 50% of those come from <1% of pixels, then it is considered to be noise-dominated and hence unusable.
| Quadrant | # 1 sec bins | Bins with >0 counts | Bins with >2000 counts | High rate bins dominated by noise | Noise dominated (total time) | Noise dominated (detector-on time) | Marked lightcurve |
|---|---|---|---|---|---|---|---|
| A | 7030 | 5357 | 16 | 16 | 0.23% | 0.30% | 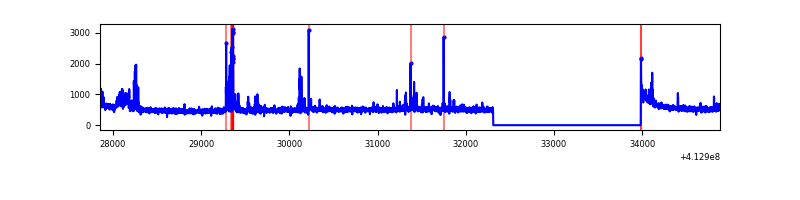 |
| B | 7030 | 5357 | 103 | 103 | 1.47% | 1.92% | 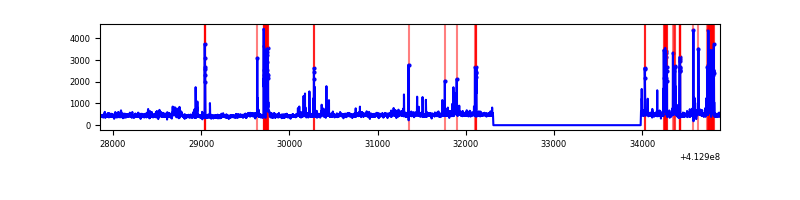 |
| C | 7030 | 5357 | 1135 | 1135 | 16.15% | 21.19% | 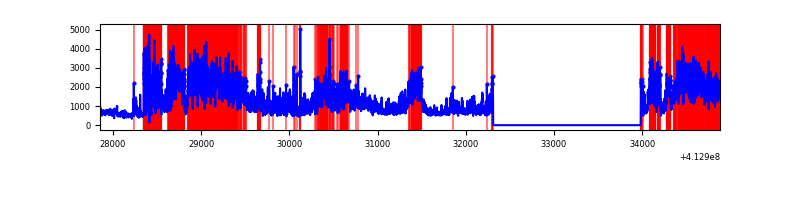 |
| D | 7030 | 5357 | 135 | 135 | 1.92% | 2.52% | 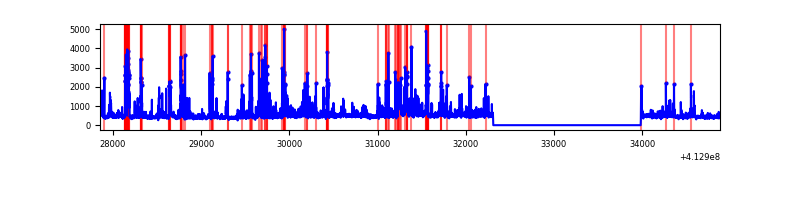 |
Top three noisy pixels from each quadrant. If the there are fewer than three noisy pixels in the level2.evt file, extra rows are filled as -1
| Pixel properties | Quadrant properties | ||||||
|---|---|---|---|---|---|---|---|
| Quadrant | DetID | PixID | Counts | Sigma | Mean | Median | Sigma |
| A | 10 | 83 | 395028 | 3218.37 | 598 | 585 | 122.6 |
| A | 15 | 174 | 160327 | 1303.38 | 598 | 585 | 122.6 |
| A | 9 | 143 | 93350 | 756.9 | 598 | 585 | 122.6 |
| B | 5 | 255 | 249481 | 2182.49 | 585 | 568 | 114.1 |
| B | 5 | 172 | 199085 | 1740.61 | 585 | 568 | 114.1 |
| B | 0 | 190 | 85580 | 745.39 | 585 | 568 | 114.1 |
| C | 9 | 187 | 3806110 | 29995.7 | 544 | 547 | 126.9 |
| C | 15 | 208 | 787046 | 6199.24 | 544 | 547 | 126.9 |
| C | 14 | 254 | 396842 | 3123.62 | 544 | 547 | 126.9 |
| D | 12 | 227 | 664178 | 4686.61 | 575 | 558 | 141.6 |
| D | 2 | 250 | 284426 | 2004.73 | 575 | 558 | 141.6 |
| D | 13 | 249 | 59356 | 415.24 | 575 | 558 | 141.6 |
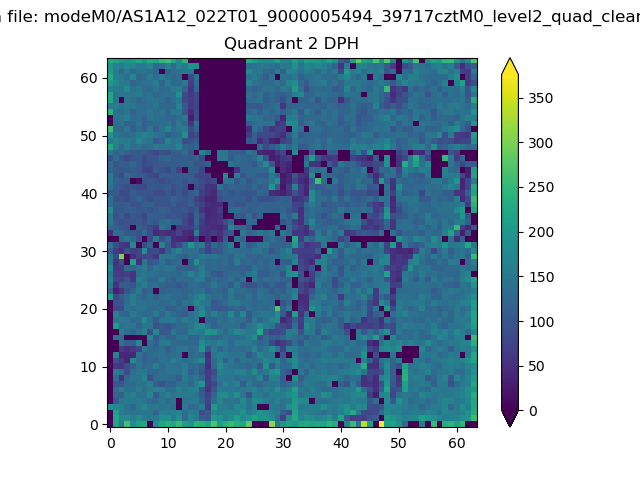
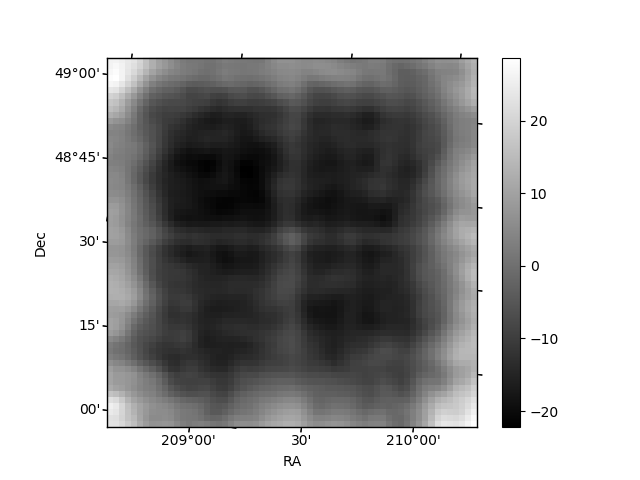
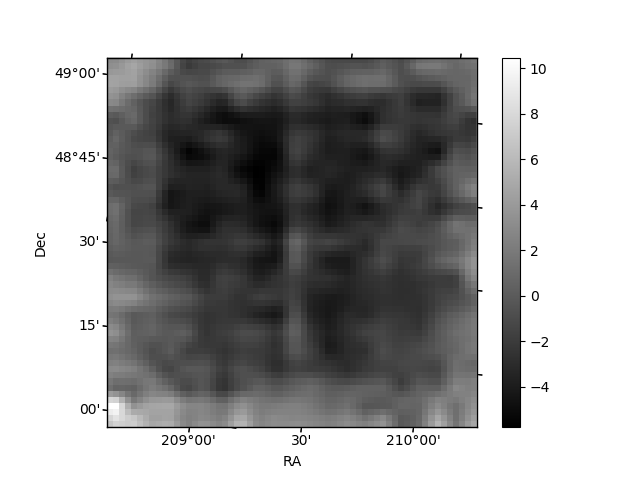
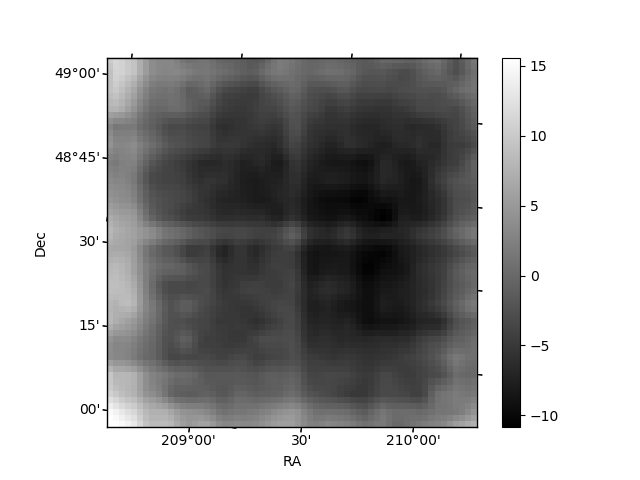
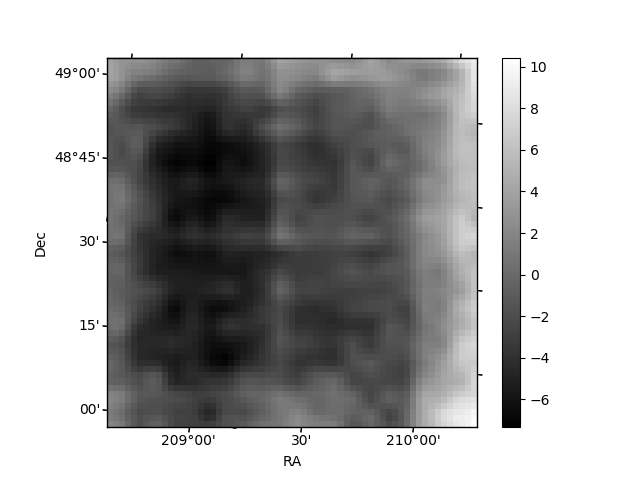
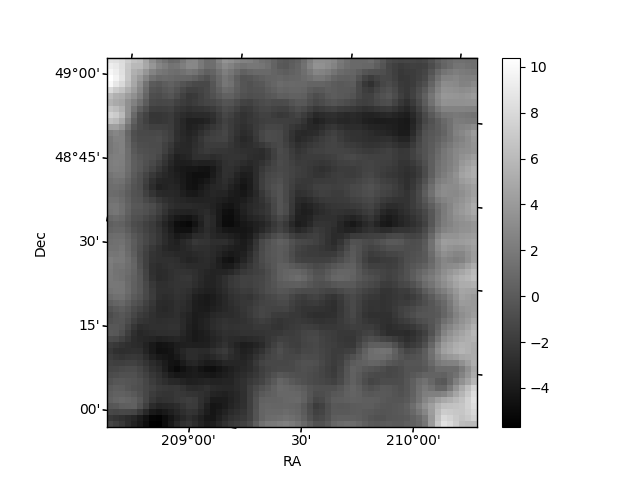
Histogram calculated using DETX and DETY for each event in the final _common_clean file
| Quadrant A | 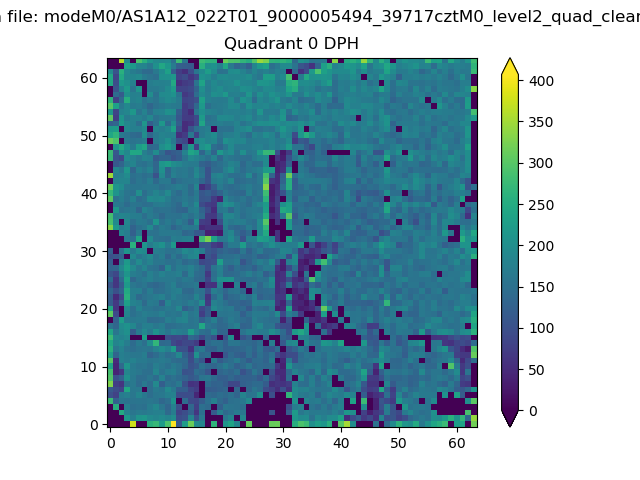 |
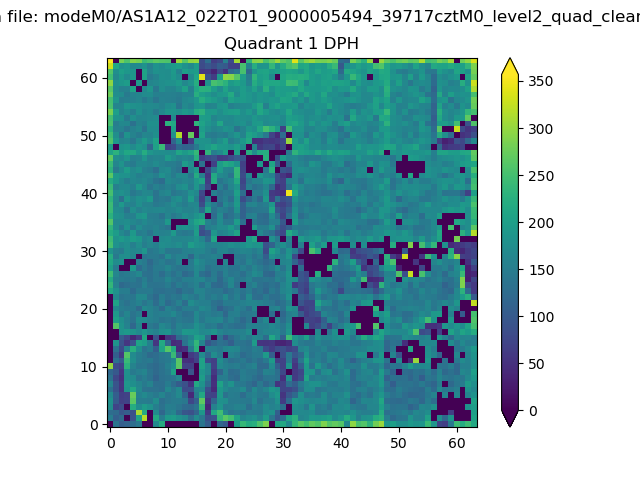 |
Quadrant B |
|---|---|---|---|
| Quadrant D | 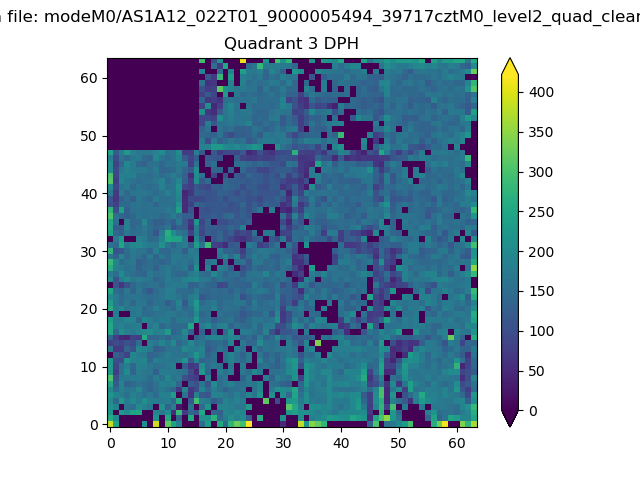 |
 |
Quadrant C |
| Plot type | Count rate plots | Images |
|---|---|---|
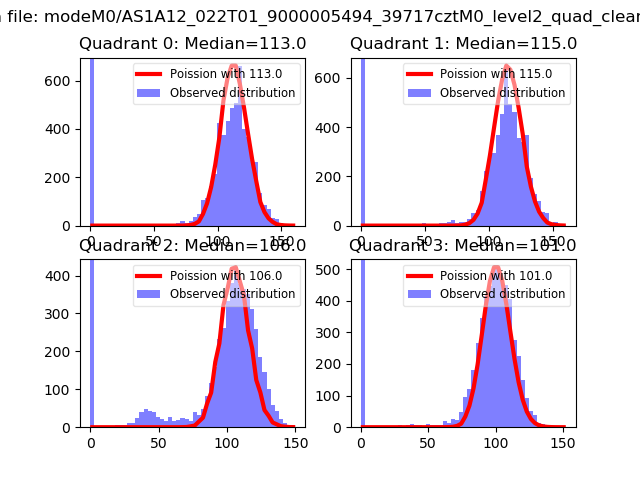
| Comparison with Poisson distribution Blue bars denote a histogram of data divided into 1 sec bins. Red curve is a Poisson curve with rate = median count rate of data. |
 |
 |
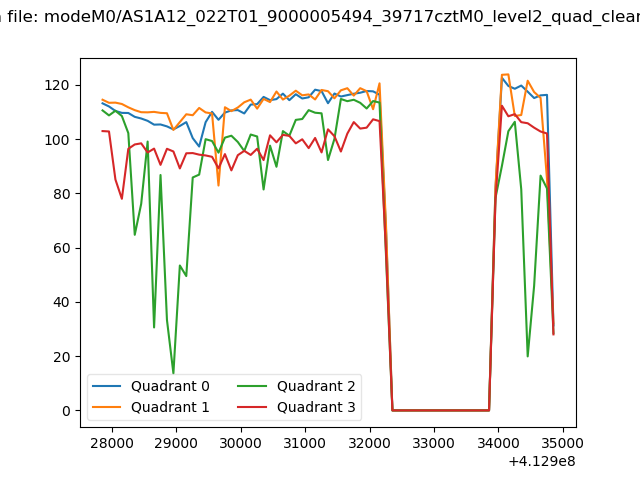
| Quadrant-wise count rates Data is divided into 100 sec bins |
 |
|
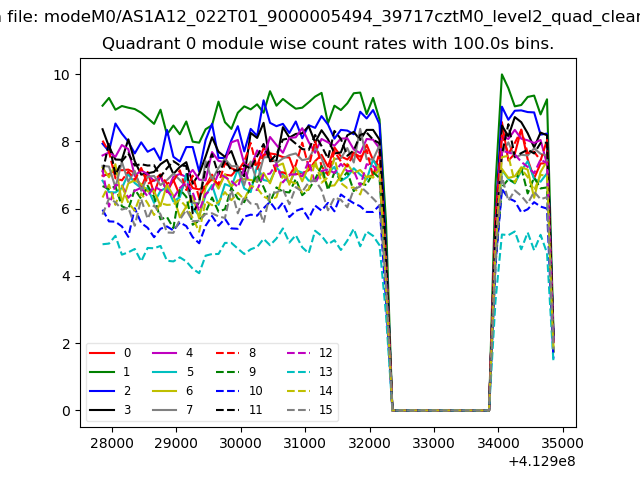
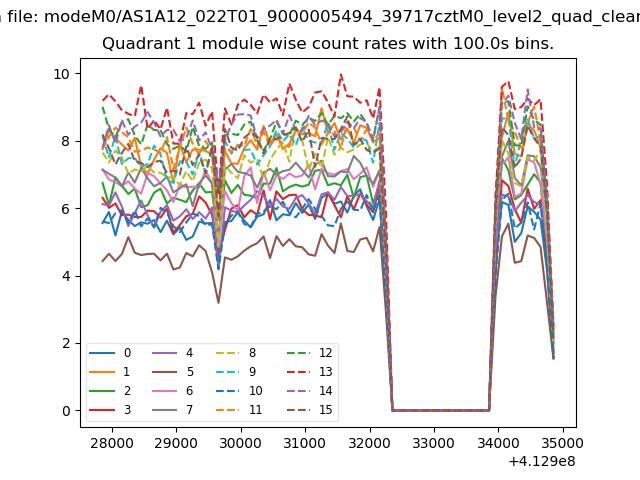
| Module-wise count rates for Quadrant A Data is divided into 100 sec bins |
 |
 |
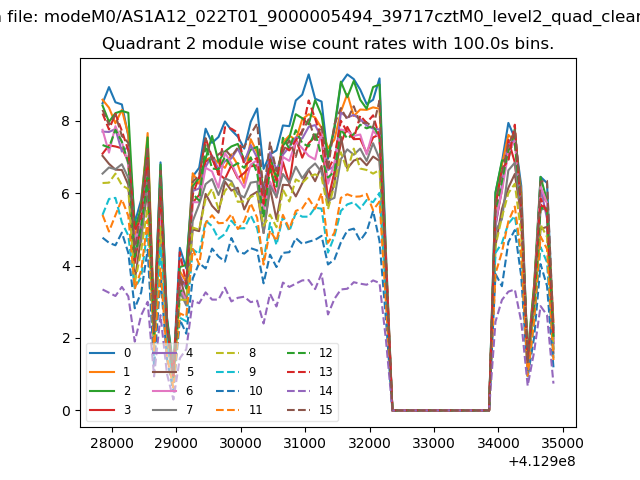
| Module-wise count rates for Quadrant B Data is divided into 100 sec bins |
 |
 |
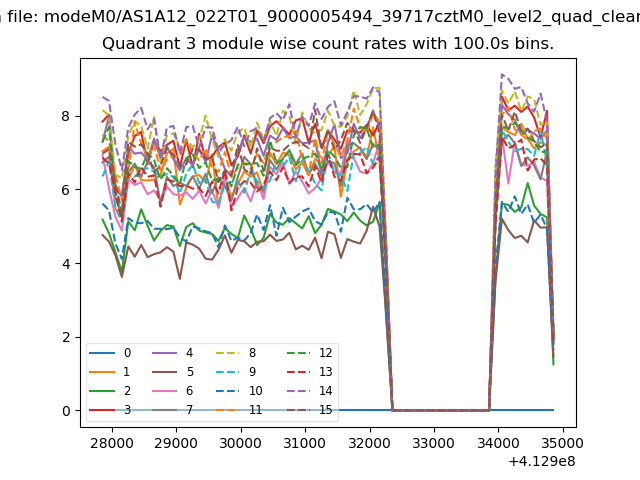
| Module-wise count rates for Quadrant C Data is divided into 100 sec bins |
 |
 |
| Module-wise count rates for Quadrant D Data is divided into 100 sec bins |
 |
 |
| Parameter | Plot |
|---|---|
| CZT HV Monitor |  |
| D_VDD |  |
| Temperature 1 | 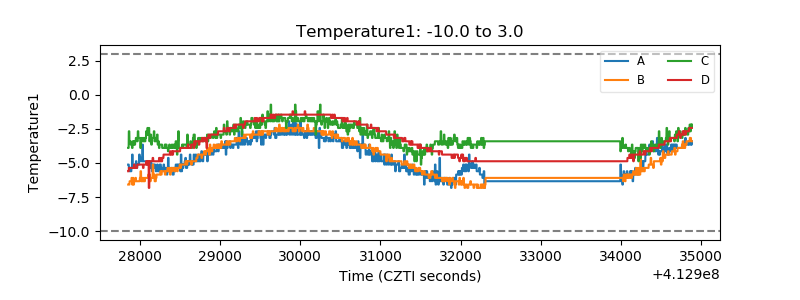 |
| Veto HV Monitor | 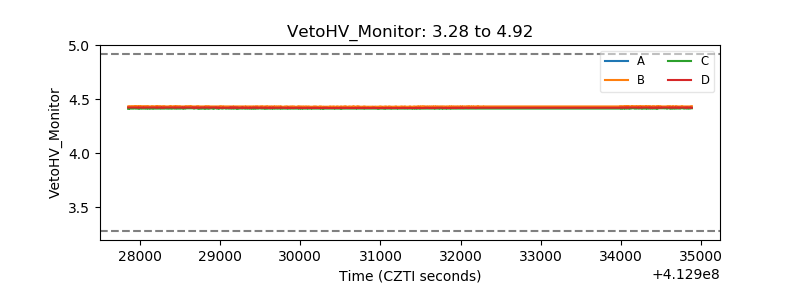 |
| Veto LLD | 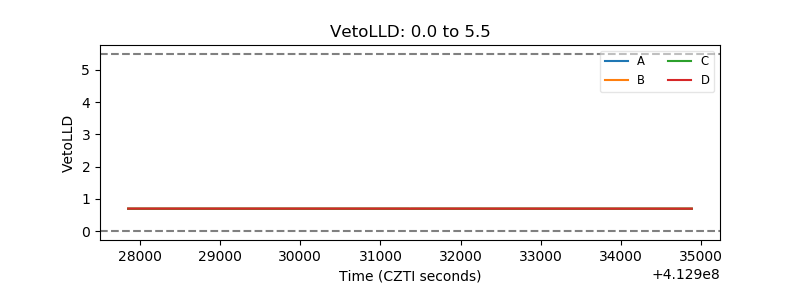 |
| Alpha Counter | 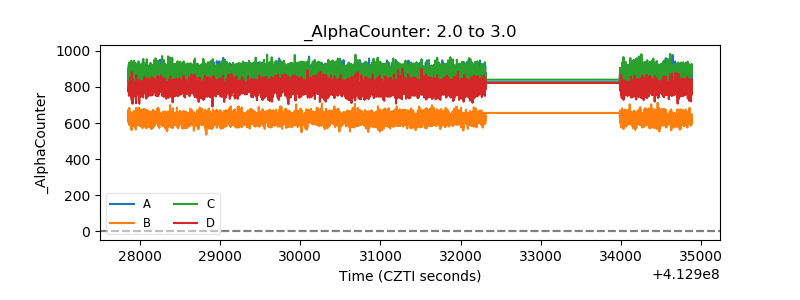 |
| _CPM_Rate | 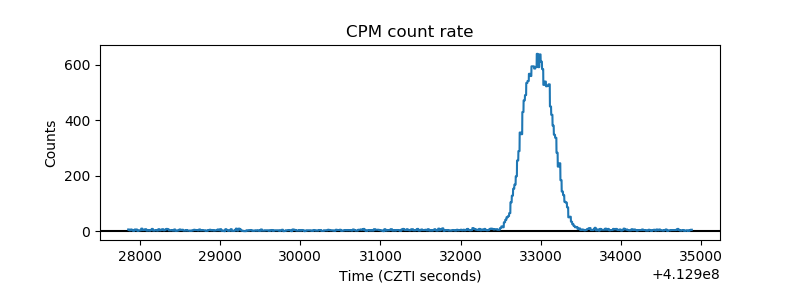 |
| CZT Counter | 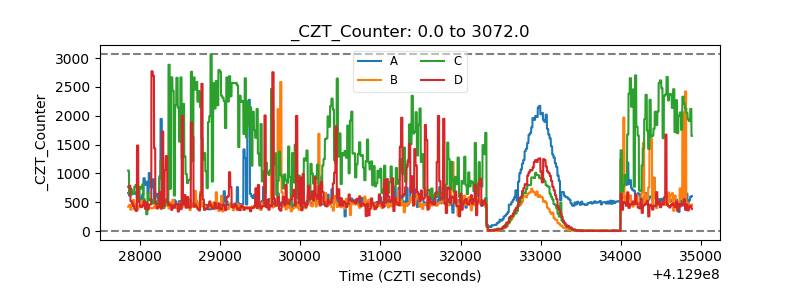 |
| +2.5 Volts monitor | 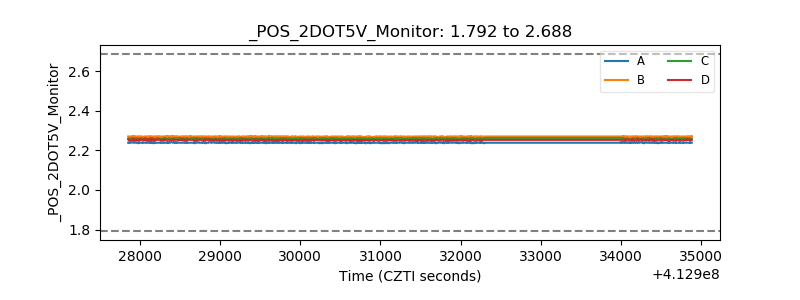 |
| +5 Volts monitor | 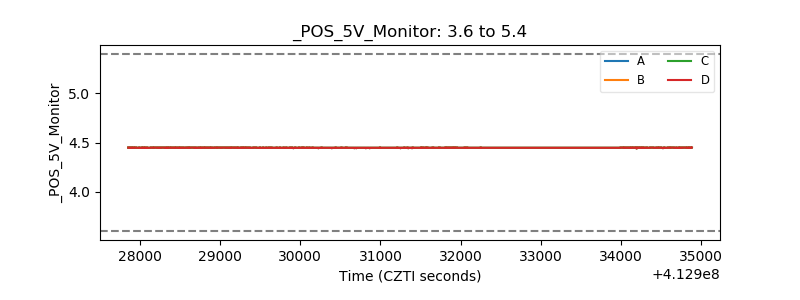 |
| _ROLL_ROT | 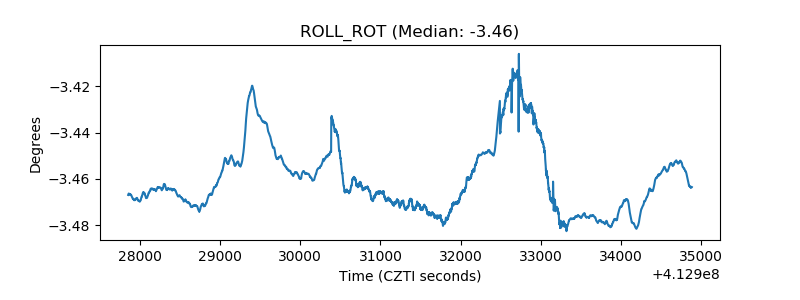 |
| _Roll_DEC | 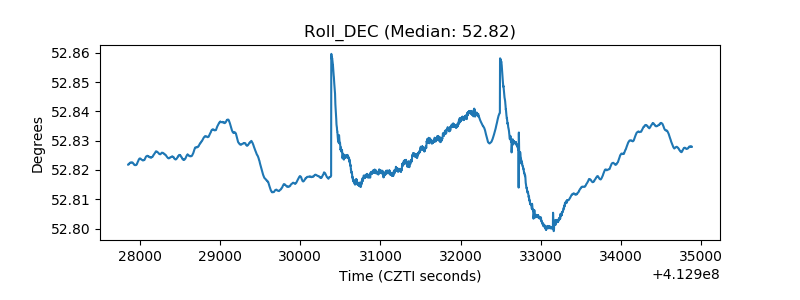 |
| _Roll_RA | 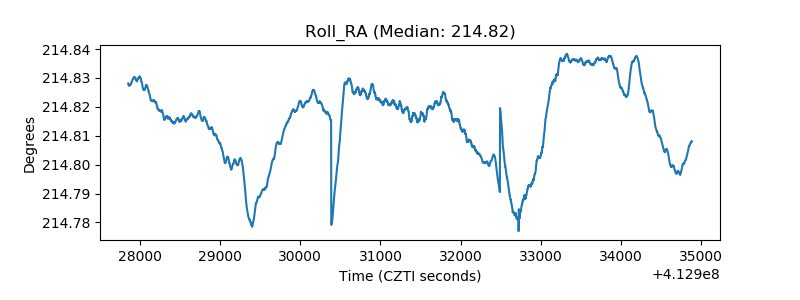 |
| Veto Counter | 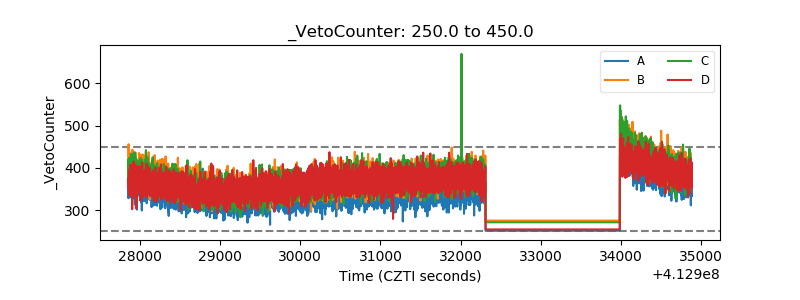 |