| Param | Original file | Final file |
|---|---|---|
| Filename | modeM0/AS1A12_022T01_9000005494_39719cztM0_level2.fits | modeM0/AS1A12_022T01_9000005494_39719cztM0_level2_quad_clean.evt |
| Size (bytes) | 538,773,120 | 83,629,440 |
| Size | 513.8 MB | 79.8 MB |
| Events in quadrant A | 3,003,516 | 632,898 |
| Events in quadrant B | 2,954,378 | 633,189 |
| Events in quadrant C | 9,470,986 | 366,064 |
| Events in quadrant D | 4,099,511 | 525,428 |
| Mode SS | |||
|---|---|---|---|
| Quadrant | BADHDUFLAG | Total packets | Discarded packets |
| A | 0 | 110 | 0 |
| B | 0 | 110 | 0 |
| C | 0 | 110 | 0 |
| D | 0 | 110 | 0 |
| Mode M0 | |||
|---|---|---|---|
| Quadrant | BADHDUFLAG | Total packets | Discarded packets |
| A | 0 | 12093 | 3 |
| B | 0 | 12206 | 2 |
| C | 0 | 31835 | 2 |
| D | 0 | 15706 | 2 |
| Mode M9 | |||
|---|---|---|---|
| Quadrant | BADHDUFLAG | Total packets | Discarded packets |
| A | 0 | 18 | 0 |
| B | 0 | 18 | 0 |
| C | 0 | 18 | 0 |
| D | 0 | 18 | 0 |
| Quadrant | Total seconds | Saturated seconds | Saturation percentage |
|---|---|---|---|
| A | 5345 | 16 | 0.299345% |
| B | 5345 | 126 | 2.357343% |
| C | 5345 | 2382 | 44.565014% |
| D | 5346 | 426 | 7.968575% |
Noise dominated data is calculated using 1-second bins in cleaned event files. If a bin has >2000 counts, and if more than 50% of those come from <1% of pixels, then it is considered to be noise-dominated and hence unusable.
| Quadrant | # 1 sec bins | Bins with >0 counts | Bins with >2000 counts | High rate bins dominated by noise | Noise dominated (total time) | Noise dominated (detector-on time) | Marked lightcurve |
|---|---|---|---|---|---|---|---|
| A | 7139 | 5346 | 7 | 7 | 0.10% | 0.13% | 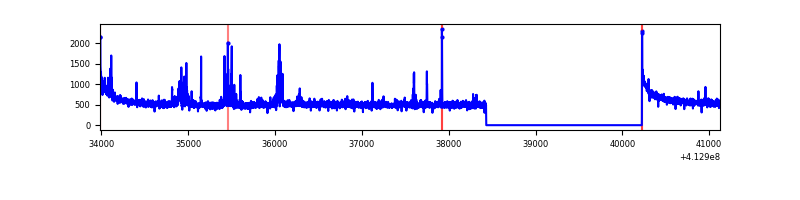 |
| B | 7139 | 5346 | 86 | 86 | 1.20% | 1.61% | 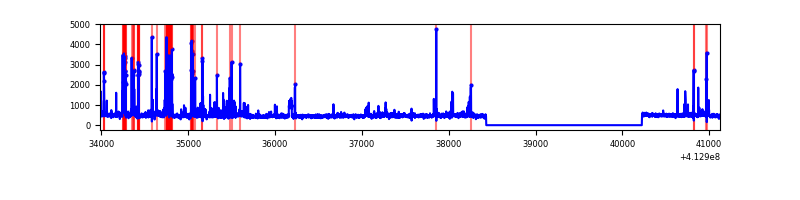 |
| C | 7139 | 5346 | 2086 | 2086 | 29.22% | 39.02% | 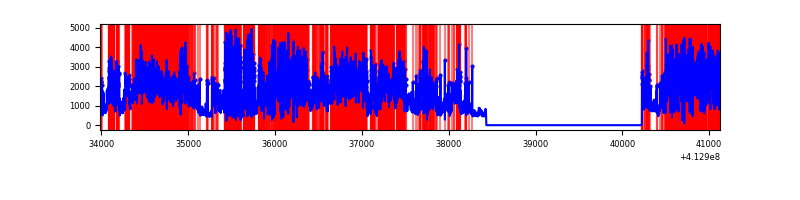 |
| D | 7140 | 5347 | 352 | 352 | 4.93% | 6.58% | 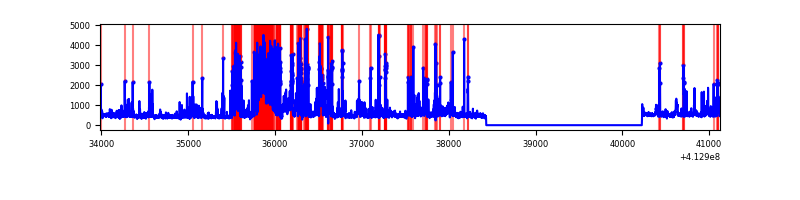 |
Top three noisy pixels from each quadrant. If the there are fewer than three noisy pixels in the level2.evt file, extra rows are filled as -1
| Pixel properties | Quadrant properties | ||||||
|---|---|---|---|---|---|---|---|
| Quadrant | DetID | PixID | Counts | Sigma | Mean | Median | Sigma |
| A | 10 | 83 | 451339 | 3595.18 | 614 | 603 | 125.4 |
| A | 15 | 174 | 165391 | 1314.39 | 614 | 603 | 125.4 |
| A | 13 | 254 | 7822 | 57.58 | 614 | 603 | 125.4 |
| B | 5 | 172 | 318508 | 2739.67 | 598 | 584 | 116.0 |
| B | 5 | 255 | 220303 | 1893.4 | 598 | 584 | 116.0 |
| B | 0 | 190 | 40680 | 345.52 | 598 | 584 | 116.0 |
| C | 9 | 187 | 5901238 | 52957.81 | 475 | 476 | 111.4 |
| C | 15 | 208 | 844233 | 7572.5 | 475 | 476 | 111.4 |
| C | 14 | 254 | 661012 | 5928.14 | 475 | 476 | 111.4 |
| D | 12 | 227 | 1268733 | 8963.65 | 578 | 561 | 141.5 |
| D | 12 | 233 | 262003 | 1847.91 | 578 | 561 | 141.5 |
| D | 2 | 250 | 178768 | 1259.59 | 578 | 561 | 141.5 |
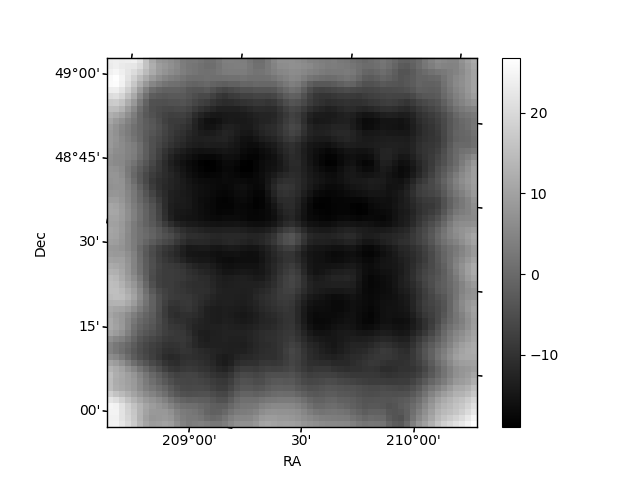
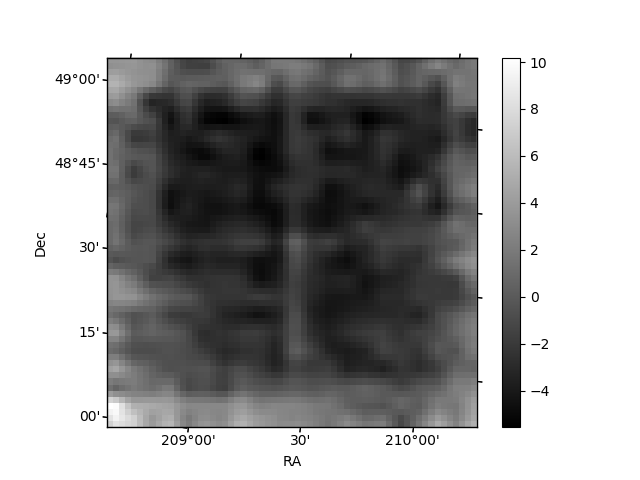
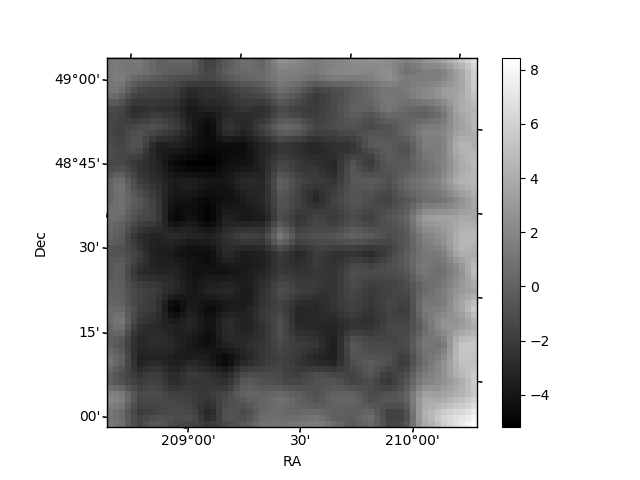
Histogram calculated using DETX and DETY for each event in the final _common_clean file
| Quadrant A | 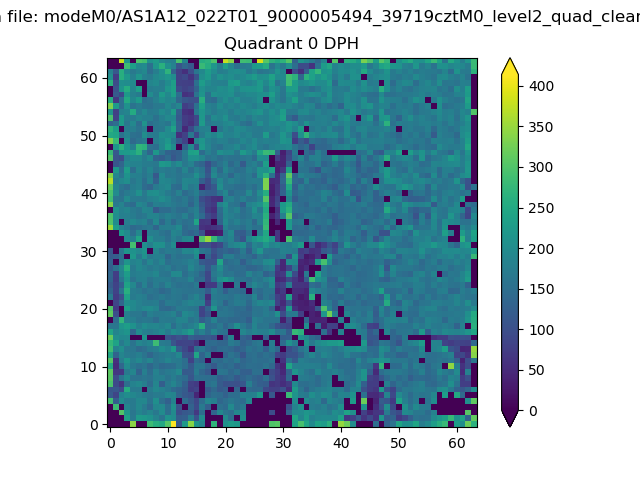 |
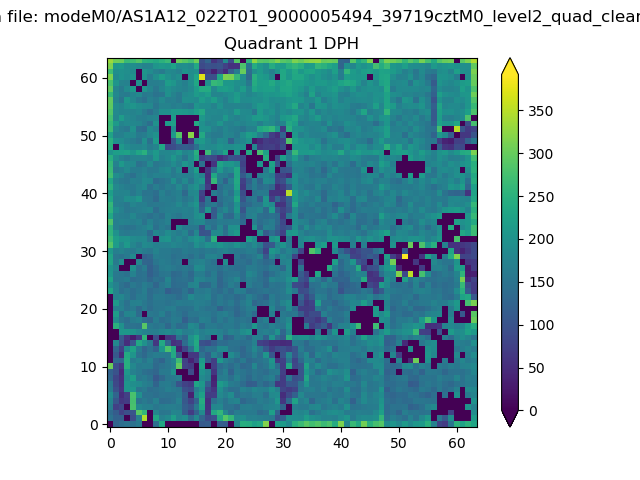 |
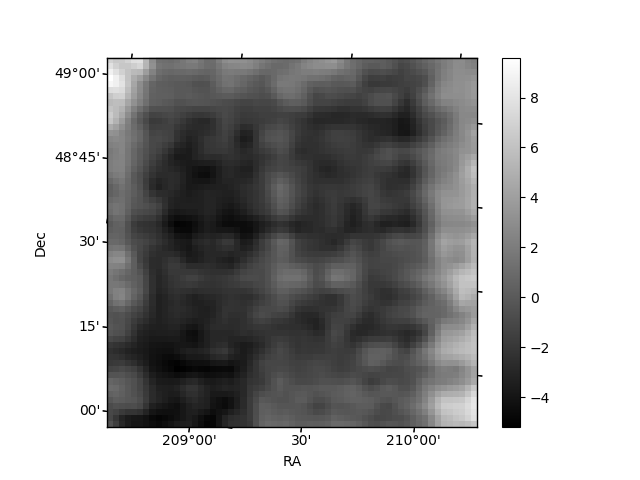
Quadrant B |
|---|---|---|---|
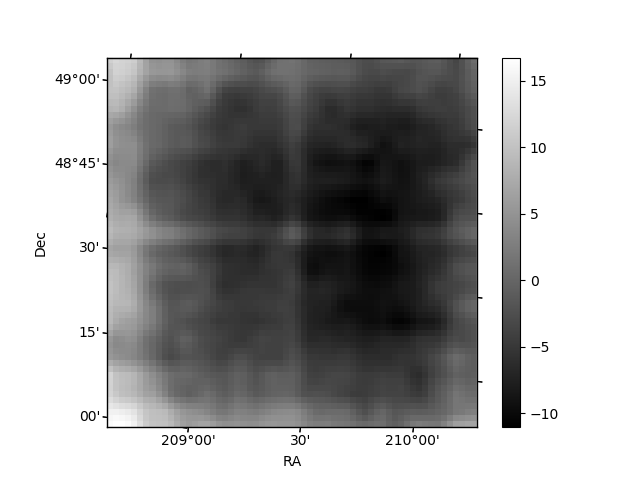
| Quadrant D | 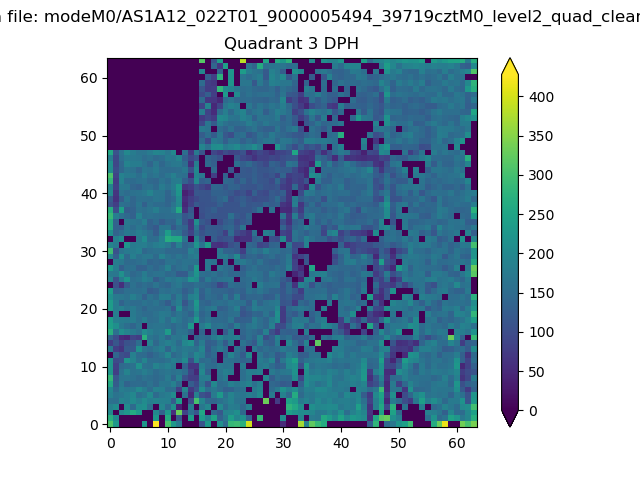 |
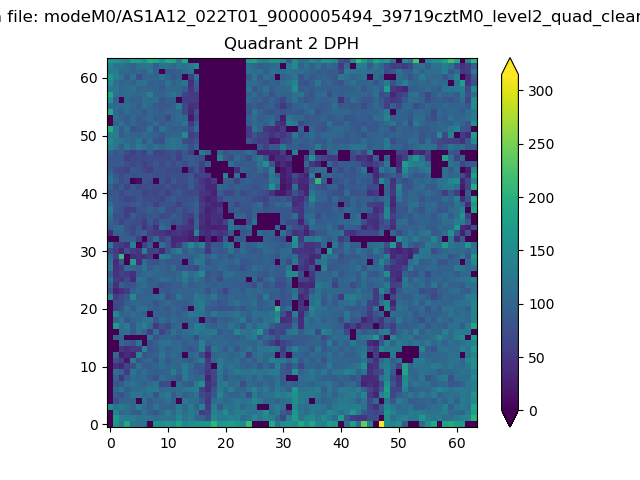 |
Quadrant C |
| Plot type | Count rate plots | Images |
|---|---|---|
| Comparison with Poisson distribution Blue bars denote a histogram of data divided into 1 sec bins. Red curve is a Poisson curve with rate = median count rate of data. |
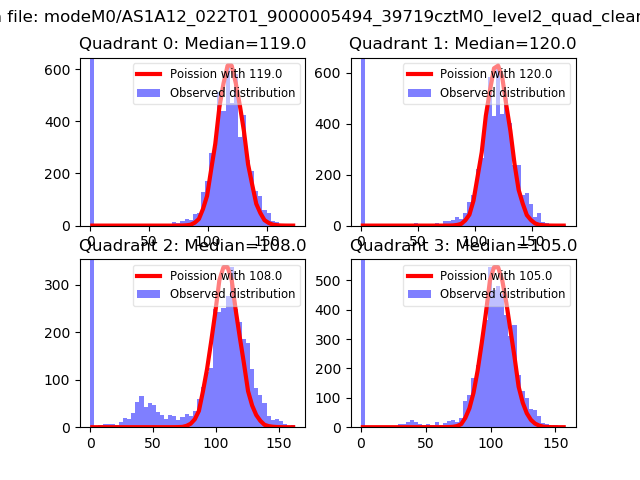 |
 |
| Quadrant-wise count rates Data is divided into 100 sec bins |
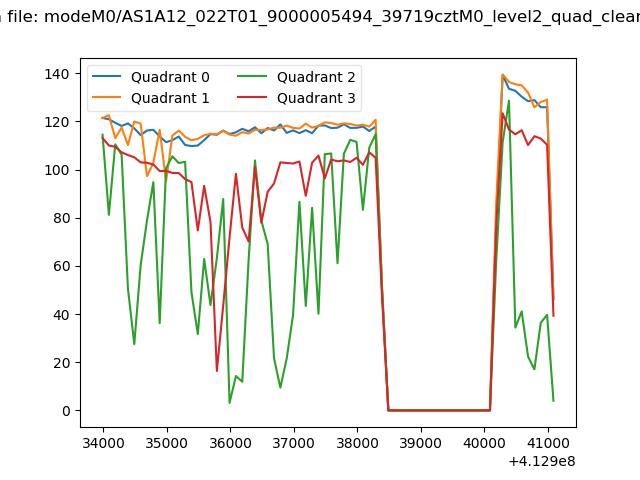 |
|
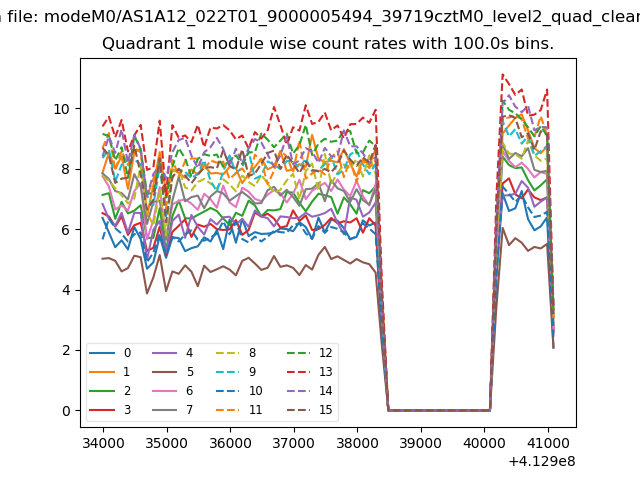
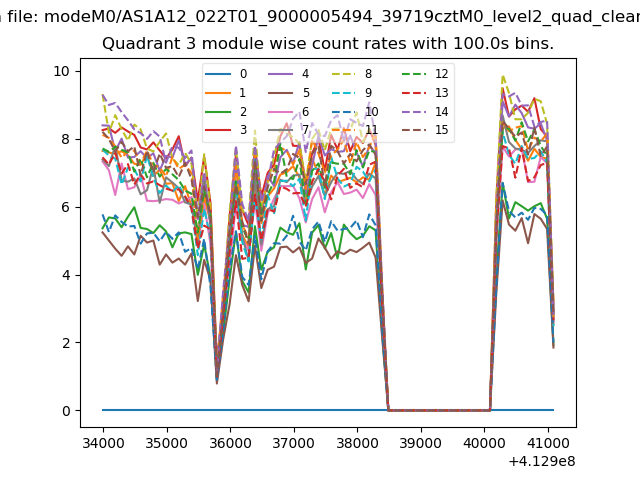
| Module-wise count rates for Quadrant A Data is divided into 100 sec bins |
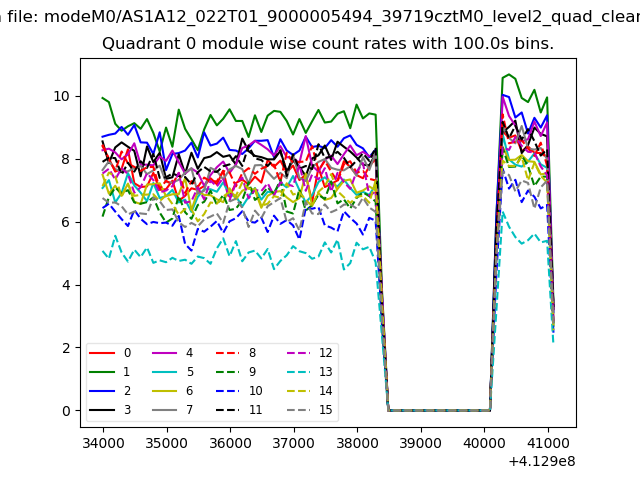 |
 |
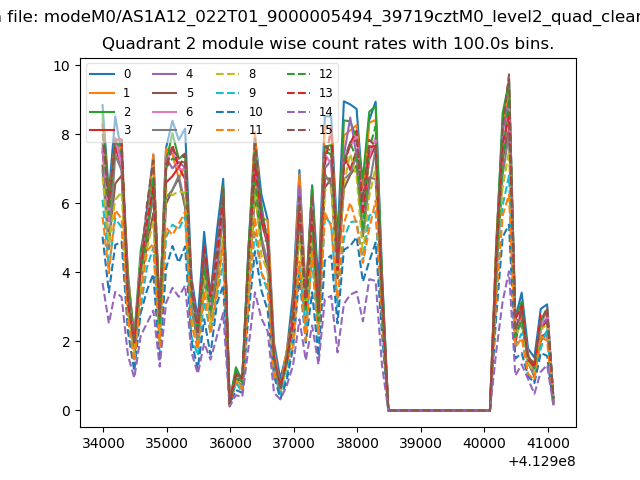
| Module-wise count rates for Quadrant B Data is divided into 100 sec bins |
 |
 |
| Module-wise count rates for Quadrant C Data is divided into 100 sec bins |
 |
 |
| Module-wise count rates for Quadrant D Data is divided into 100 sec bins |
 |
 |
| Parameter | Plot |
|---|---|
| CZT HV Monitor | 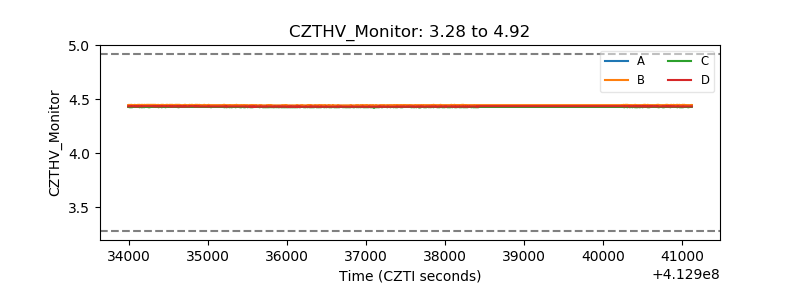 |
| D_VDD | 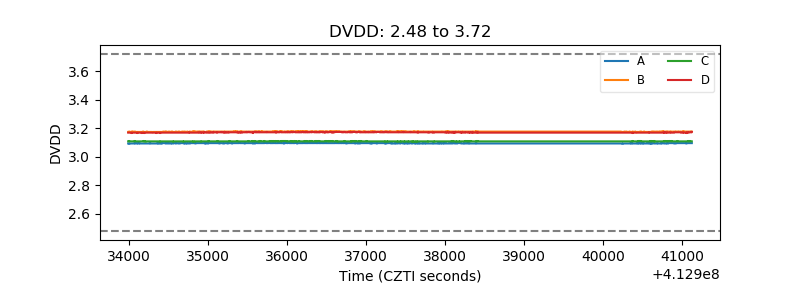 |
| Temperature 1 | 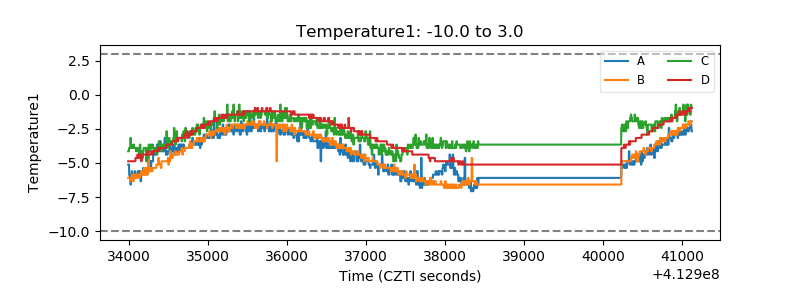 |
| Veto HV Monitor | 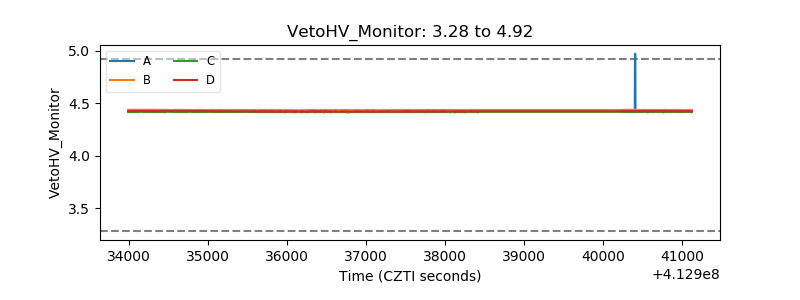 |
| Veto LLD | 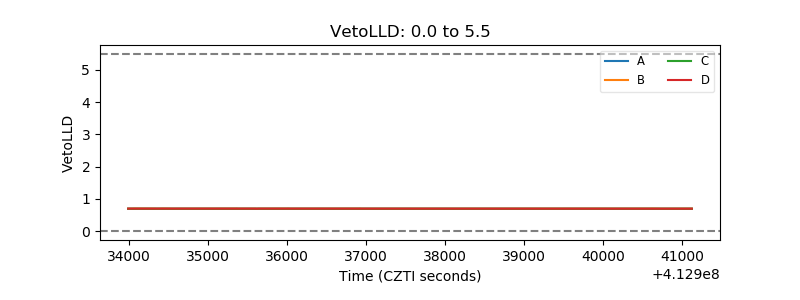 |
| Alpha Counter | 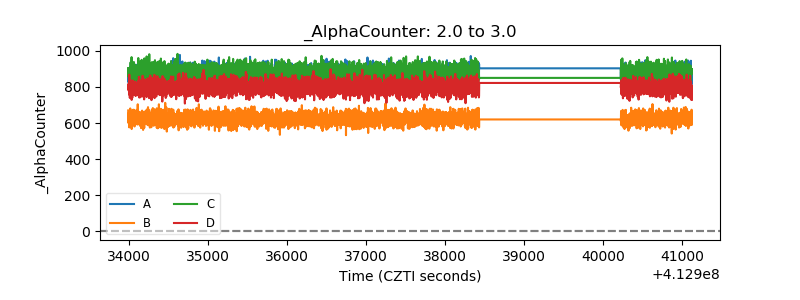 |
| _CPM_Rate | 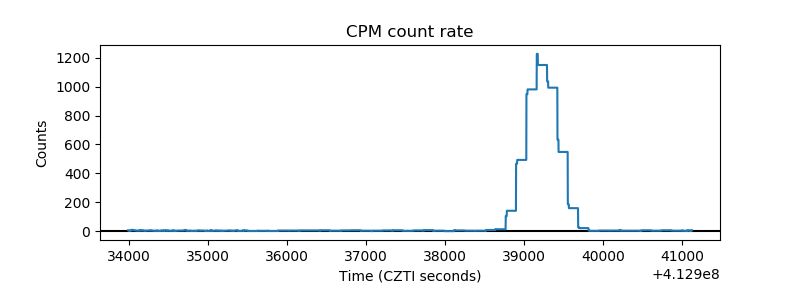 |
| CZT Counter | 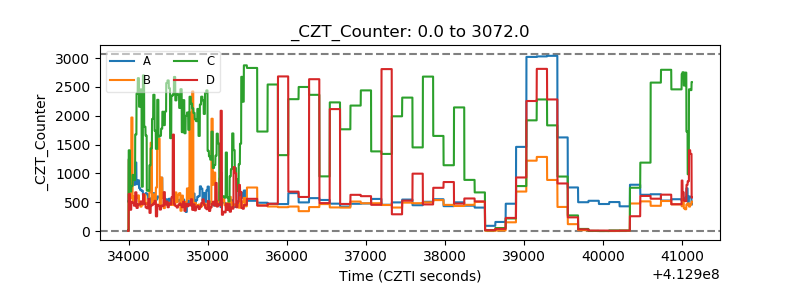 |
| +2.5 Volts monitor | 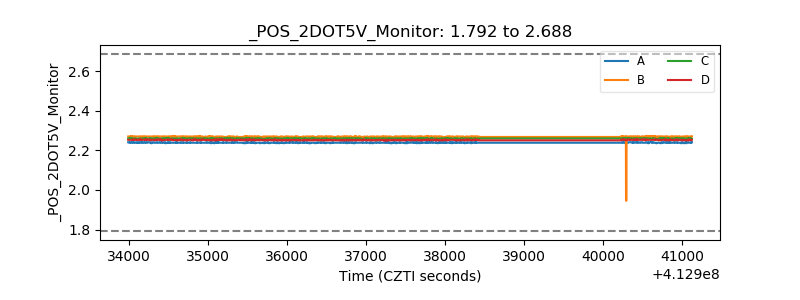 |
| +5 Volts monitor | 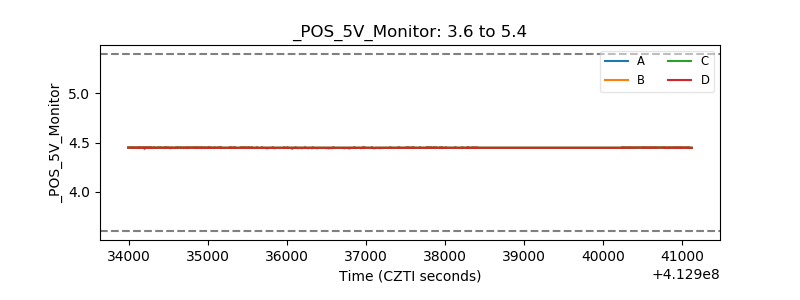 |
| _ROLL_ROT | 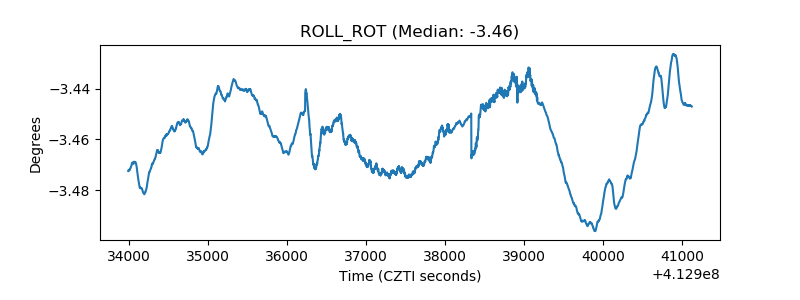 |
| _Roll_DEC | 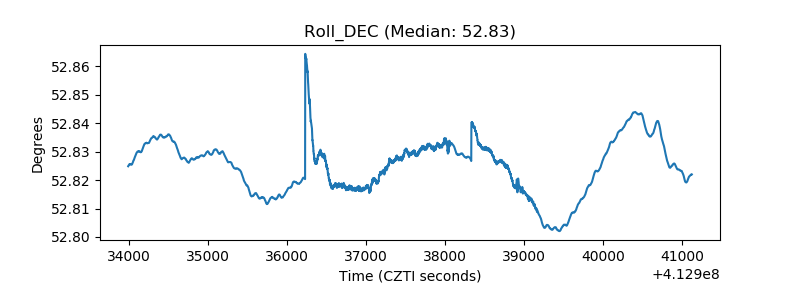 |
| _Roll_RA | 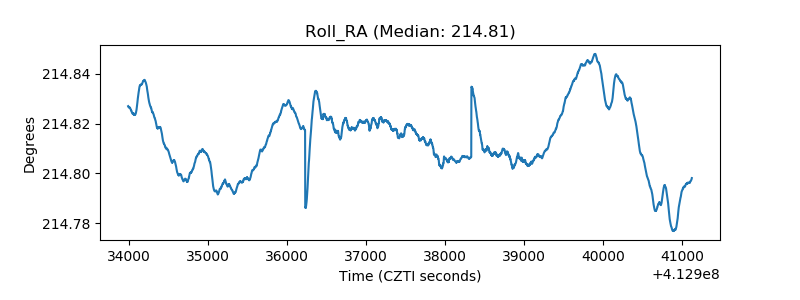 |
| Veto Counter |  |