| Param | Original file | Final file |
|---|---|---|
| Filename | modeM0/AS1A12_022T01_9000005494_39720cztM0_level2.fits | modeM0/AS1A12_022T01_9000005494_39720cztM0_level2_quad_clean.evt |
| Size (bytes) | 1,215,374,400 | 214,617,600 |
| Size | 1.1 GB | 204.7 MB |
| Events in quadrant A | 7,979,608 | 1,545,899 |
| Events in quadrant B | 7,175,832 | 1,572,629 |
| Events in quadrant C | 18,916,456 | 1,127,117 |
| Events in quadrant D | 9,884,792 | 1,328,951 |
| Mode SS | |||
|---|---|---|---|
| Quadrant | BADHDUFLAG | Total packets | Discarded packets |
| A | 0 | 274 | 0 |
| B | 0 | 274 | 0 |
| C | 0 | 274 | 0 |
| D | 0 | 274 | 0 |
| Mode M0 | |||
|---|---|---|---|
| Quadrant | BADHDUFLAG | Total packets | Discarded packets |
| A | 0 | 31629 | 4 |
| B | 0 | 30014 | 3 |
| C | 0 | 65483 | 3 |
| D | 0 | 38262 | 3 |
| Mode M9 | |||
|---|---|---|---|
| Quadrant | BADHDUFLAG | Total packets | Discarded packets |
| A | 0 | 54 | 0 |
| B | 0 | 54 | 0 |
| C | 0 | 54 | 0 |
| D | 0 | 54 | 0 |
| Quadrant | Total seconds | Saturated seconds | Saturation percentage |
|---|---|---|---|
| A | 13364 | 314 | 2.349596% |
| B | 13364 | 308 | 2.304699% |
| C | 13364 | 3710 | 27.761149% |
| D | 13364 | 790 | 5.911404% |
Noise dominated data is calculated using 1-second bins in cleaned event files. If a bin has >2000 counts, and if more than 50% of those come from <1% of pixels, then it is considered to be noise-dominated and hence unusable.
| Quadrant | # 1 sec bins | Bins with >0 counts | Bins with >2000 counts | High rate bins dominated by noise | Noise dominated (total time) | Noise dominated (detector-on time) | Marked lightcurve |
|---|---|---|---|---|---|---|---|
| A | 18745 | 13367 | 201 | 201 | 1.07% | 1.50% | 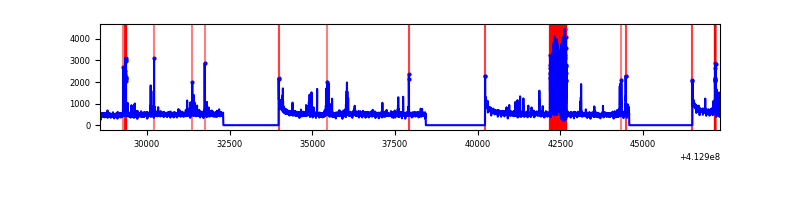 |
| B | 18745 | 13367 | 215 | 215 | 1.15% | 1.61% | 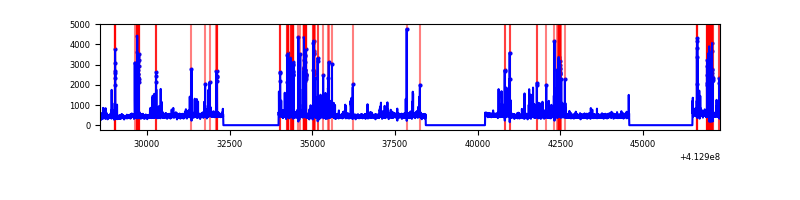 |
| C | 18745 | 13367 | 3315 | 3315 | 17.68% | 24.80% | 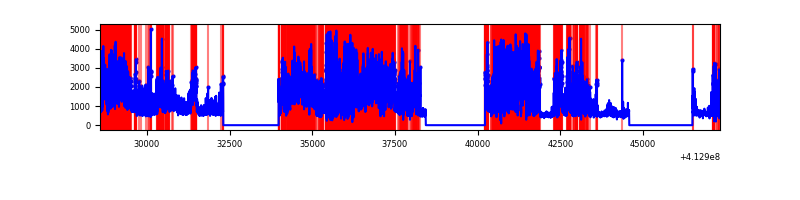 |
| D | 18745 | 13367 | 673 | 673 | 3.59% | 5.03% | 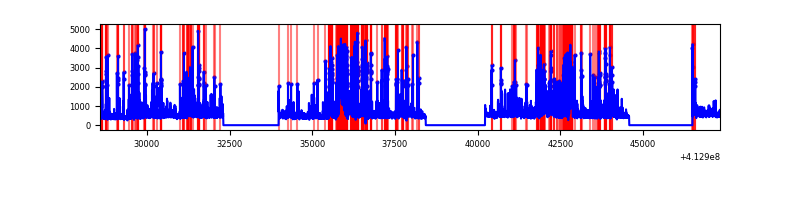 |
Top three noisy pixels from each quadrant. If the there are fewer than three noisy pixels in the level2.evt file, extra rows are filled as -1
| Pixel properties | Quadrant properties | ||||||
|---|---|---|---|---|---|---|---|
| Quadrant | DetID | PixID | Counts | Sigma | Mean | Median | Sigma |
| A | 10 | 83 | 953922 | 3096.29 | 1526 | 1495 | 307.6 |
| A | 13 | 248 | 648213 | 2102.45 | 1526 | 1495 | 307.6 |
| A | 15 | 174 | 445136 | 1442.25 | 1526 | 1495 | 307.6 |
| B | 5 | 255 | 608143 | 2105.35 | 1499 | 1459 | 288.2 |
| B | 5 | 172 | 497261 | 1720.56 | 1499 | 1459 | 288.2 |
| B | 0 | 190 | 100913 | 345.13 | 1499 | 1459 | 288.2 |
| C | 9 | 187 | 10467080 | 34400.55 | 1317 | 1325 | 304.2 |
| C | 15 | 208 | 1623257 | 5331.23 | 1317 | 1325 | 304.2 |
| C | 14 | 254 | 1038250 | 3408.33 | 1317 | 1325 | 304.2 |
| D | 12 | 227 | 2580849 | 7222.98 | 1467 | 1425 | 357.1 |
| D | 12 | 233 | 692673 | 1935.65 | 1467 | 1425 | 357.1 |
| D | 2 | 250 | 438441 | 1223.75 | 1467 | 1425 | 357.1 |
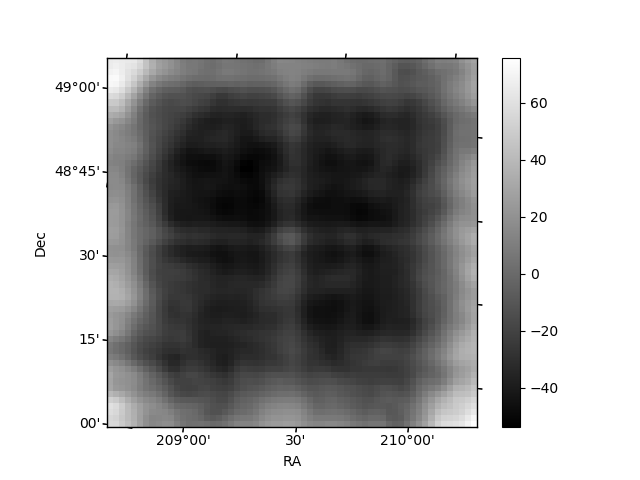
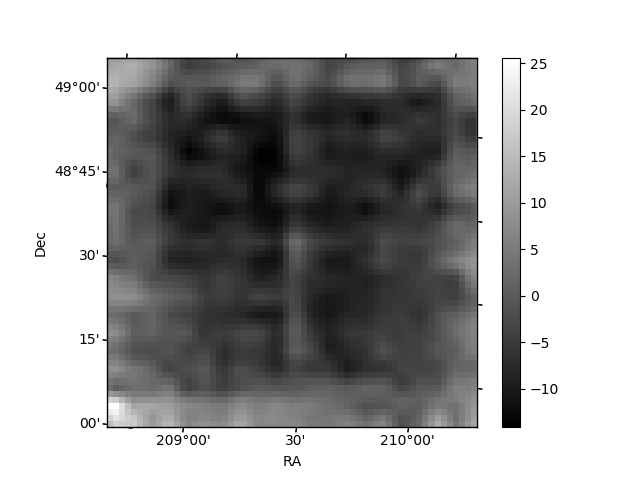
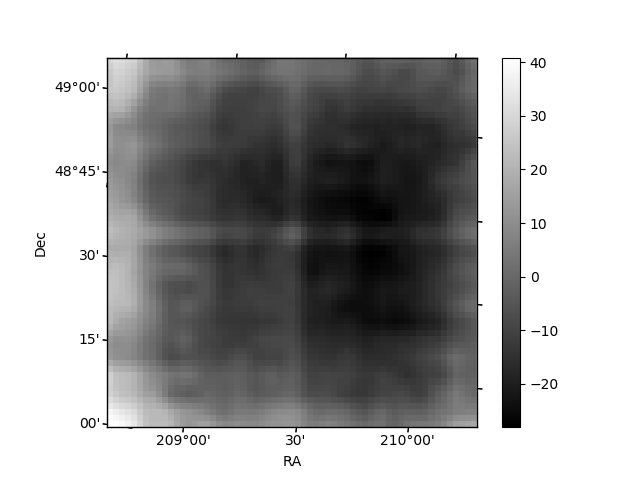
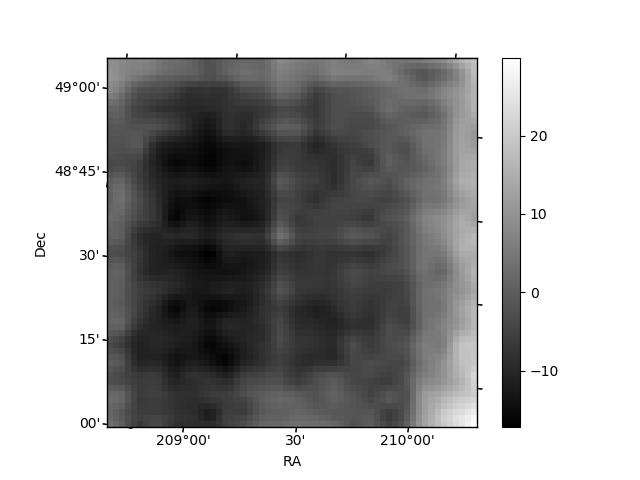
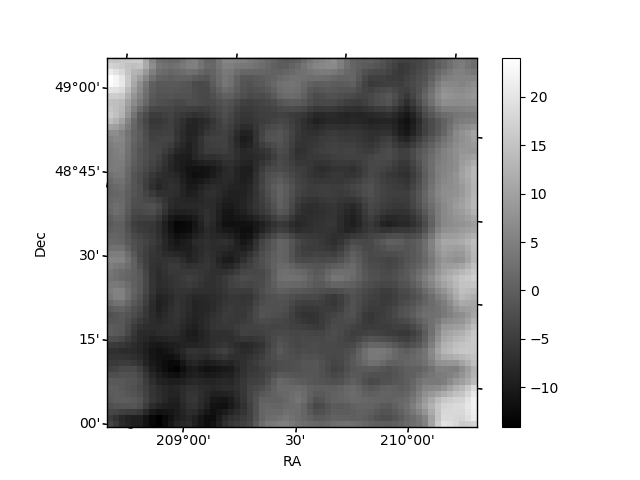
Histogram calculated using DETX and DETY for each event in the final _common_clean file
| Quadrant A | 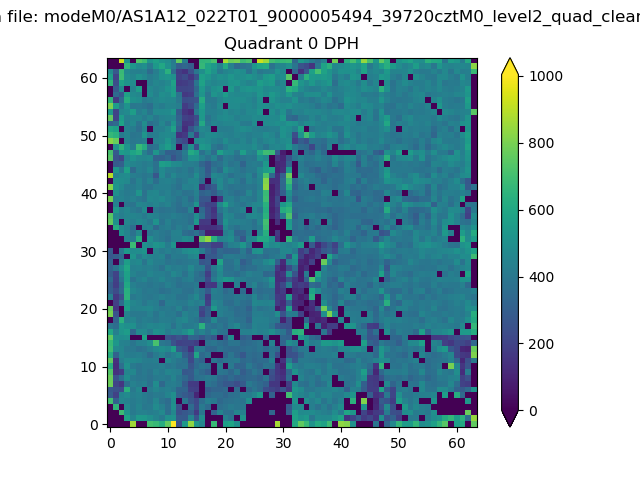 |
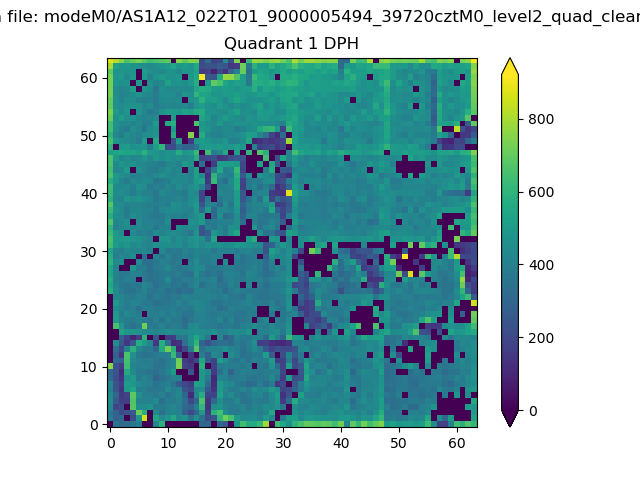 |
Quadrant B |
|---|---|---|---|
| Quadrant D | 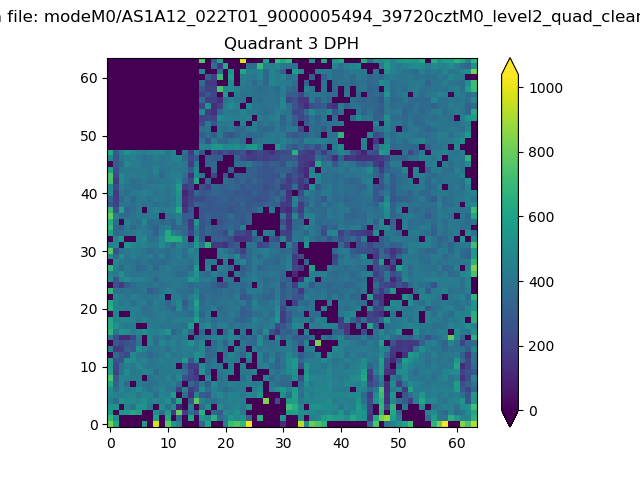 |
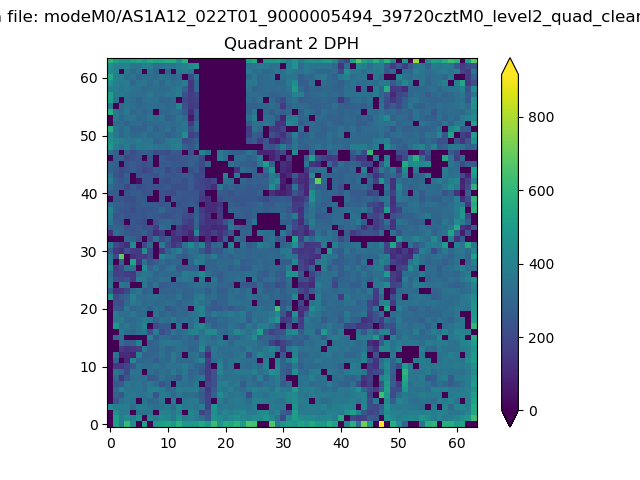 |
Quadrant C |
| Plot type | Count rate plots | Images |
|---|---|---|
| Comparison with Poisson distribution Blue bars denote a histogram of data divided into 1 sec bins. Red curve is a Poisson curve with rate = median count rate of data. |
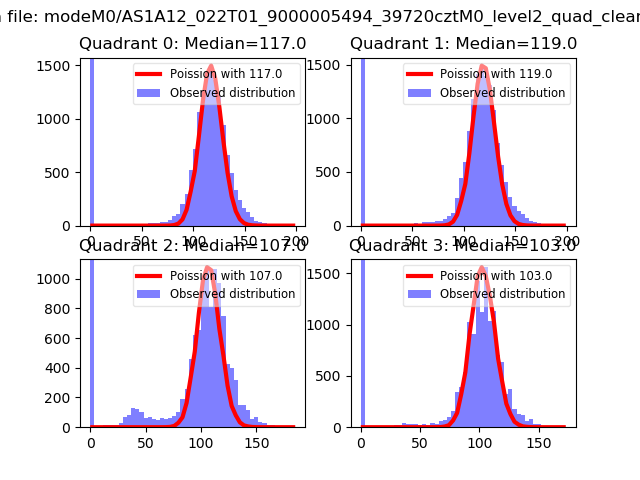 |
 |
| Quadrant-wise count rates Data is divided into 100 sec bins |
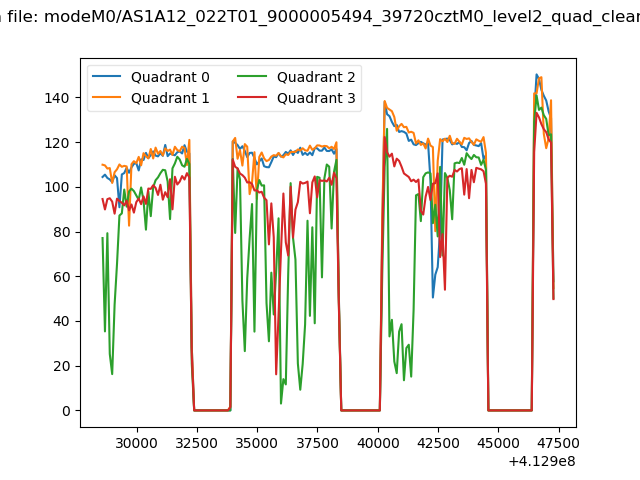 |
|
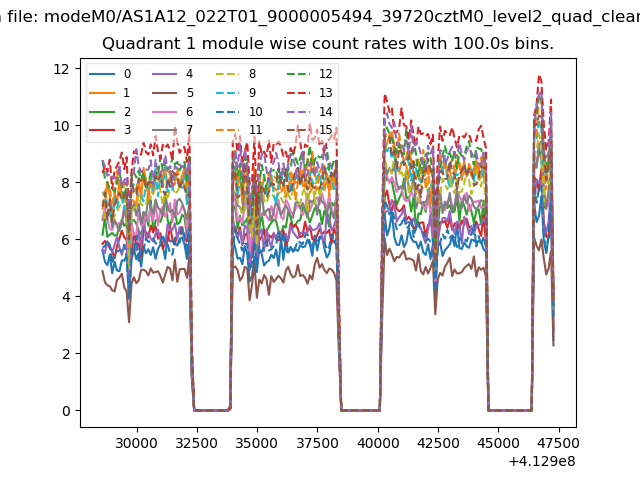
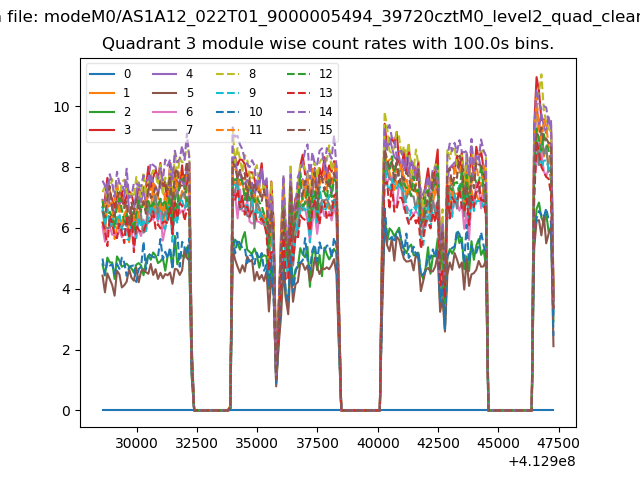
| Module-wise count rates for Quadrant A Data is divided into 100 sec bins |
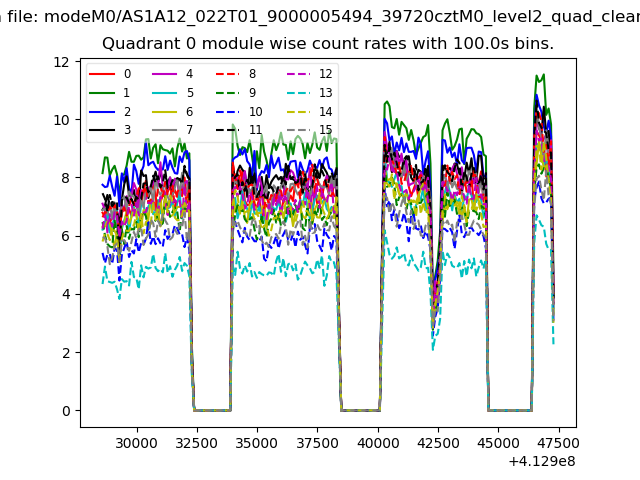 |
 |
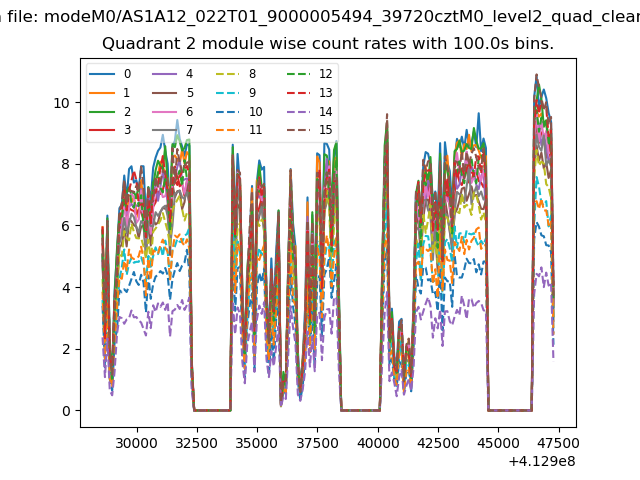
| Module-wise count rates for Quadrant B Data is divided into 100 sec bins |
 |
 |
| Module-wise count rates for Quadrant C Data is divided into 100 sec bins |
 |
 |
| Module-wise count rates for Quadrant D Data is divided into 100 sec bins |
 |
 |
| Parameter | Plot |
|---|---|
| CZT HV Monitor | 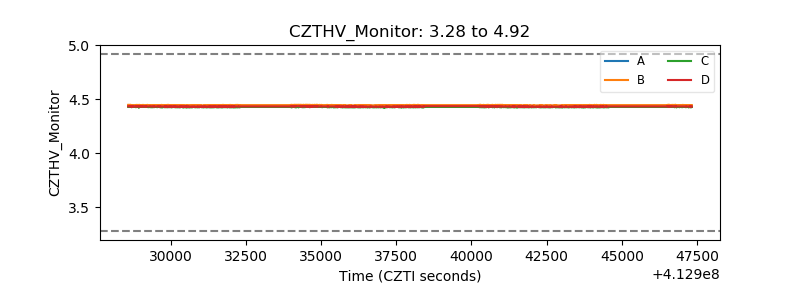 |
| D_VDD | 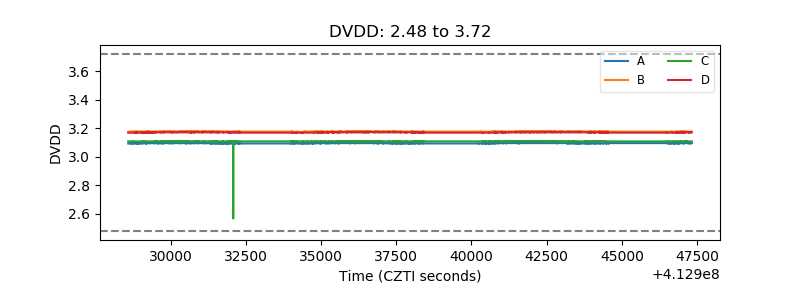 |
| Temperature 1 | 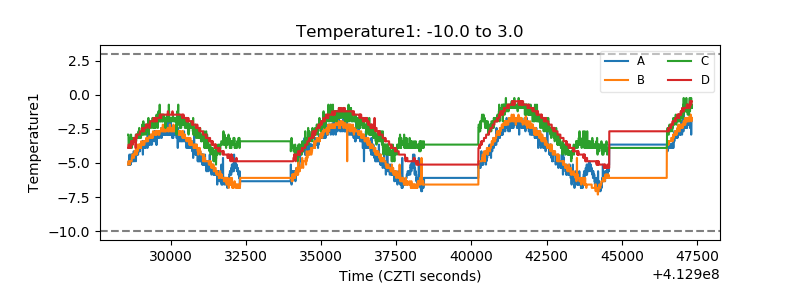 |
| Veto HV Monitor | 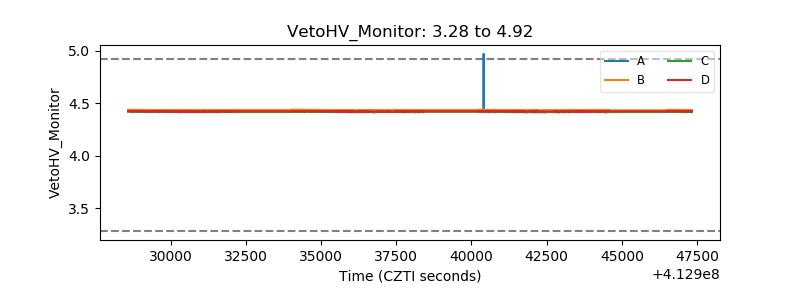 |
| Veto LLD | 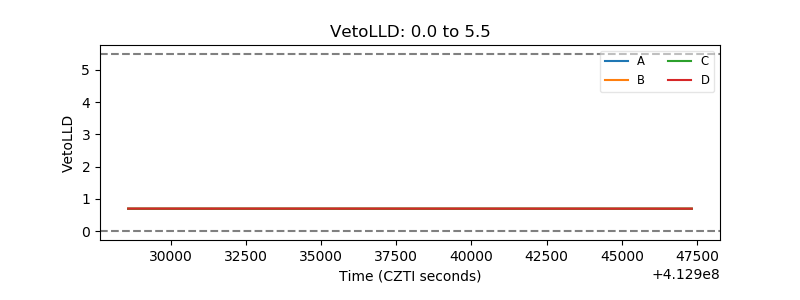 |
| Alpha Counter | 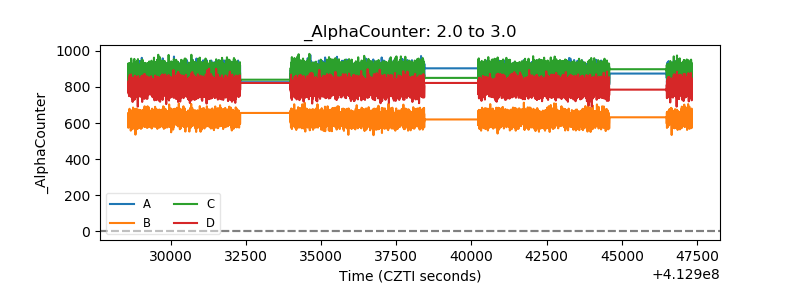 |
| _CPM_Rate | 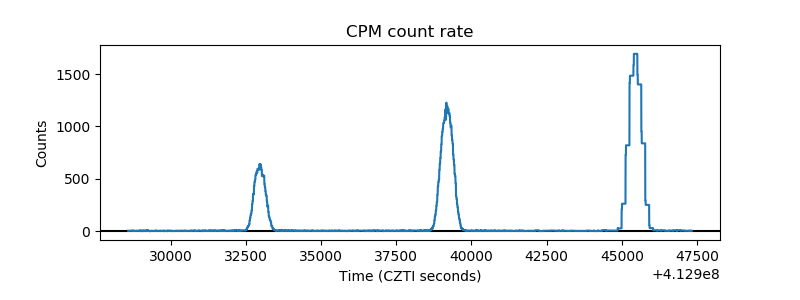 |
| CZT Counter | 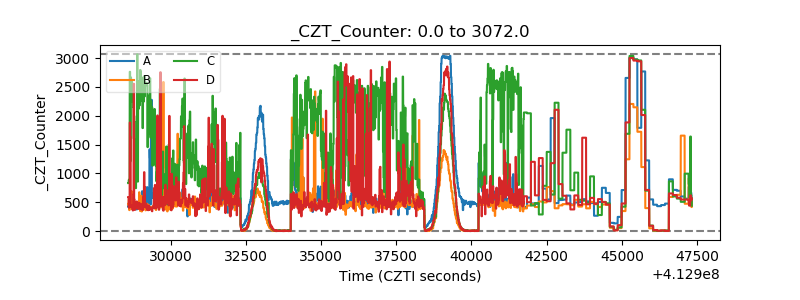 |
| +2.5 Volts monitor | 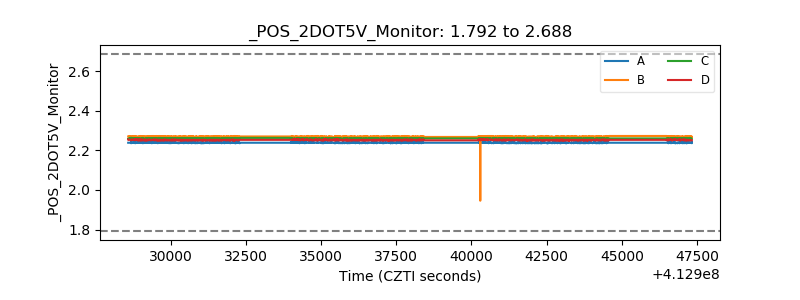 |
| +5 Volts monitor |  |
| _ROLL_ROT | 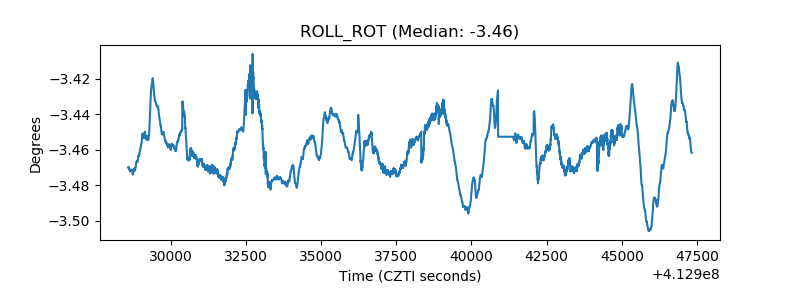 |
| _Roll_DEC | 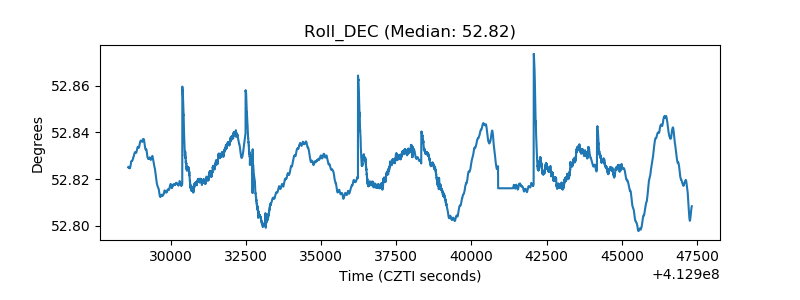 |
| _Roll_RA | 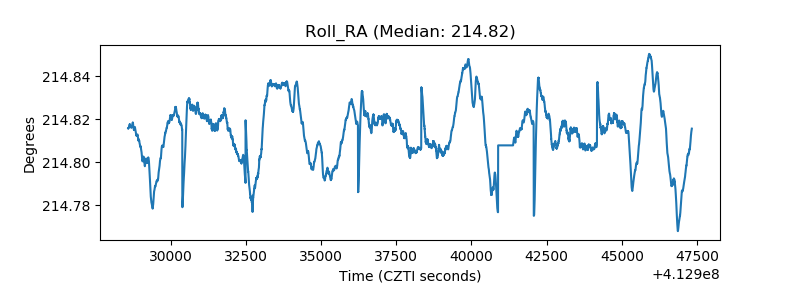 |
| Veto Counter | 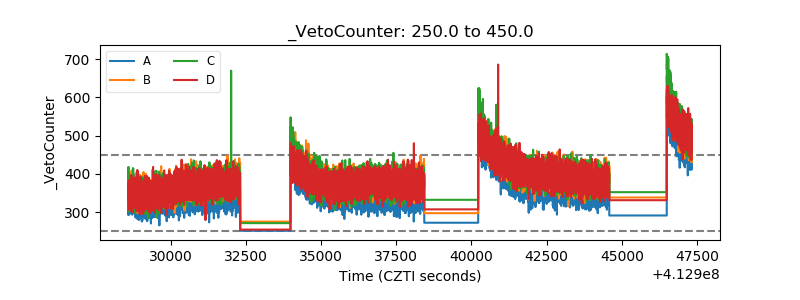 |