| Param | Original file | Final file |
|---|---|---|
| Filename | modeM0/AS1A12_022T01_9000005494_39721cztM0_level2.fits | modeM0/AS1A12_022T01_9000005494_39721cztM0_level2_quad_clean.evt |
| Size (bytes) | 373,337,280 | 102,196,800 |
| Size | 356.0 MB | 97.5 MB |
| Events in quadrant A | 3,501,765 | 708,905 |
| Events in quadrant B | 2,906,572 | 715,802 |
| Events in quadrant C | 3,261,201 | 675,118 |
| Events in quadrant D | 3,734,505 | 620,576 |
| Mode SS | |||
|---|---|---|---|
| Quadrant | BADHDUFLAG | Total packets | Discarded packets |
| A | 0 | 110 | 0 |
| B | 0 | 110 | 0 |
| C | 0 | 110 | 0 |
| D | 0 | 110 | 0 |
| Mode M0 | |||
|---|---|---|---|
| Quadrant | BADHDUFLAG | Total packets | Discarded packets |
| A | 0 | 13845 | 3 |
| B | 0 | 11913 | 2 |
| C | 0 | 13096 | 2 |
| D | 0 | 14565 | 2 |
| Mode M9 | |||
|---|---|---|---|
| Quadrant | BADHDUFLAG | Total packets | Discarded packets |
| A | 0 | 22 | 0 |
| B | 0 | 22 | 0 |
| C | 0 | 22 | 0 |
| D | 0 | 23 | 0 |
| Quadrant | Total seconds | Saturated seconds | Saturation percentage |
|---|---|---|---|
| A | 5346 | 92 | 1.720913% |
| B | 5346 | 102 | 1.907969% |
| C | 5346 | 43 | 0.804340% |
| D | 5346 | 169 | 3.161242% |
Noise dominated data is calculated using 1-second bins in cleaned event files. If a bin has >2000 counts, and if more than 50% of those come from <1% of pixels, then it is considered to be noise-dominated and hence unusable.
| Quadrant | # 1 sec bins | Bins with >0 counts | Bins with >2000 counts | High rate bins dominated by noise | Noise dominated (total time) | Noise dominated (detector-on time) | Marked lightcurve |
|---|---|---|---|---|---|---|---|
| A | 7380 | 5347 | 60 | 60 | 0.81% | 1.12% | 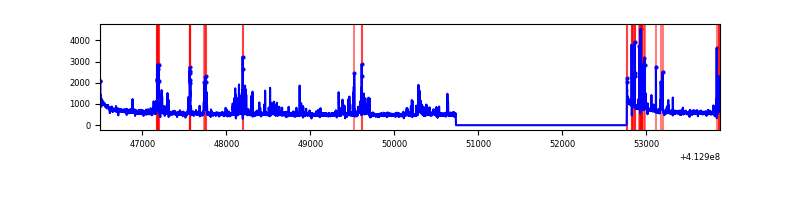 |
| B | 7380 | 5347 | 66 | 66 | 0.89% | 1.23% | 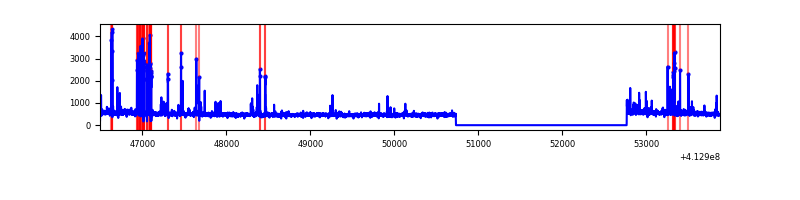 |
| C | 7380 | 5347 | 36 | 36 | 0.49% | 0.67% | 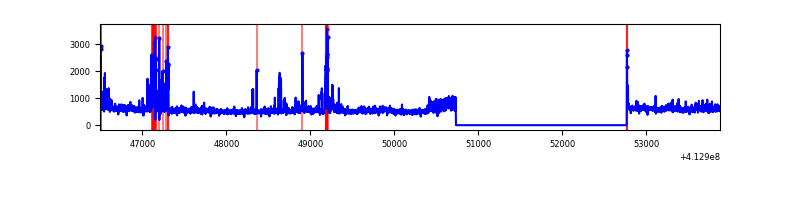 |
| D | 7380 | 5347 | 148 | 148 | 2.01% | 2.77% | 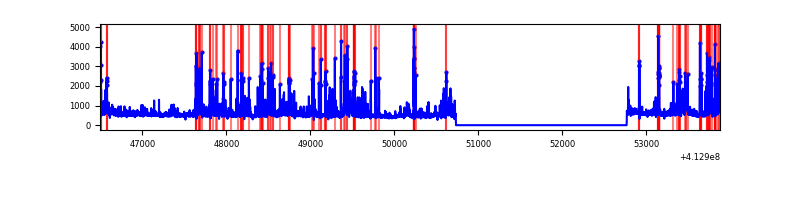 |
Top three noisy pixels from each quadrant. If the there are fewer than three noisy pixels in the level2.evt file, extra rows are filled as -1
| Pixel properties | Quadrant properties | ||||||
|---|---|---|---|---|---|---|---|
| Quadrant | DetID | PixID | Counts | Sigma | Mean | Median | Sigma |
| A | 10 | 83 | 459481 | 3453.11 | 658 | 647 | 132.9 |
| A | 15 | 174 | 293091 | 2200.89 | 658 | 647 | 132.9 |
| A | 13 | 248 | 100295 | 749.93 | 658 | 647 | 132.9 |
| B | 5 | 172 | 280044 | 2292.38 | 646 | 630 | 121.9 |
| B | 4 | 170 | 34903 | 281.18 | 646 | 630 | 121.9 |
| B | 5 | 255 | 30499 | 245.05 | 646 | 630 | 121.9 |
| C | 9 | 187 | 256788 | 1758.62 | 636 | 640 | 145.7 |
| C | 15 | 214 | 221032 | 1513.13 | 636 | 640 | 145.7 |
| C | 15 | 208 | 183291 | 1254.01 | 636 | 640 | 145.7 |
| D | 12 | 227 | 569647 | 3700.28 | 636 | 618 | 153.8 |
| D | 12 | 233 | 327697 | 2126.93 | 636 | 618 | 153.8 |
| D | 2 | 250 | 195889 | 1269.81 | 636 | 618 | 153.8 |
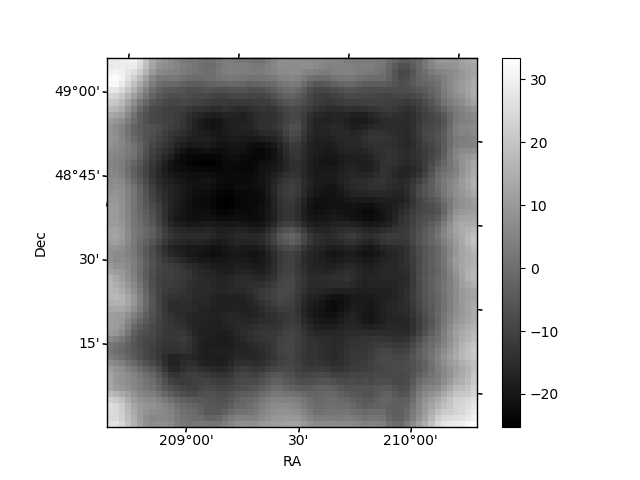
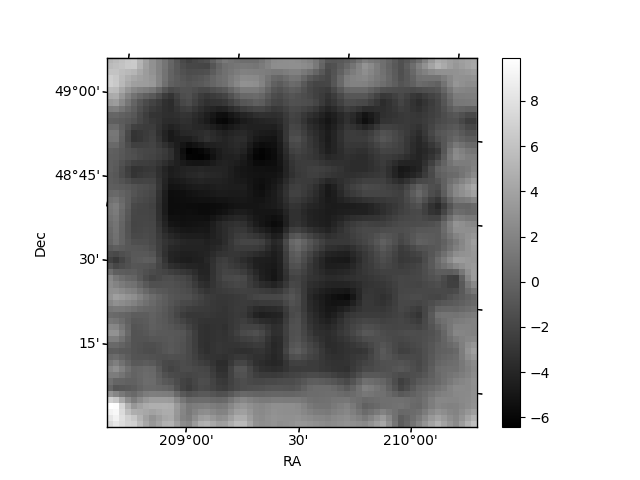
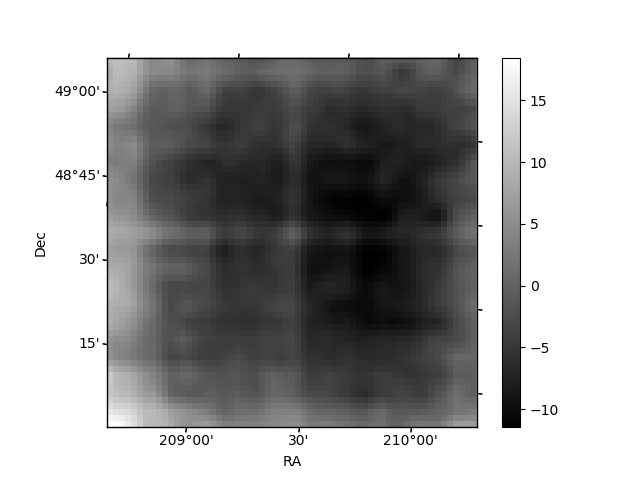
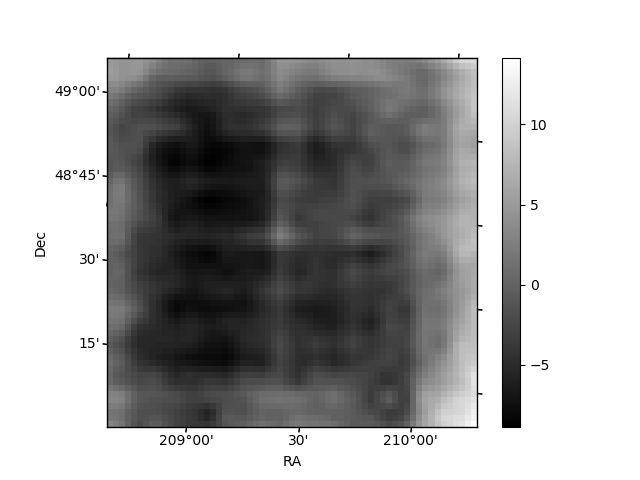
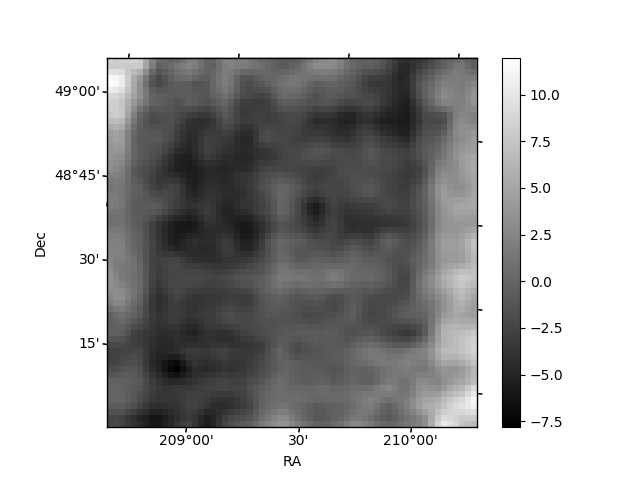
Histogram calculated using DETX and DETY for each event in the final _common_clean file
| Quadrant A | 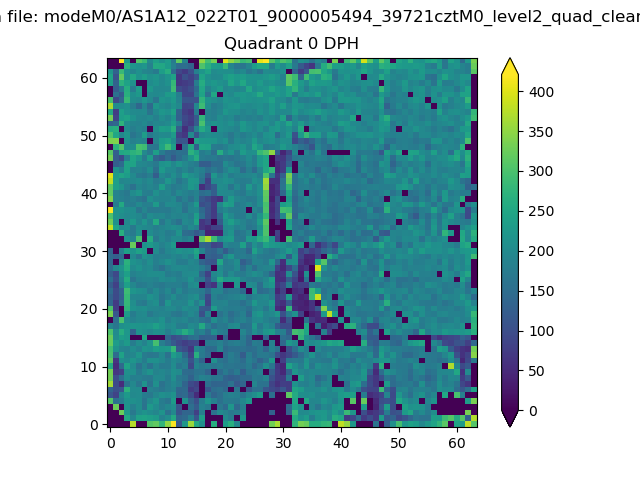 |
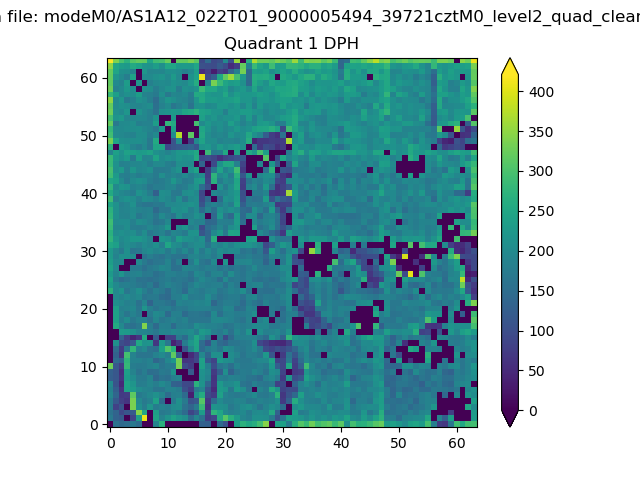 |
Quadrant B |
|---|---|---|---|
| Quadrant D | 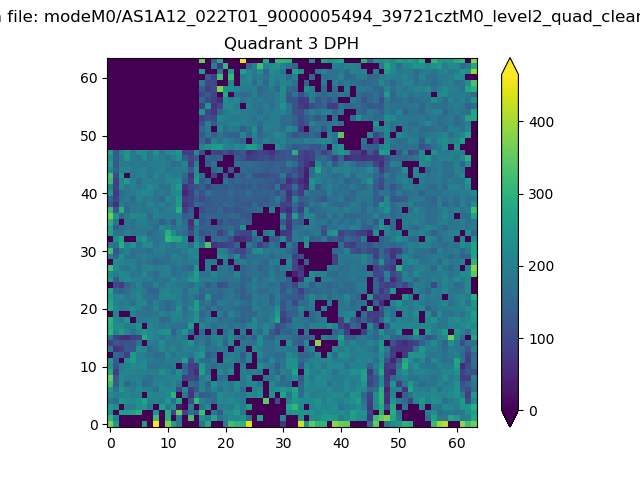 |
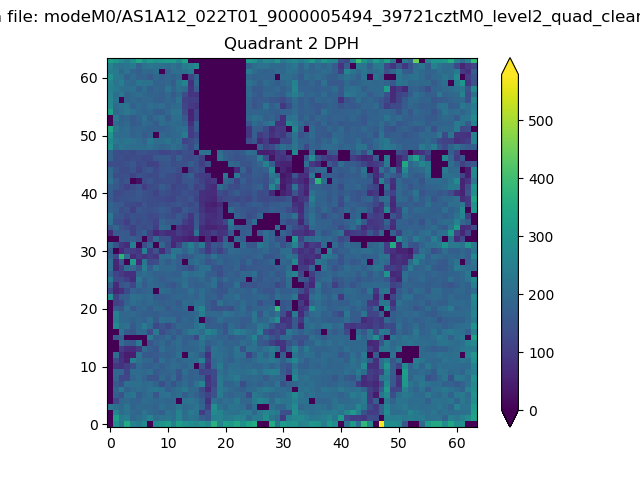 |
Quadrant C |
| Plot type | Count rate plots | Images |
|---|---|---|
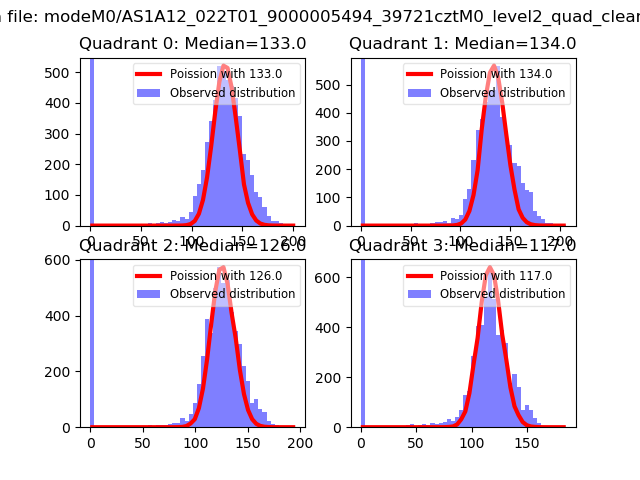
| Comparison with Poisson distribution Blue bars denote a histogram of data divided into 1 sec bins. Red curve is a Poisson curve with rate = median count rate of data. |
 |
 |
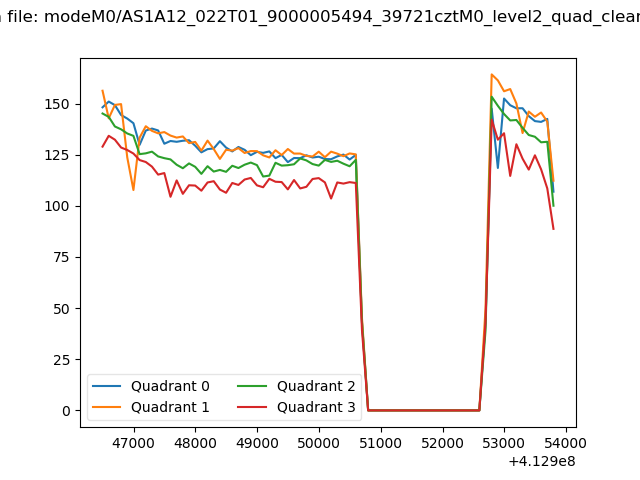
| Quadrant-wise count rates Data is divided into 100 sec bins |
 |
|
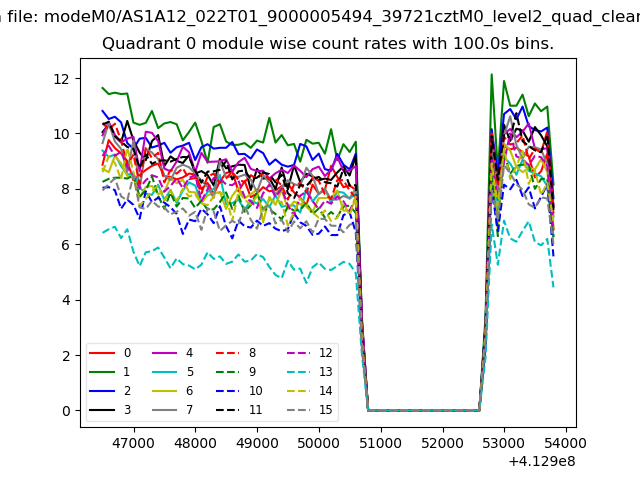
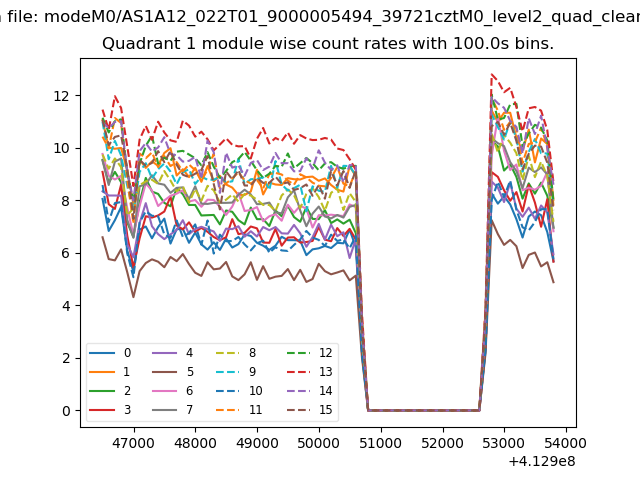
| Module-wise count rates for Quadrant A Data is divided into 100 sec bins |
 |
 |
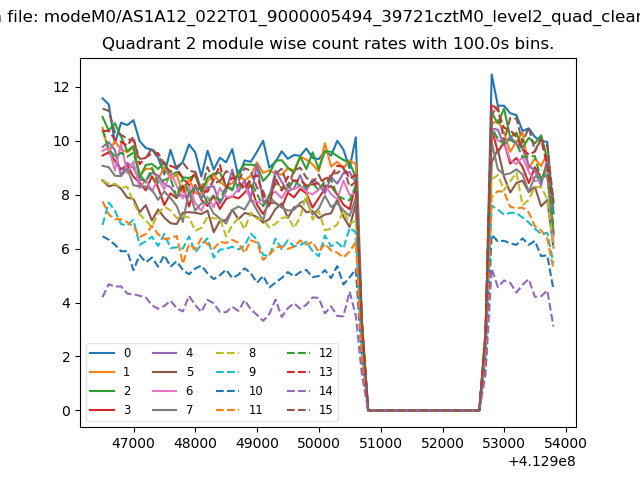
| Module-wise count rates for Quadrant B Data is divided into 100 sec bins |
 |
 |
| Module-wise count rates for Quadrant C Data is divided into 100 sec bins |
 |
 |
| Module-wise count rates for Quadrant D Data is divided into 100 sec bins |
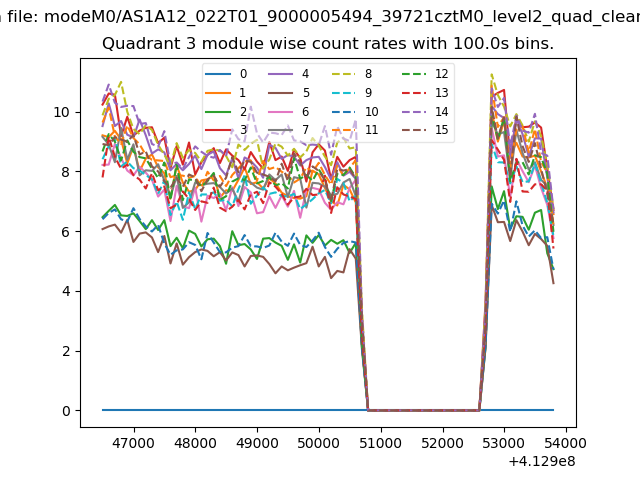 |
 |
| Parameter | Plot |
|---|---|
| CZT HV Monitor | 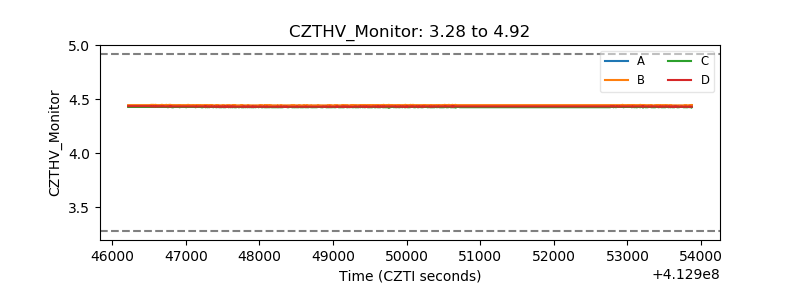 |
| D_VDD |  |
| Temperature 1 | 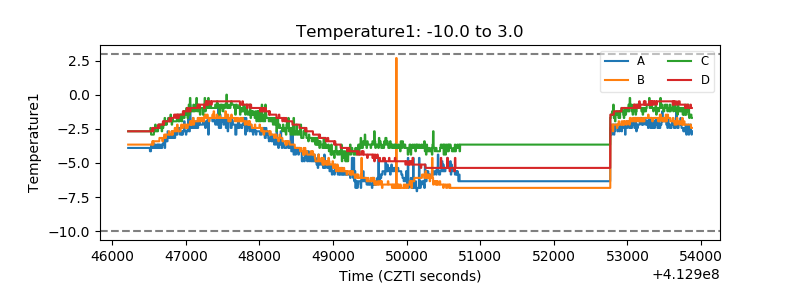 |
| Veto HV Monitor | 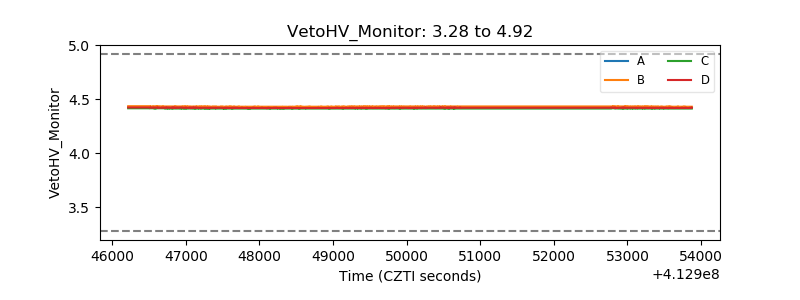 |
| Veto LLD | 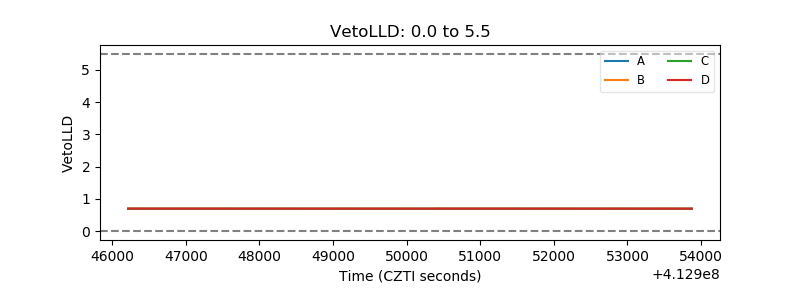 |
| Alpha Counter | 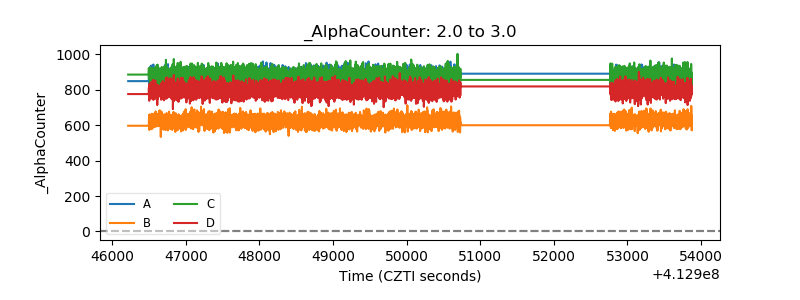 |
| _CPM_Rate | 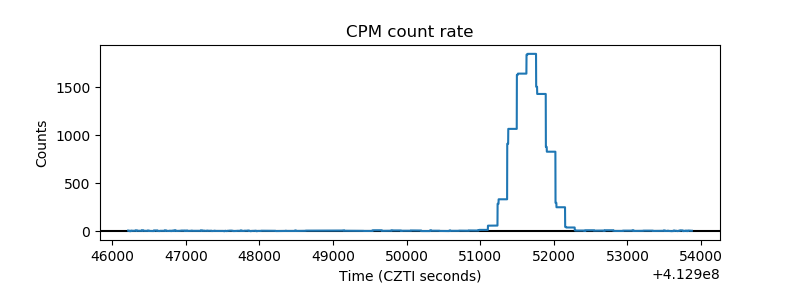 |
| CZT Counter | 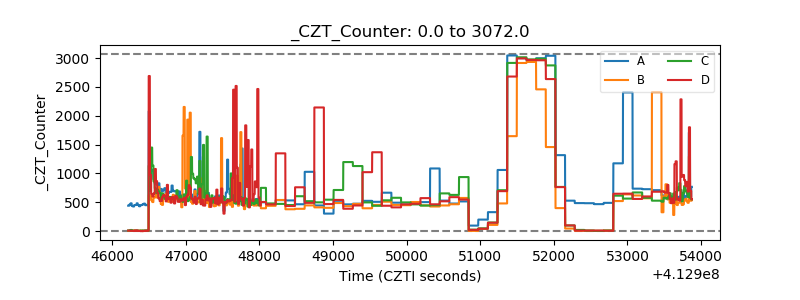 |
| +2.5 Volts monitor |  |
| +5 Volts monitor |  |
| _ROLL_ROT | 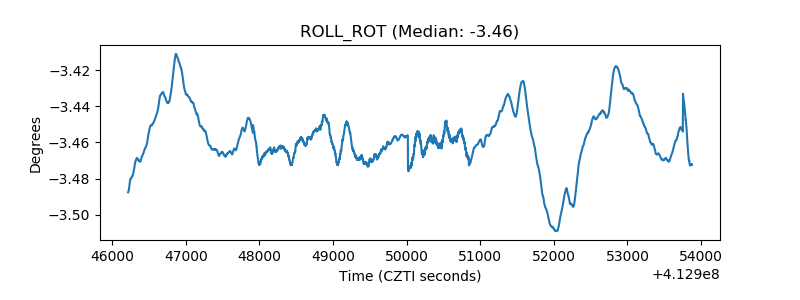 |
| _Roll_DEC | 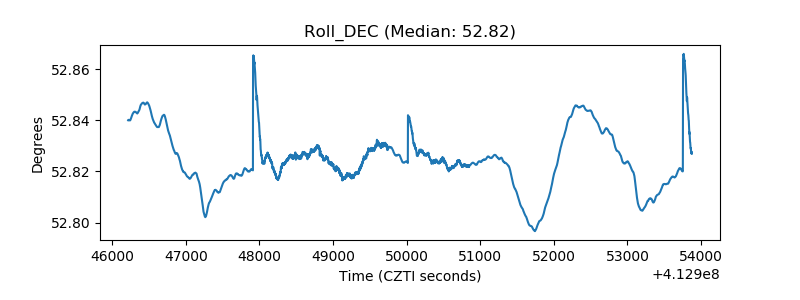 |
| _Roll_RA | 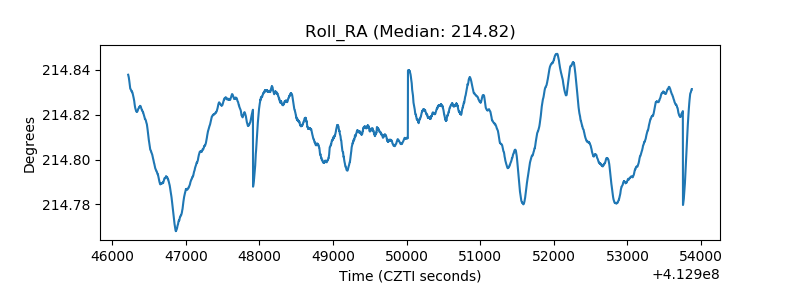 |
| Veto Counter | 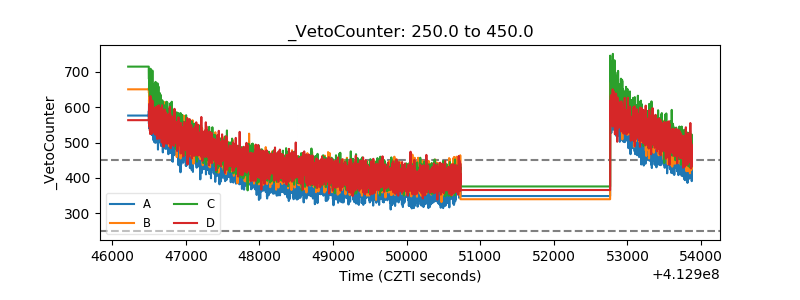 |