| Param | Original file | Final file |
|---|---|---|
| Filename | modeM0/AS1A12_022T01_9000005494_39722cztM0_level2.fits | modeM0/AS1A12_022T01_9000005494_39722cztM0_level2_quad_clean.evt |
| Size (bytes) | 365,736,960 | 99,702,720 |
| Size | 348.8 MB | 95.1 MB |
| Events in quadrant A | 3,426,032 | 688,458 |
| Events in quadrant B | 2,781,050 | 709,371 |
| Events in quadrant C | 3,000,613 | 666,337 |
| Events in quadrant D | 3,929,071 | 593,672 |
| Mode SS | |||
|---|---|---|---|
| Quadrant | BADHDUFLAG | Total packets | Discarded packets |
| A | 0 | 104 | 0 |
| B | 0 | 104 | 0 |
| C | 0 | 104 | 0 |
| D | 0 | 104 | 0 |
| Mode M0 | |||
|---|---|---|---|
| Quadrant | BADHDUFLAG | Total packets | Discarded packets |
| A | 0 | 13493 | 3 |
| B | 0 | 11412 | 2 |
| C | 0 | 12253 | 2 |
| D | 0 | 15075 | 2 |
| Mode M9 | |||
|---|---|---|---|
| Quadrant | BADHDUFLAG | Total packets | Discarded packets |
| A | 0 | 31 | 0 |
| B | 0 | 31 | 0 |
| C | 0 | 31 | 0 |
| D | 0 | 32 | 0 |
| Quadrant | Total seconds | Saturated seconds | Saturation percentage |
|---|---|---|---|
| A | 5162 | 123 | 2.382797% |
| B | 5162 | 48 | 0.929872% |
| C | 5162 | 12 | 0.232468% |
| D | 5162 | 318 | 6.160403% |
Noise dominated data is calculated using 1-second bins in cleaned event files. If a bin has >2000 counts, and if more than 50% of those come from <1% of pixels, then it is considered to be noise-dominated and hence unusable.
| Quadrant | # 1 sec bins | Bins with >0 counts | Bins with >2000 counts | High rate bins dominated by noise | Noise dominated (total time) | Noise dominated (detector-on time) | Marked lightcurve |
|---|---|---|---|---|---|---|---|
| A | 7286 | 5163 | 81 | 81 | 1.11% | 1.57% | 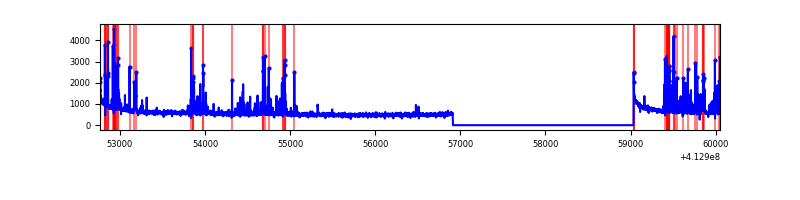 |
| B | 7286 | 5163 | 27 | 27 | 0.37% | 0.52% | 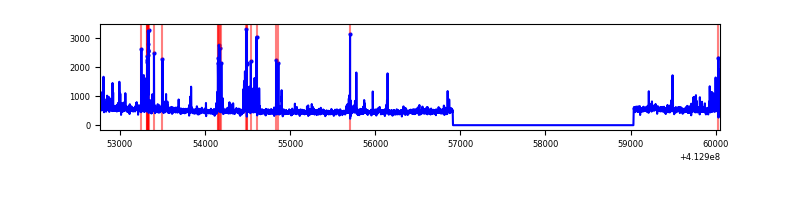 |
| C | 7286 | 5163 | 6 | 6 | 0.08% | 0.12% | 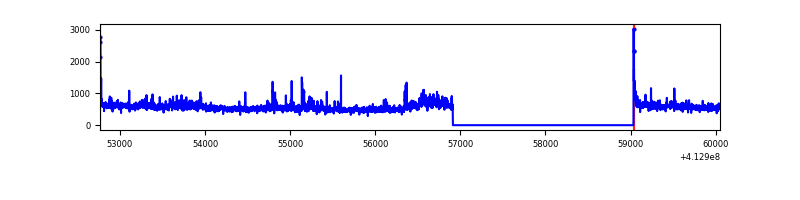 |
| D | 7286 | 5163 | 266 | 266 | 3.65% | 5.15% | 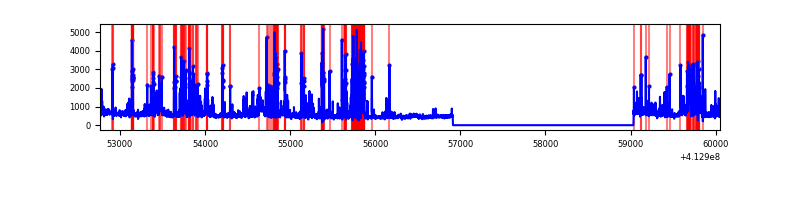 |
Top three noisy pixels from each quadrant. If the there are fewer than three noisy pixels in the level2.evt file, extra rows are filled as -1
| Pixel properties | Quadrant properties | ||||||
|---|---|---|---|---|---|---|---|
| Quadrant | DetID | PixID | Counts | Sigma | Mean | Median | Sigma |
| A | 10 | 83 | 460471 | 3647.99 | 633 | 622 | 126.1 |
| A | 13 | 248 | 361951 | 2866.43 | 633 | 622 | 126.1 |
| A | 9 | 143 | 82032 | 645.83 | 633 | 622 | 126.1 |
| B | 5 | 172 | 214222 | 1792.13 | 630 | 614 | 119.2 |
| B | 4 | 170 | 42246 | 349.28 | 630 | 614 | 119.2 |
| B | 5 | 255 | 24311 | 198.81 | 630 | 614 | 119.2 |
| C | 15 | 214 | 214588 | 1493.64 | 621 | 625 | 143.2 |
| C | 15 | 208 | 195589 | 1361.01 | 621 | 625 | 143.2 |
| C | 9 | 187 | 87639 | 607.43 | 621 | 625 | 143.2 |
| D | 12 | 227 | 1060665 | 7102.39 | 608 | 592 | 149.3 |
| D | 2 | 250 | 199339 | 1331.59 | 608 | 592 | 149.3 |
| D | 13 | 249 | 139899 | 933.34 | 608 | 592 | 149.3 |
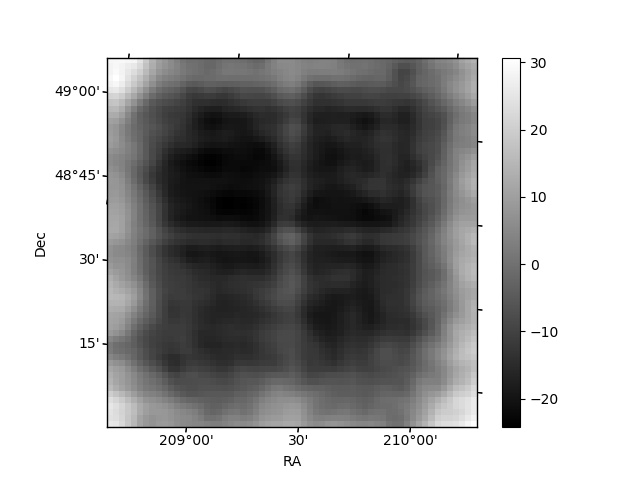
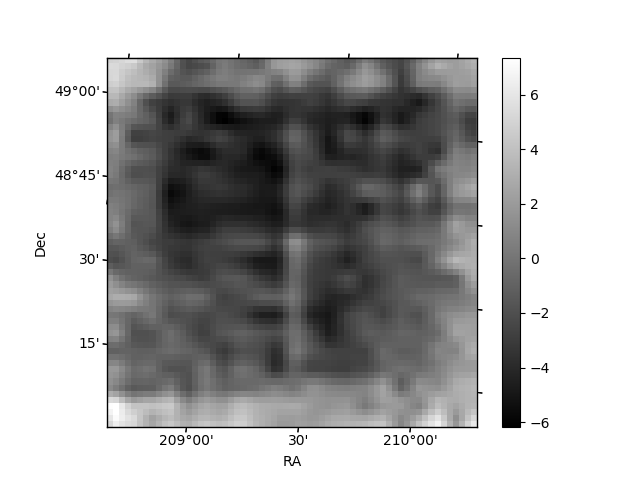
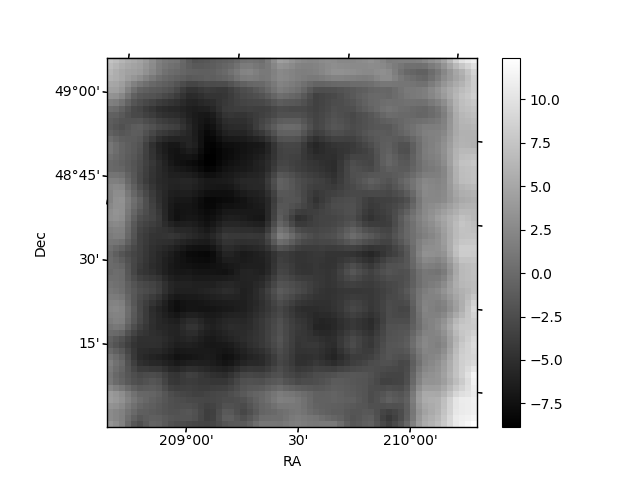
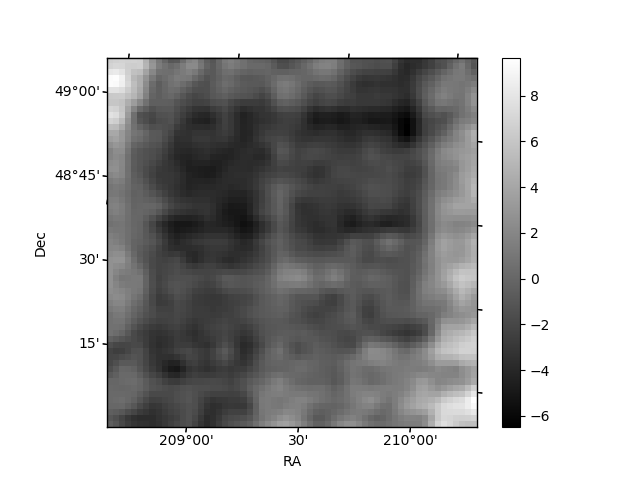
Histogram calculated using DETX and DETY for each event in the final _common_clean file
| Quadrant A | 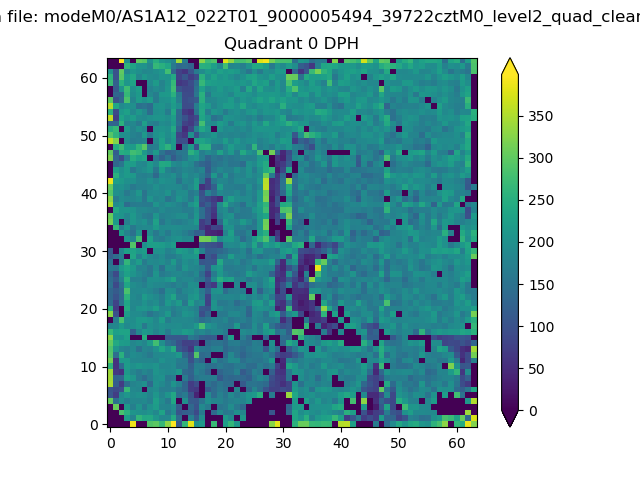 |
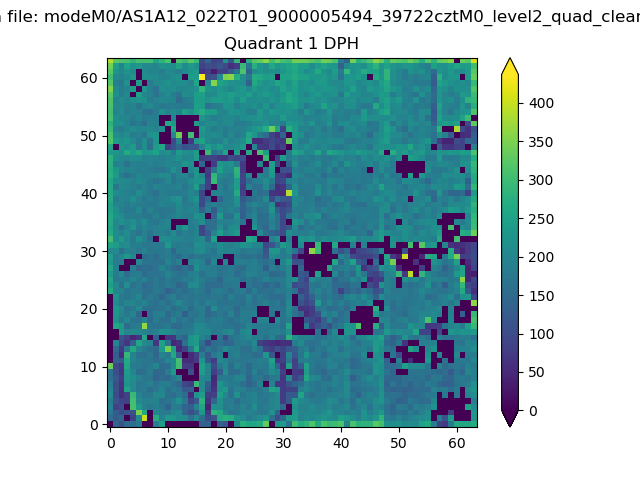 |
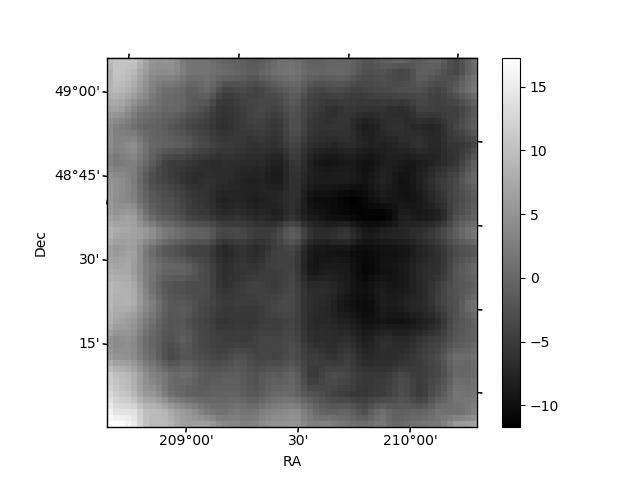
Quadrant B |
|---|---|---|---|
| Quadrant D | 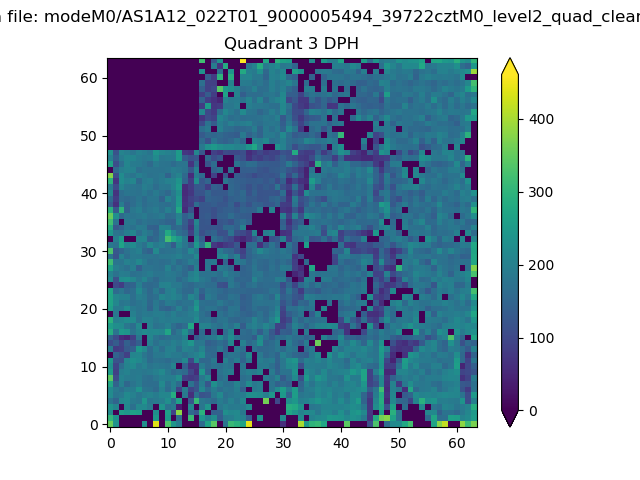 |
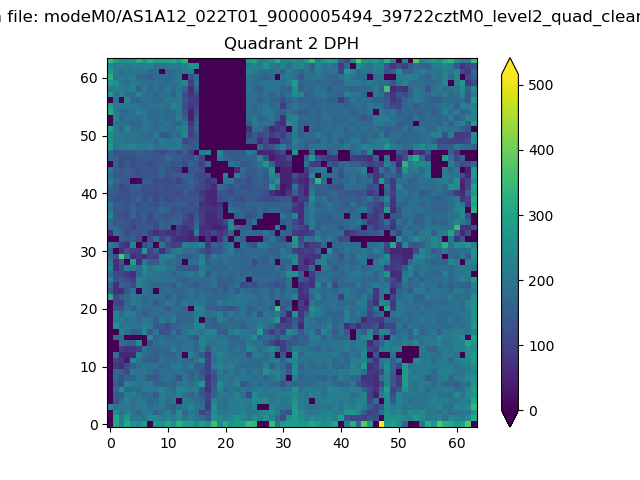 |
Quadrant C |
| Plot type | Count rate plots | Images |
|---|---|---|
| Comparison with Poisson distribution Blue bars denote a histogram of data divided into 1 sec bins. Red curve is a Poisson curve with rate = median count rate of data. |
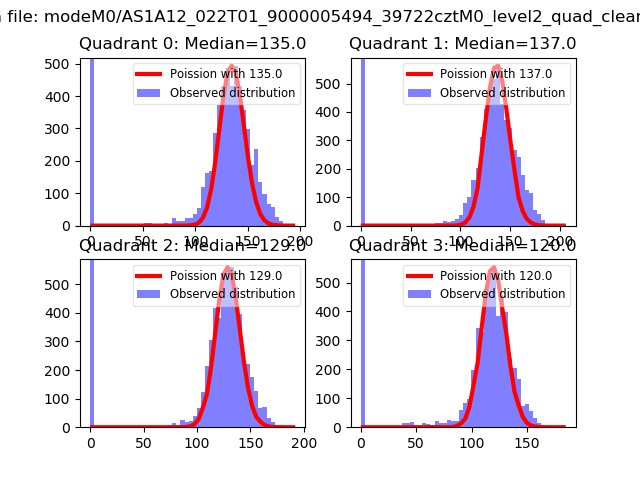 |
 |
| Quadrant-wise count rates Data is divided into 100 sec bins |
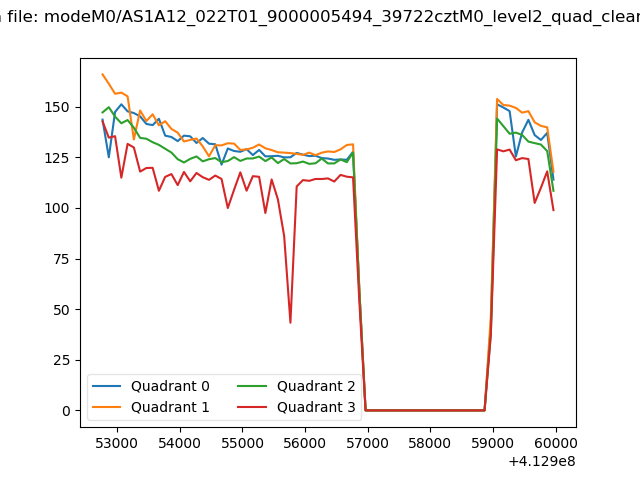 |
|
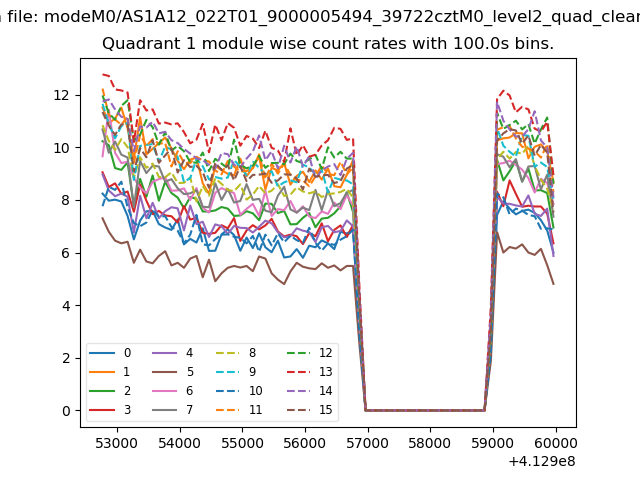
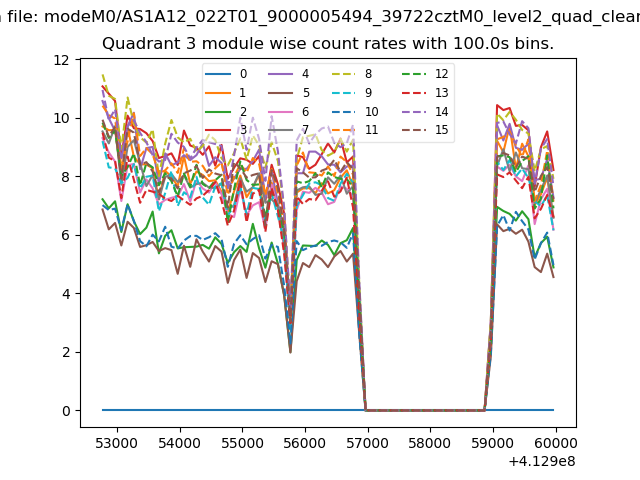
| Module-wise count rates for Quadrant A Data is divided into 100 sec bins |
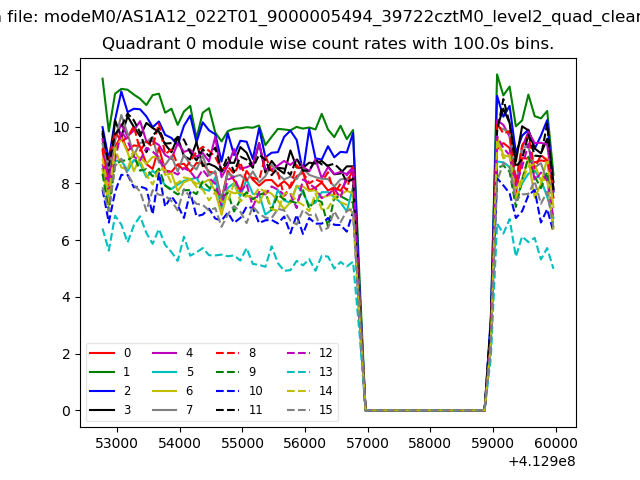 |
 |
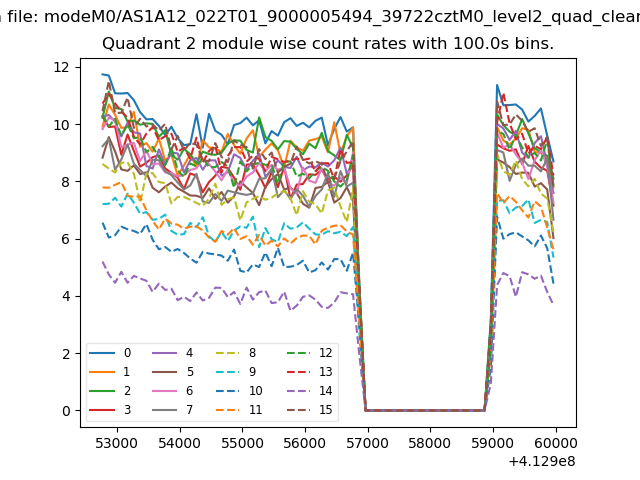
| Module-wise count rates for Quadrant B Data is divided into 100 sec bins |
 |
 |
| Module-wise count rates for Quadrant C Data is divided into 100 sec bins |
 |
 |
| Module-wise count rates for Quadrant D Data is divided into 100 sec bins |
 |
 |
| Parameter | Plot |
|---|---|
| CZT HV Monitor | 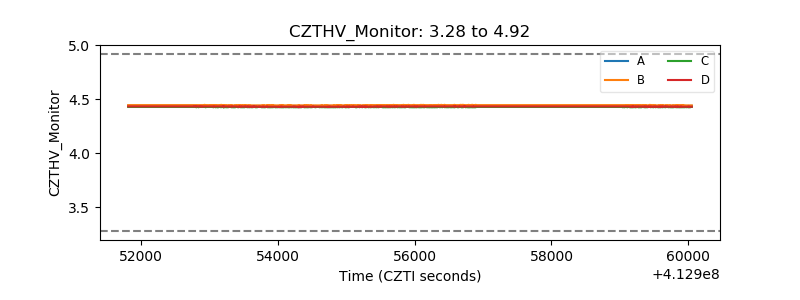 |
| D_VDD | 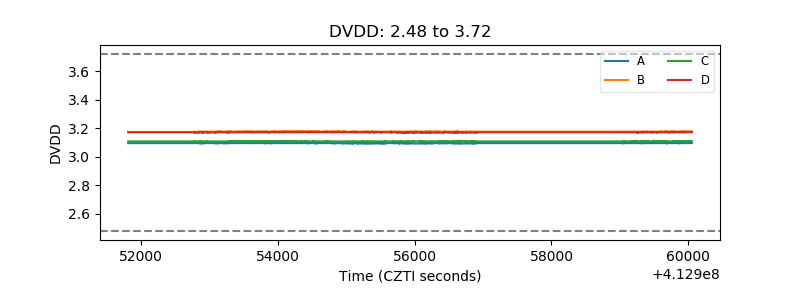 |
| Temperature 1 | 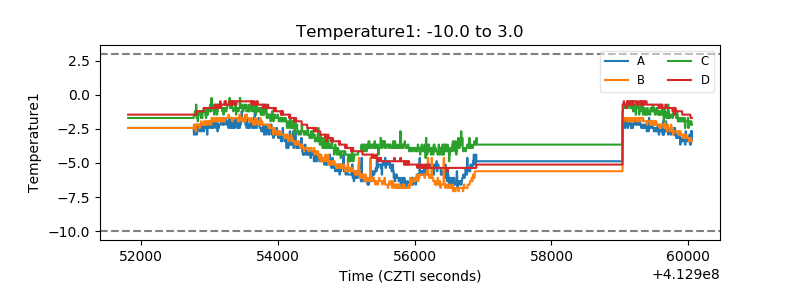 |
| Veto HV Monitor | 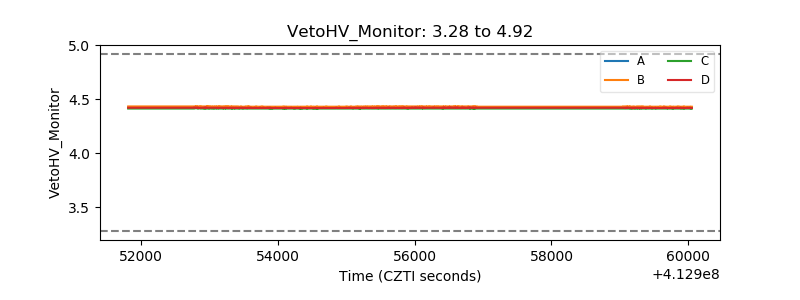 |
| Veto LLD | 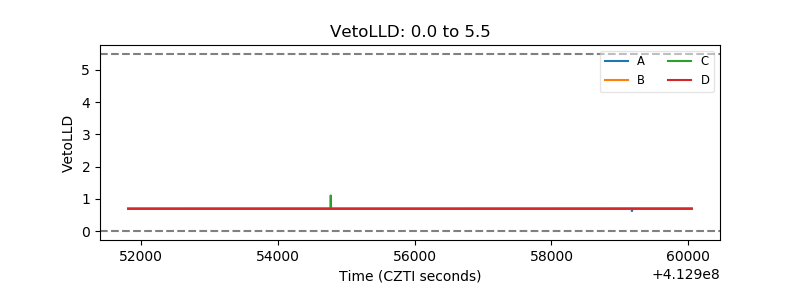 |
| Alpha Counter | 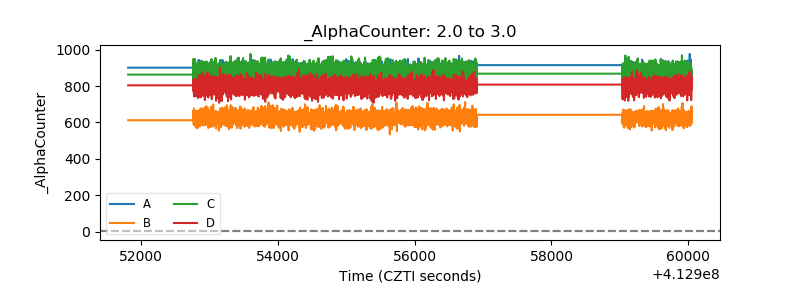 |
| _CPM_Rate | 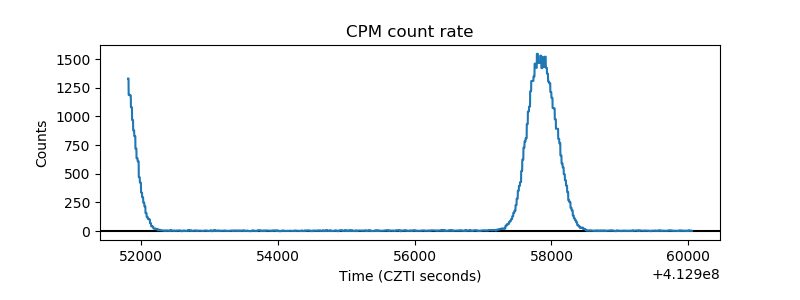 |
| CZT Counter | 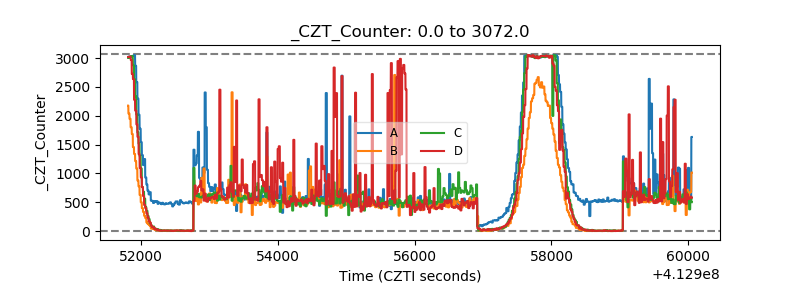 |
| +2.5 Volts monitor | 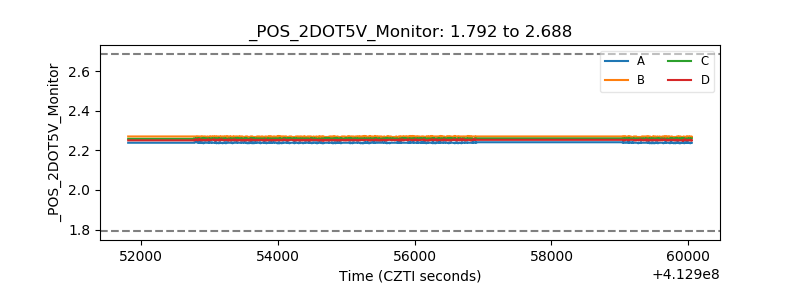 |
| +5 Volts monitor | 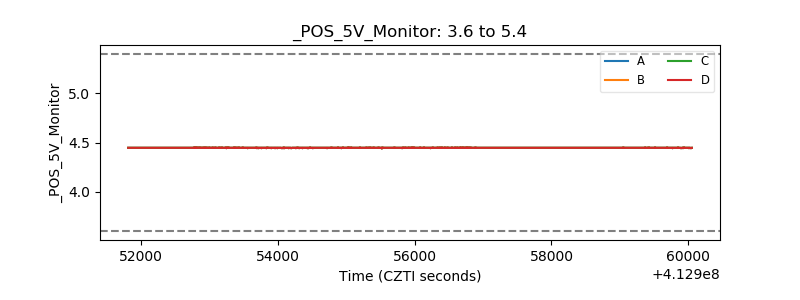 |
| _ROLL_ROT | 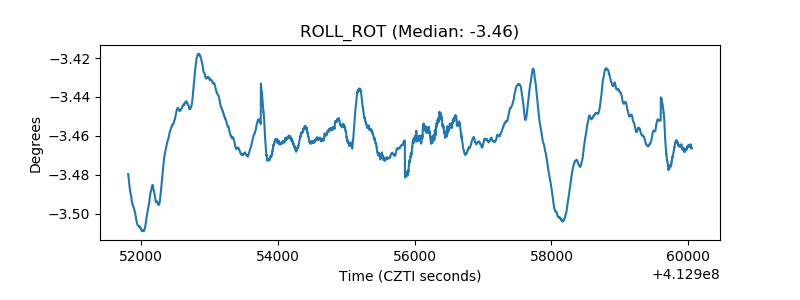 |
| _Roll_DEC | 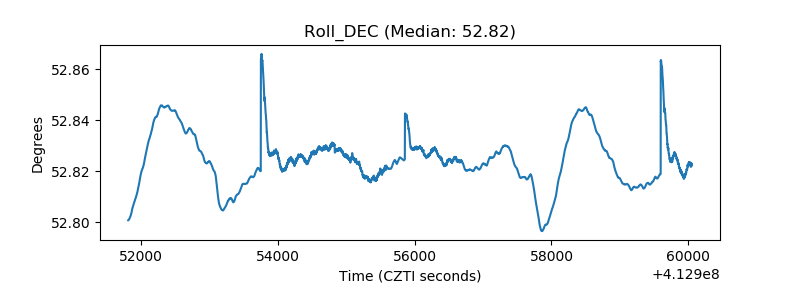 |
| _Roll_RA | 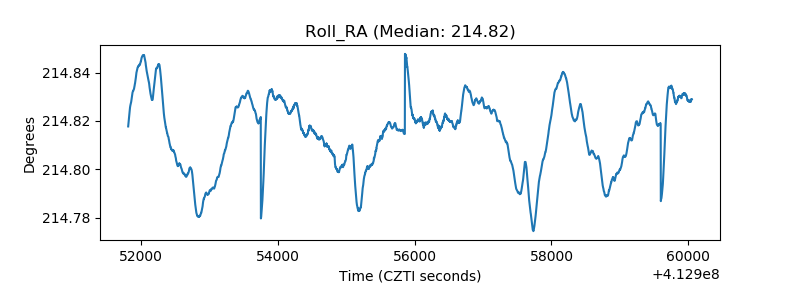 |
| Veto Counter | 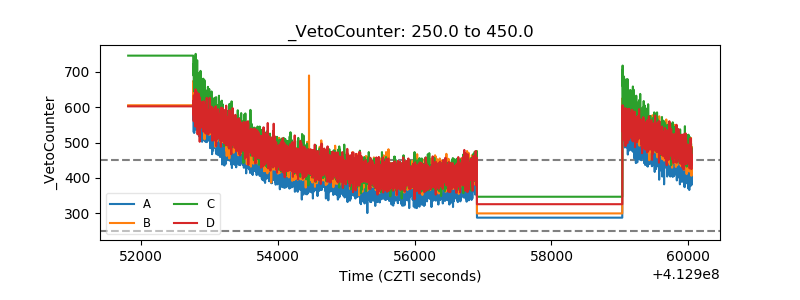 |