| Param | Original file | Final file |
|---|---|---|
| Filename | modeM0/AS1A12_022T01_9000005494_39723cztM0_level2.fits | modeM0/AS1A12_022T01_9000005494_39723cztM0_level2_quad_clean.evt |
| Size (bytes) | 378,970,560 | 93,430,080 |
| Size | 361.4 MB | 89.1 MB |
| Events in quadrant A | 3,357,802 | 647,939 |
| Events in quadrant B | 2,804,232 | 663,052 |
| Events in quadrant C | 3,110,859 | 616,889 |
| Events in quadrant D | 4,362,307 | 547,481 |
| Mode SS | |||
|---|---|---|---|
| Quadrant | BADHDUFLAG | Total packets | Discarded packets |
| A | 0 | 102 | 0 |
| B | 0 | 102 | 0 |
| C | 0 | 102 | 0 |
| D | 0 | 102 | 0 |
| Mode M0 | |||
|---|---|---|---|
| Quadrant | BADHDUFLAG | Total packets | Discarded packets |
| A | 0 | 13275 | 3 |
| B | 0 | 11551 | 2 |
| C | 0 | 12251 | 2 |
| D | 0 | 16370 | 2 |
| Mode M9 | |||
|---|---|---|---|
| Quadrant | BADHDUFLAG | Total packets | Discarded packets |
| A | 0 | 26 | 0 |
| B | 0 | 26 | 0 |
| C | 0 | 26 | 0 |
| D | 0 | 27 | 0 |
| Quadrant | Total seconds | Saturated seconds | Saturation percentage |
|---|---|---|---|
| A | 5052 | 131 | 2.593032% |
| B | 5052 | 81 | 1.603325% |
| C | 5052 | 152 | 3.008709% |
| D | 5052 | 454 | 8.986540% |
Noise dominated data is calculated using 1-second bins in cleaned event files. If a bin has >2000 counts, and if more than 50% of those come from <1% of pixels, then it is considered to be noise-dominated and hence unusable.
| Quadrant | # 1 sec bins | Bins with >0 counts | Bins with >2000 counts | High rate bins dominated by noise | Noise dominated (total time) | Noise dominated (detector-on time) | Marked lightcurve |
|---|---|---|---|---|---|---|---|
| A | 7174 | 5053 | 93 | 93 | 1.30% | 1.84% | 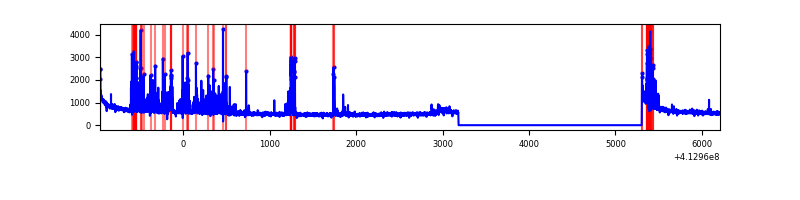 |
| B | 7174 | 5053 | 49 | 49 | 0.68% | 0.97% | 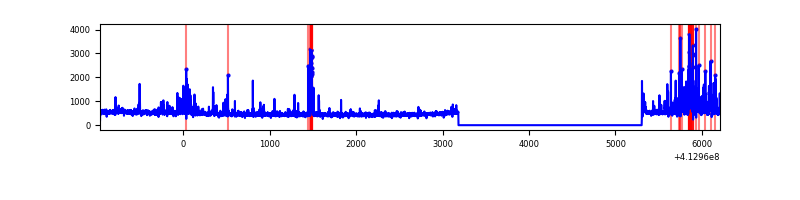 |
| C | 7174 | 5053 | 125 | 125 | 1.74% | 2.47% | 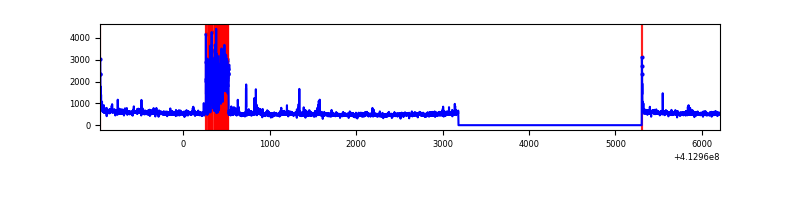 |
| D | 7174 | 5053 | 433 | 433 | 6.04% | 8.57% | 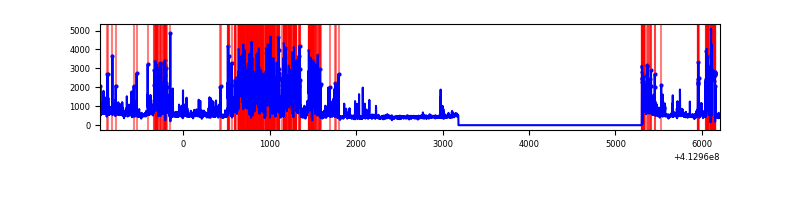 |
Top three noisy pixels from each quadrant. If the there are fewer than three noisy pixels in the level2.evt file, extra rows are filled as -1
| Pixel properties | Quadrant properties | ||||||
|---|---|---|---|---|---|---|---|
| Quadrant | DetID | PixID | Counts | Sigma | Mean | Median | Sigma |
| A | 13 | 248 | 468220 | 3853.54 | 598 | 586 | 121.4 |
| A | 10 | 83 | 449829 | 3701.99 | 598 | 586 | 121.4 |
| A | 15 | 174 | 119688 | 981.46 | 598 | 586 | 121.4 |
| B | 5 | 172 | 265561 | 2341.56 | 597 | 580 | 113.2 |
| B | 5 | 255 | 103552 | 909.93 | 597 | 580 | 113.2 |
| B | 4 | 170 | 58870 | 515.09 | 597 | 580 | 113.2 |
| C | 9 | 187 | 487140 | 3621.87 | 587 | 592 | 134.3 |
| C | 15 | 214 | 209091 | 1552.07 | 587 | 592 | 134.3 |
| C | 15 | 208 | 71256 | 526.02 | 587 | 592 | 134.3 |
| D | 12 | 227 | 1706536 | 12192.61 | 571 | 556 | 139.9 |
| D | 12 | 233 | 213375 | 1521.01 | 571 | 556 | 139.9 |
| D | 5 | 32 | 64503 | 457.03 | 571 | 556 | 139.9 |
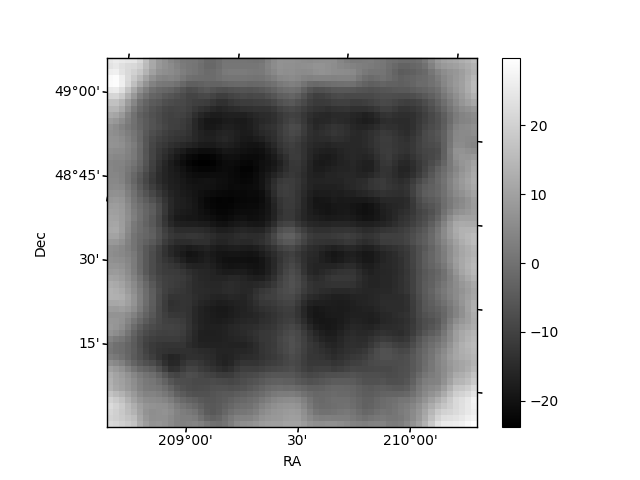
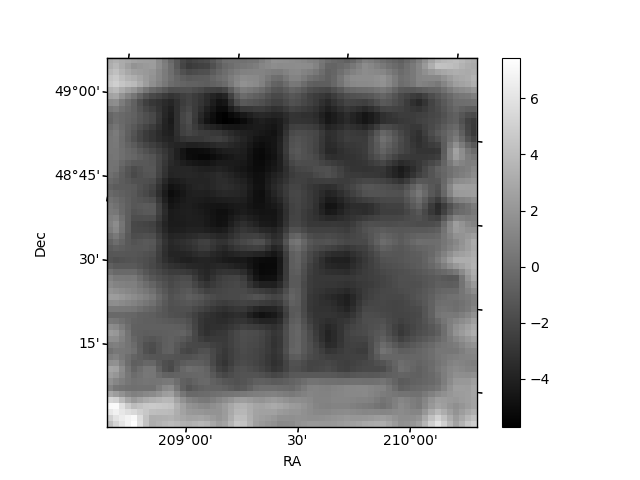
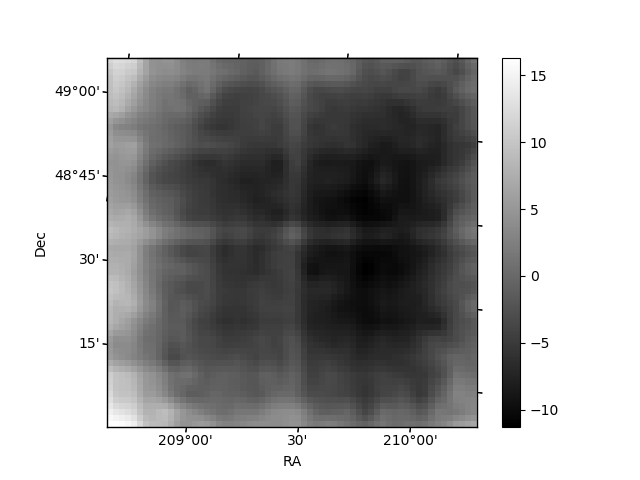
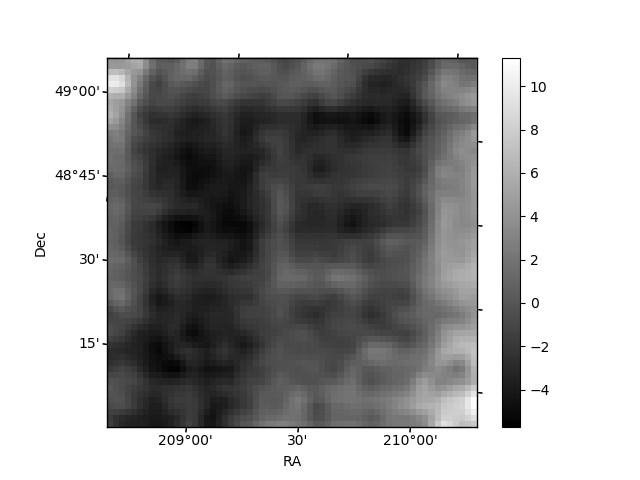
Histogram calculated using DETX and DETY for each event in the final _common_clean file
| Quadrant A | 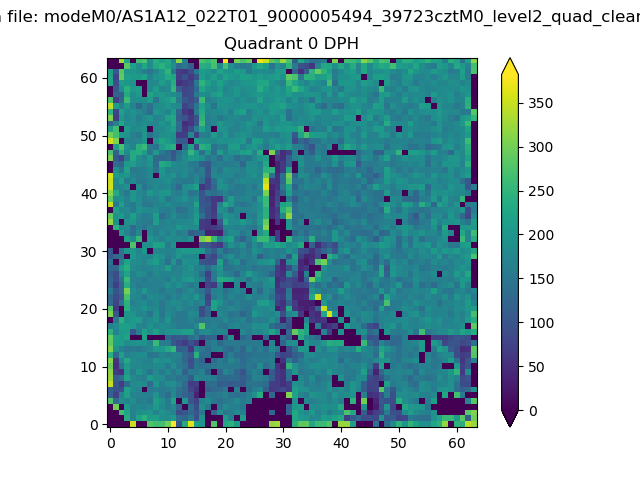 |
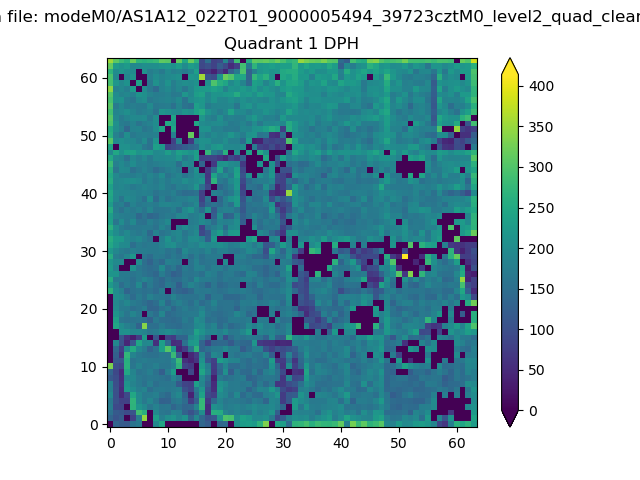 |
Quadrant B |
|---|---|---|---|
| Quadrant D | 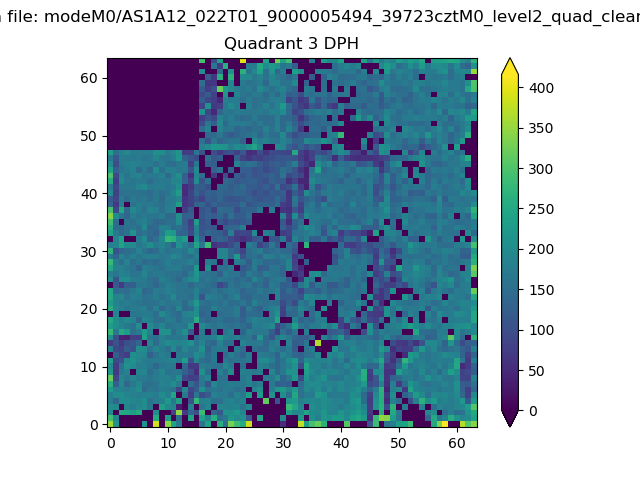 |
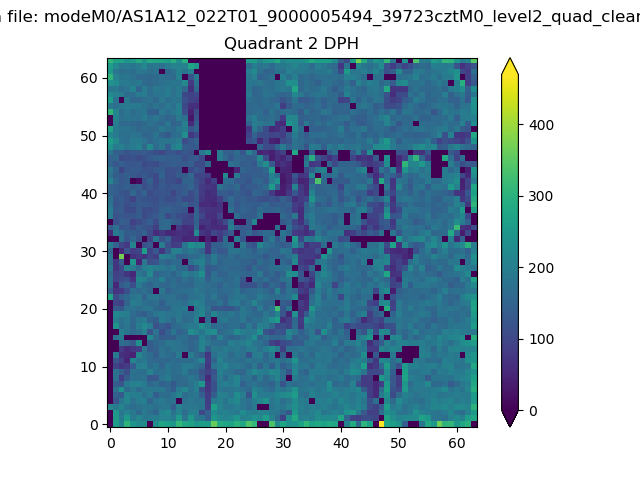 |
Quadrant C |
| Plot type | Count rate plots | Images |
|---|---|---|
| Comparison with Poisson distribution Blue bars denote a histogram of data divided into 1 sec bins. Red curve is a Poisson curve with rate = median count rate of data. |
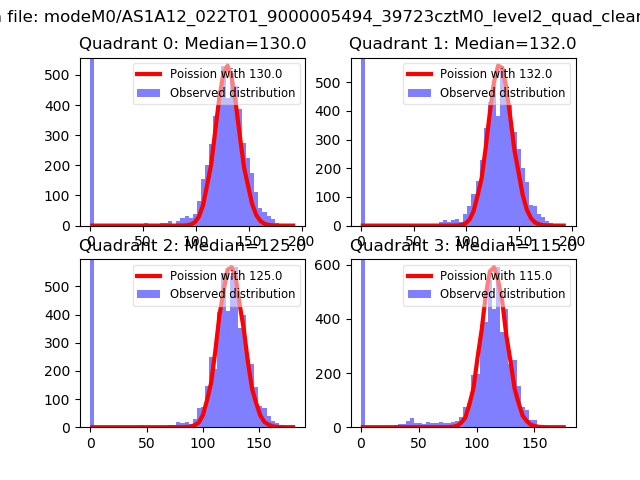 |
 |
| Quadrant-wise count rates Data is divided into 100 sec bins |
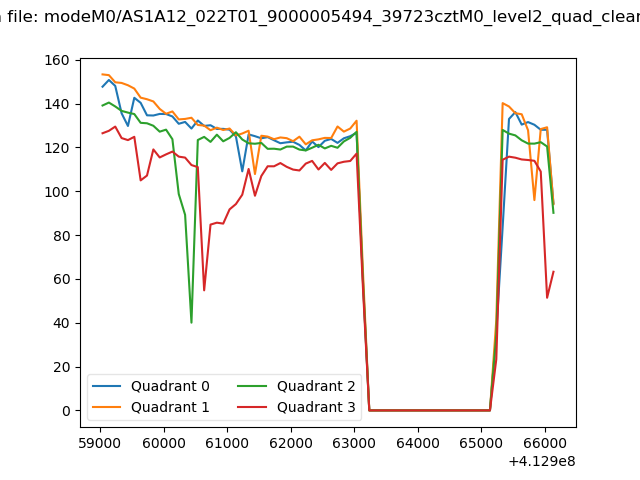 |
|
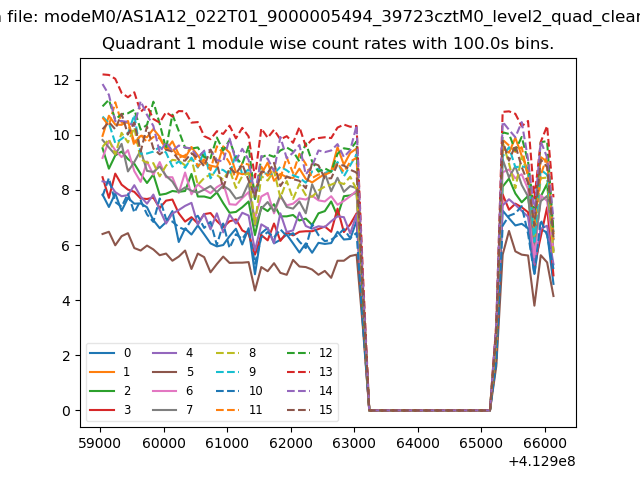
| Module-wise count rates for Quadrant A Data is divided into 100 sec bins |
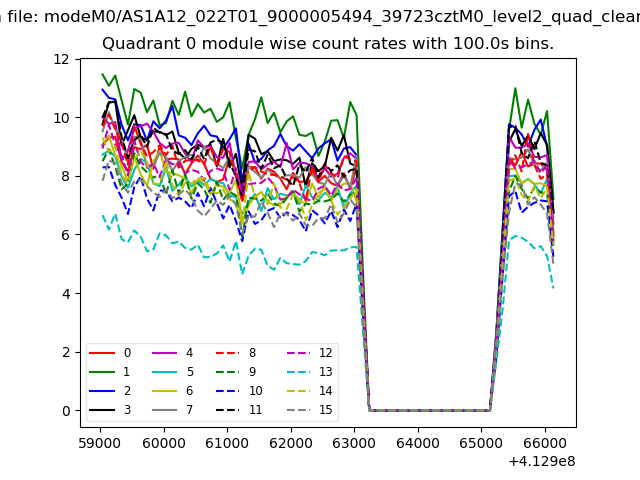 |
 |
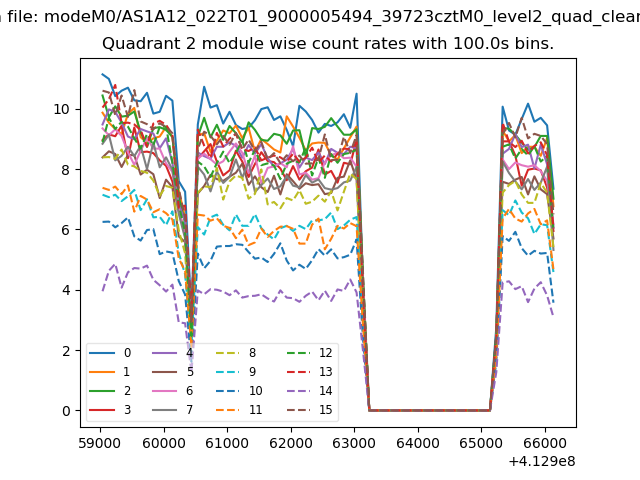
| Module-wise count rates for Quadrant B Data is divided into 100 sec bins |
 |
 |
| Module-wise count rates for Quadrant C Data is divided into 100 sec bins |
 |
 |
| Module-wise count rates for Quadrant D Data is divided into 100 sec bins |
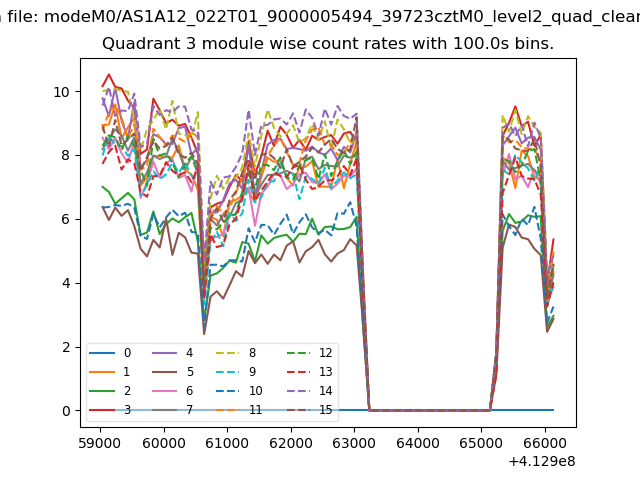 |
 |
| Parameter | Plot |
|---|---|
| CZT HV Monitor | 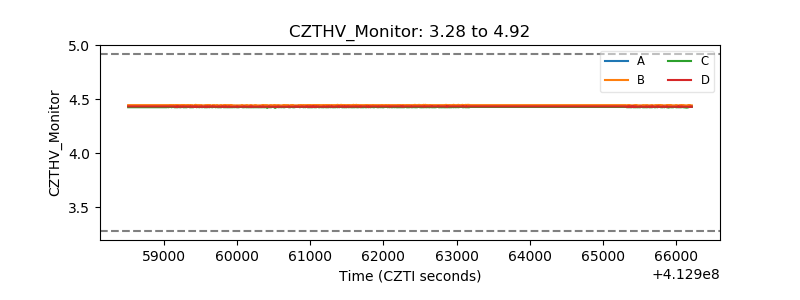 |
| D_VDD | 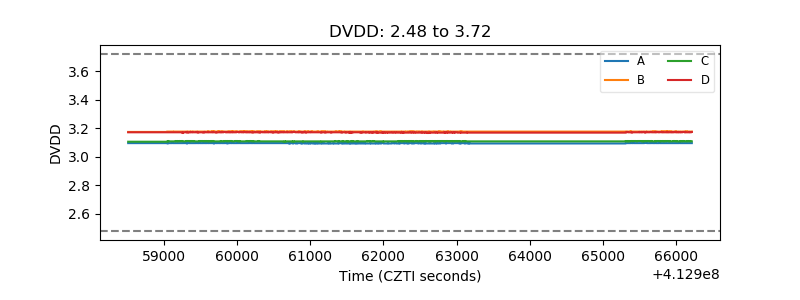 |
| Temperature 1 | 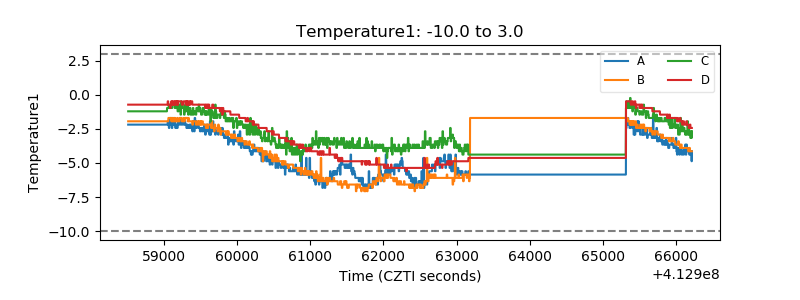 |
| Veto HV Monitor | 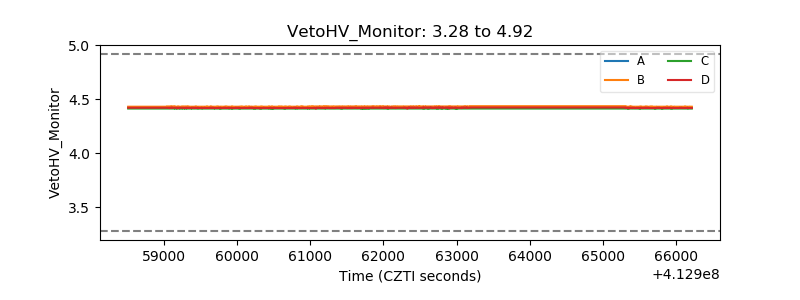 |
| Veto LLD | 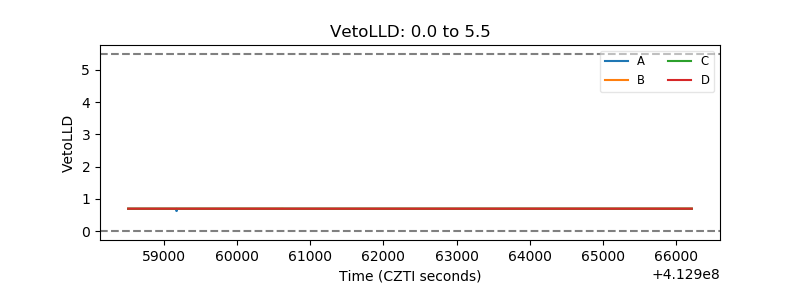 |
| Alpha Counter | 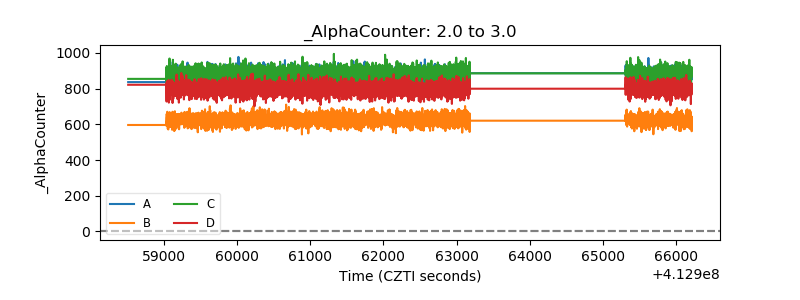 |
| _CPM_Rate | 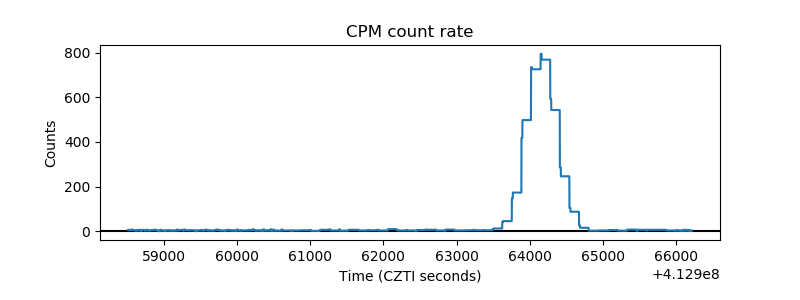 |
| CZT Counter | 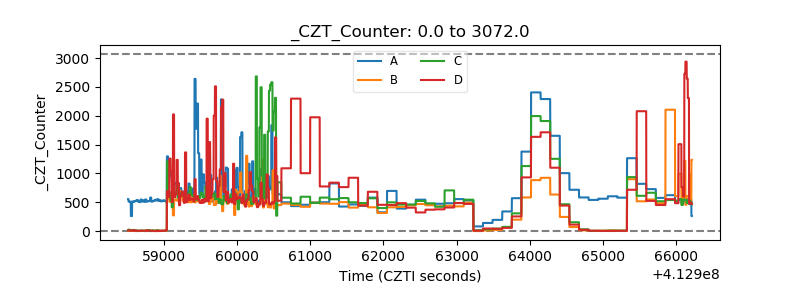 |
| +2.5 Volts monitor | 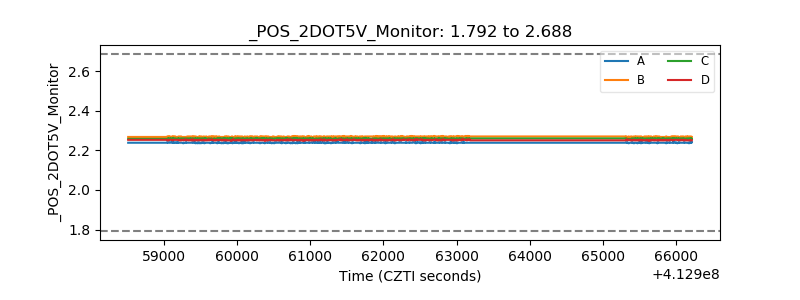 |
| +5 Volts monitor |  |
| _ROLL_ROT | 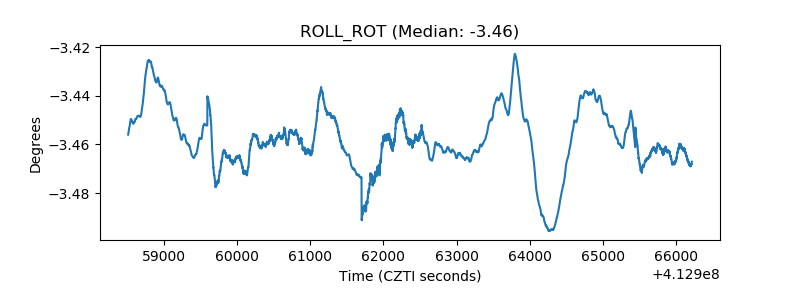 |
| _Roll_DEC | 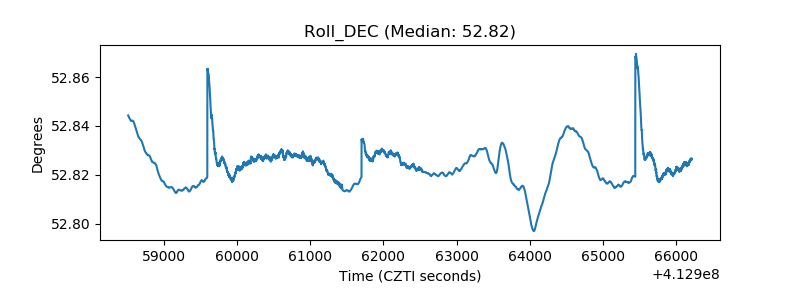 |
| _Roll_RA | 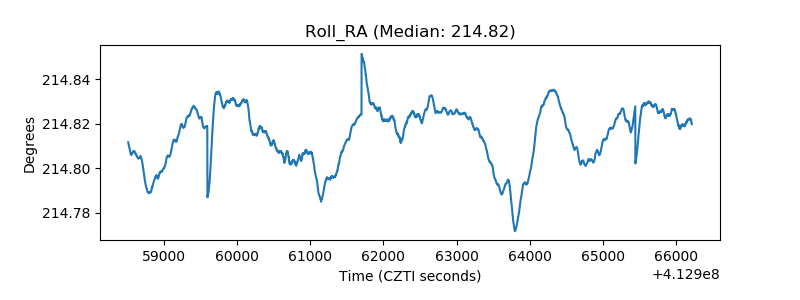 |
| Veto Counter | 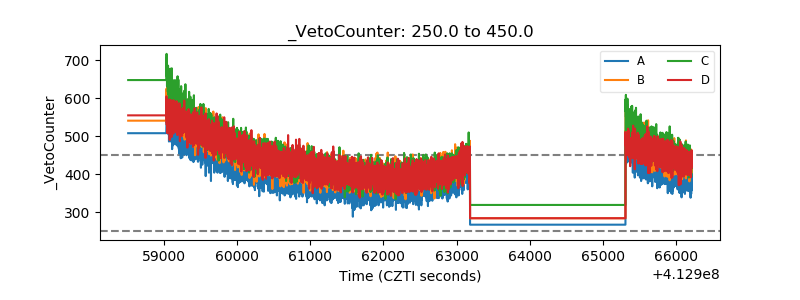 |