| Param | Original file | Final file |
|---|---|---|
| Filename | modeM0/AS1A12_022T01_9000005494_39724cztM0_level2.fits | modeM0/AS1A12_022T01_9000005494_39724cztM0_level2_quad_clean.evt |
| Size (bytes) | 342,936,000 | 86,958,720 |
| Size | 327.0 MB | 82.9 MB |
| Events in quadrant A | 3,468,989 | 571,334 |
| Events in quadrant B | 2,733,975 | 610,118 |
| Events in quadrant C | 2,771,089 | 584,459 |
| Events in quadrant D | 3,333,614 | 519,052 |
| Mode SS | |||
|---|---|---|---|
| Quadrant | BADHDUFLAG | Total packets | Discarded packets |
| A | 0 | 102 | 0 |
| B | 0 | 102 | 0 |
| C | 0 | 102 | 0 |
| D | 0 | 102 | 0 |
| Mode M0 | |||
|---|---|---|---|
| Quadrant | BADHDUFLAG | Total packets | Discarded packets |
| A | 0 | 13530 | 3 |
| B | 0 | 11514 | 2 |
| C | 0 | 11144 | 2 |
| D | 0 | 13297 | 2 |
| Mode M9 | |||
|---|---|---|---|
| Quadrant | BADHDUFLAG | Total packets | Discarded packets |
| A | 0 | 32 | 0 |
| B | 0 | 32 | 0 |
| C | 0 | 32 | 0 |
| D | 0 | 33 | 0 |
| Quadrant | Total seconds | Saturated seconds | Saturation percentage |
|---|---|---|---|
| A | 4964 | 319 | 6.426269% |
| B | 4964 | 87 | 1.752619% |
| C | 4964 | 11 | 0.221595% |
| D | 4964 | 274 | 5.519742% |
Noise dominated data is calculated using 1-second bins in cleaned event files. If a bin has >2000 counts, and if more than 50% of those come from <1% of pixels, then it is considered to be noise-dominated and hence unusable.
| Quadrant | # 1 sec bins | Bins with >0 counts | Bins with >2000 counts | High rate bins dominated by noise | Noise dominated (total time) | Noise dominated (detector-on time) | Marked lightcurve |
|---|---|---|---|---|---|---|---|
| A | 6996 | 4964 | 255 | 255 | 3.64% | 5.14% | 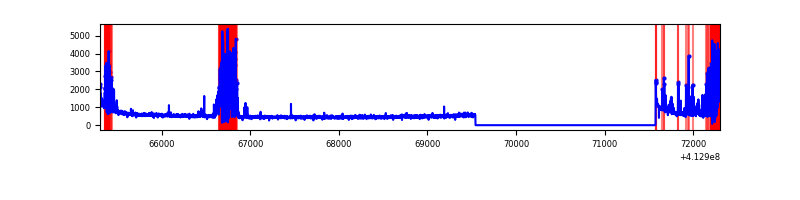 |
| B | 6997 | 4965 | 49 | 49 | 0.70% | 0.99% | 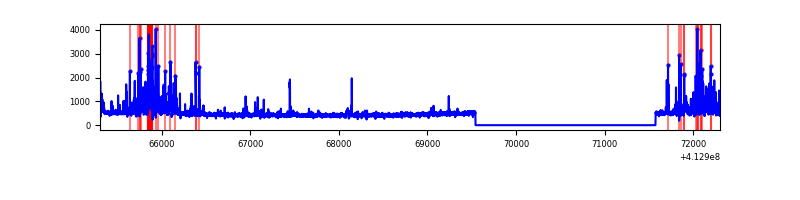 |
| C | 6997 | 4965 | 7 | 7 | 0.10% | 0.14% | 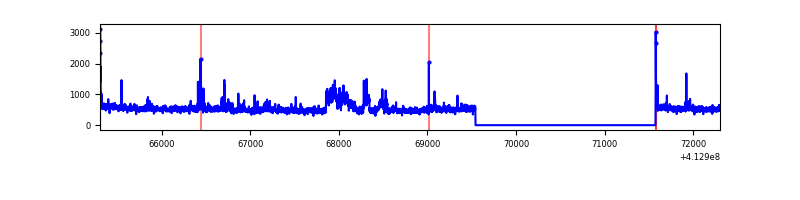 |
| D | 6997 | 4965 | 261 | 261 | 3.73% | 5.26% | 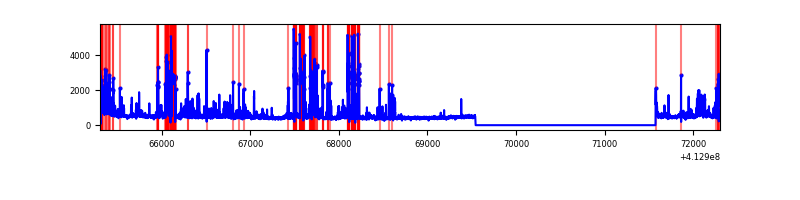 |
Top three noisy pixels from each quadrant. If the there are fewer than three noisy pixels in the level2.evt file, extra rows are filled as -1
| Pixel properties | Quadrant properties | ||||||
|---|---|---|---|---|---|---|---|
| Quadrant | DetID | PixID | Counts | Sigma | Mean | Median | Sigma |
| A | 15 | 174 | 704018 | 6392.68 | 544 | 533 | 110.0 |
| A | 10 | 83 | 424985 | 3857.06 | 544 | 533 | 110.0 |
| A | 13 | 248 | 221117 | 2004.48 | 544 | 533 | 110.0 |
| B | 5 | 172 | 378871 | 3488.94 | 562 | 548 | 108.4 |
| B | 5 | 255 | 68174 | 623.65 | 562 | 548 | 108.4 |
| B | 4 | 67 | 31184 | 282.53 | 562 | 548 | 108.4 |
| C | 15 | 208 | 275032 | 2114.91 | 555 | 559 | 129.8 |
| C | 15 | 214 | 206613 | 1587.72 | 555 | 559 | 129.8 |
| C | 9 | 187 | 73734 | 563.84 | 555 | 559 | 129.8 |
| D | 12 | 227 | 950136 | 7226.41 | 536 | 521 | 131.4 |
| D | 12 | 233 | 141734 | 1074.61 | 536 | 521 | 131.4 |
| D | 12 | 218 | 56403 | 425.25 | 536 | 521 | 131.4 |
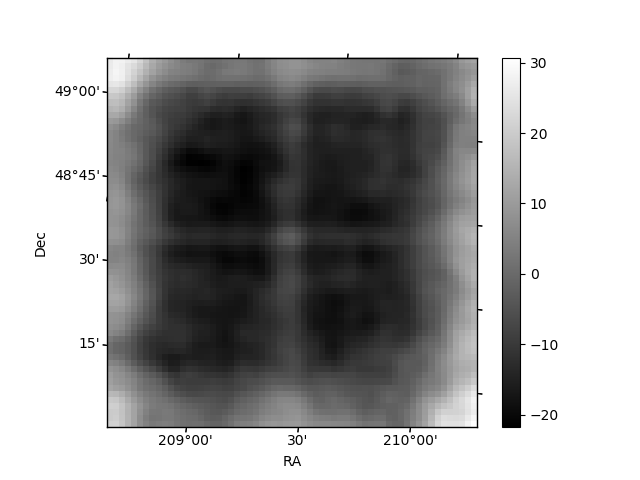
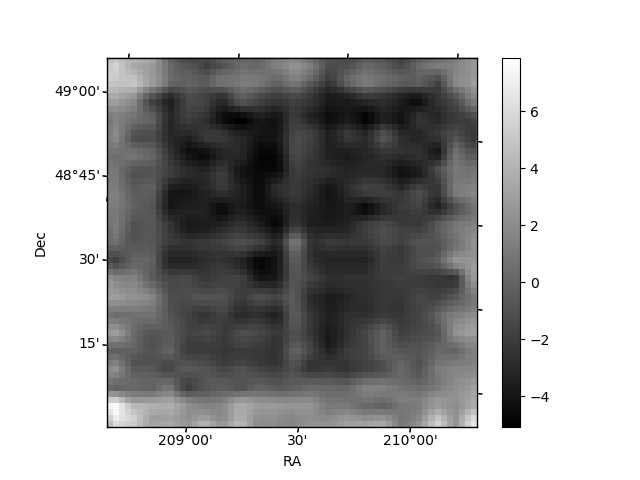
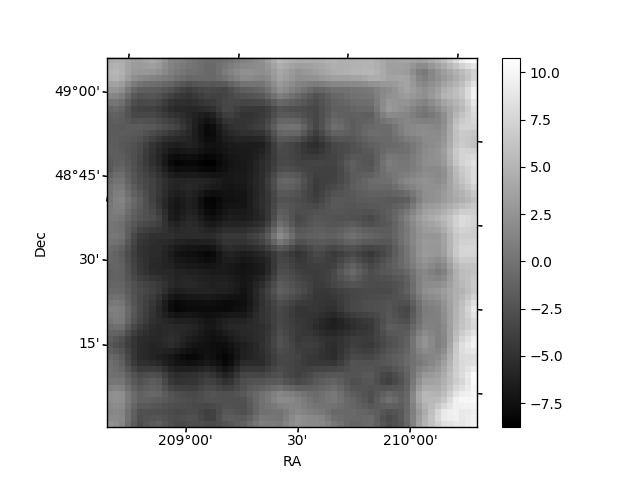
Histogram calculated using DETX and DETY for each event in the final _common_clean file
| Quadrant A | 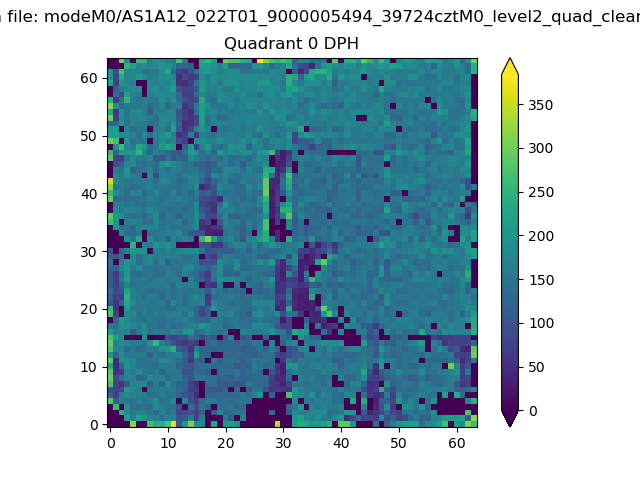 |
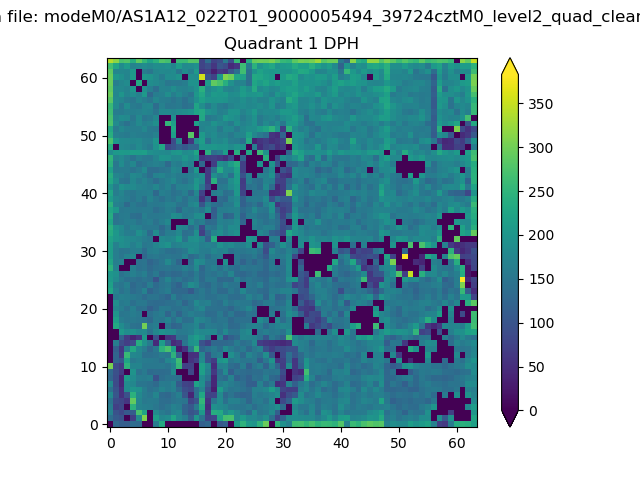 |
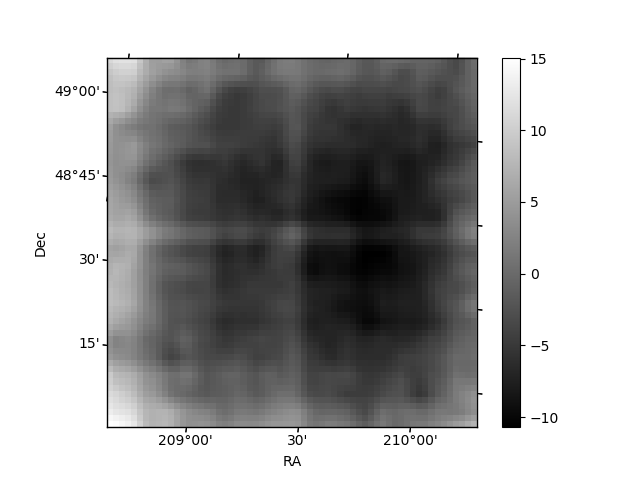
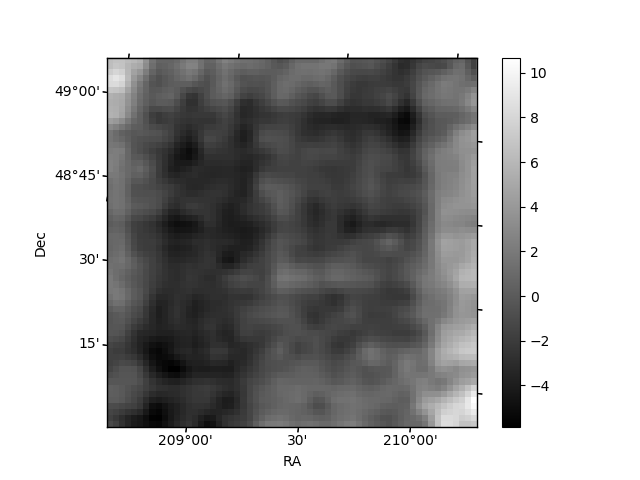
Quadrant B |
|---|---|---|---|
| Quadrant D | 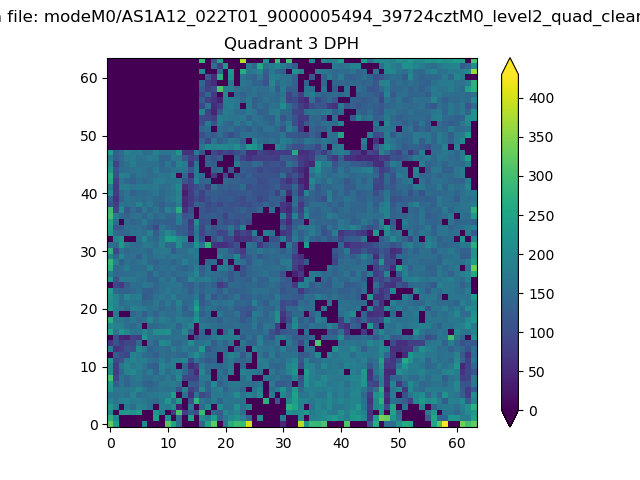 |
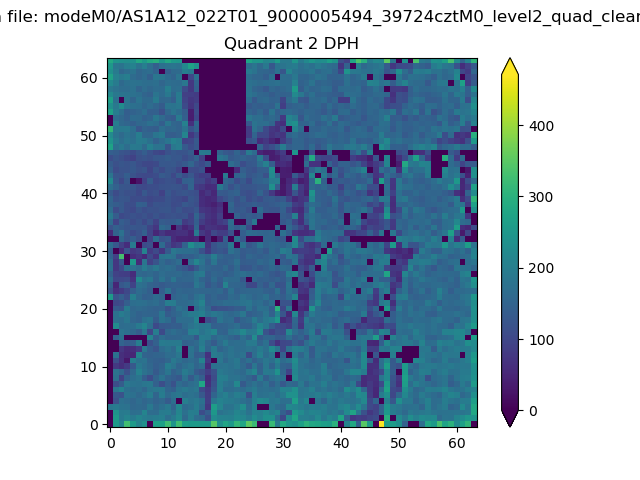 |
Quadrant C |
| Plot type | Count rate plots | Images |
|---|---|---|
| Comparison with Poisson distribution Blue bars denote a histogram of data divided into 1 sec bins. Red curve is a Poisson curve with rate = median count rate of data. |
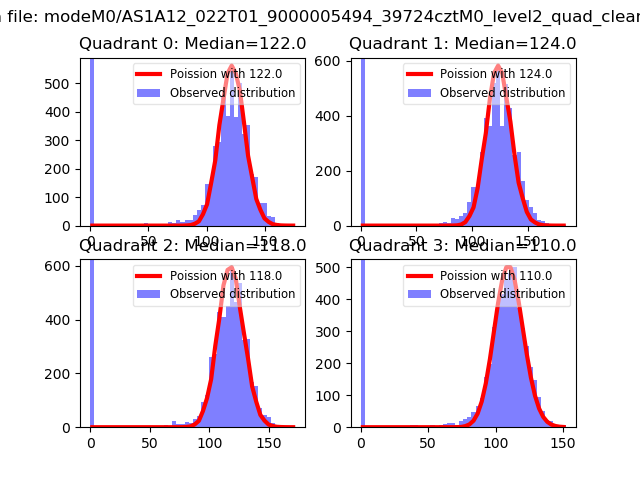 |
 |
| Quadrant-wise count rates Data is divided into 100 sec bins |
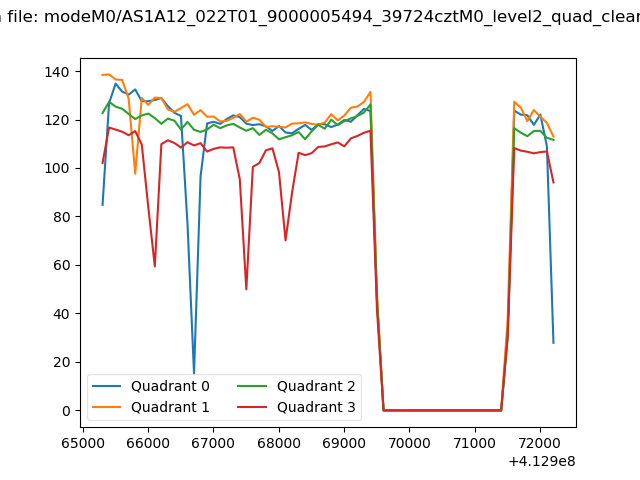 |
|
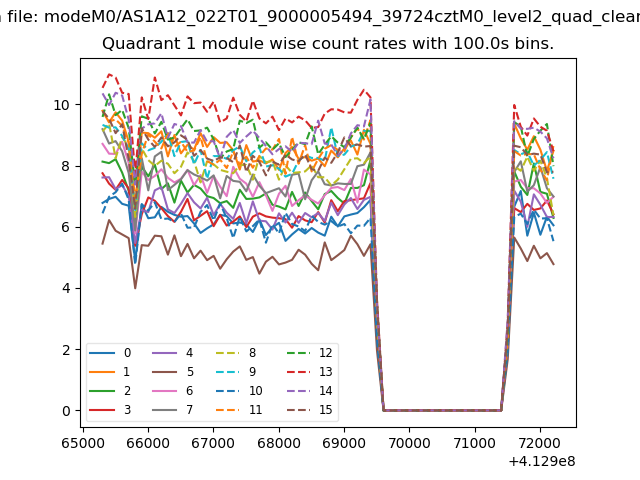
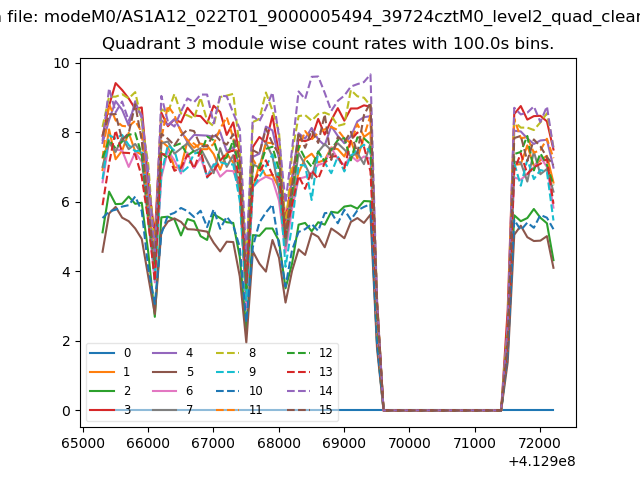
| Module-wise count rates for Quadrant A Data is divided into 100 sec bins |
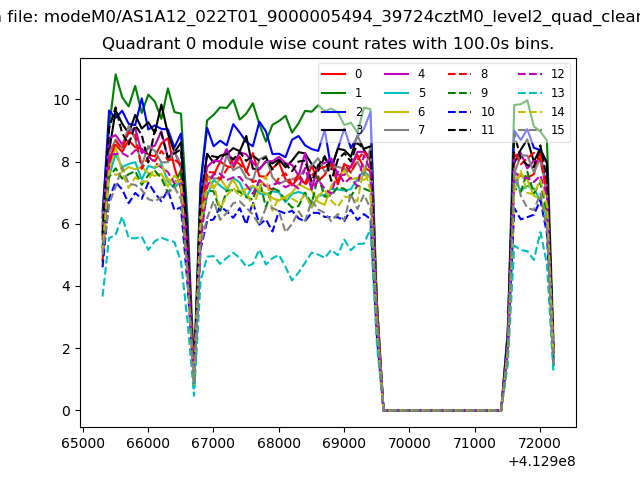 |
 |
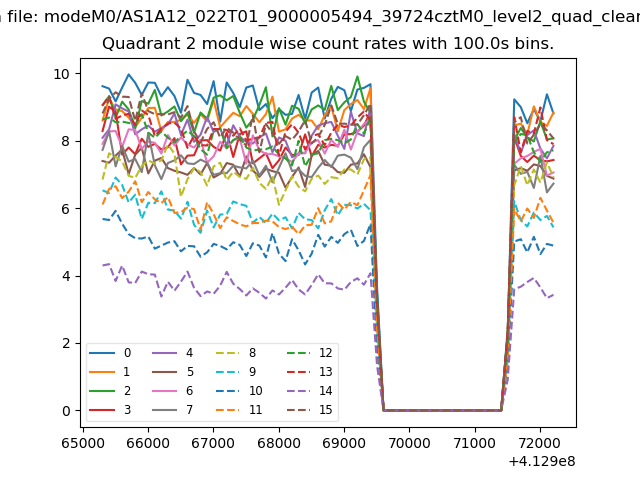
| Module-wise count rates for Quadrant B Data is divided into 100 sec bins |
 |
 |
| Module-wise count rates for Quadrant C Data is divided into 100 sec bins |
 |
 |
| Module-wise count rates for Quadrant D Data is divided into 100 sec bins |
 |
 |
| Parameter | Plot |
|---|---|
| CZT HV Monitor | 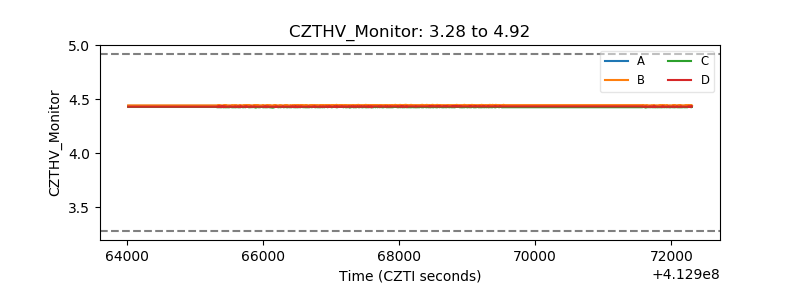 |
| D_VDD | 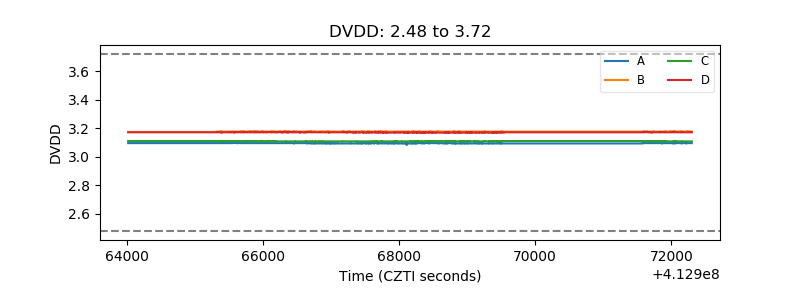 |
| Temperature 1 | 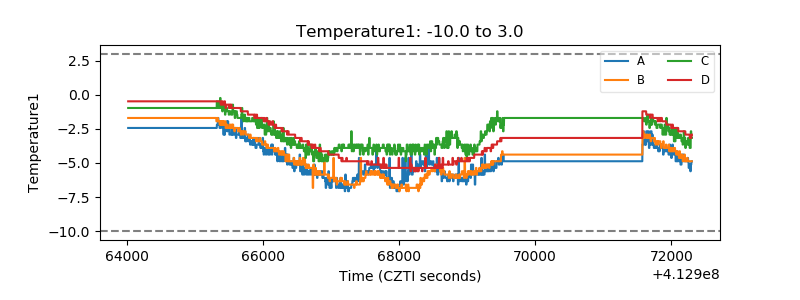 |
| Veto HV Monitor | 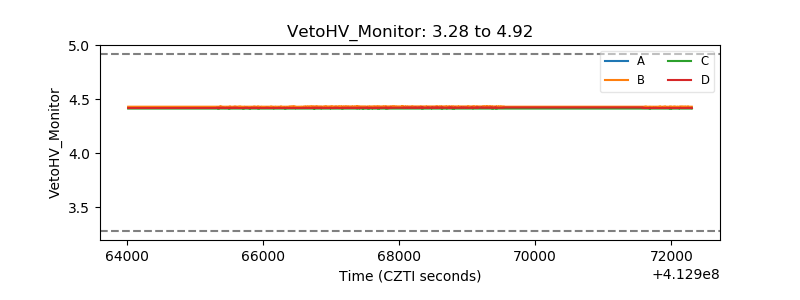 |
| Veto LLD | 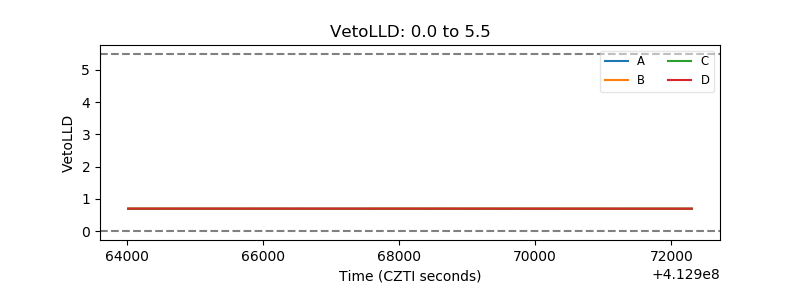 |
| Alpha Counter | 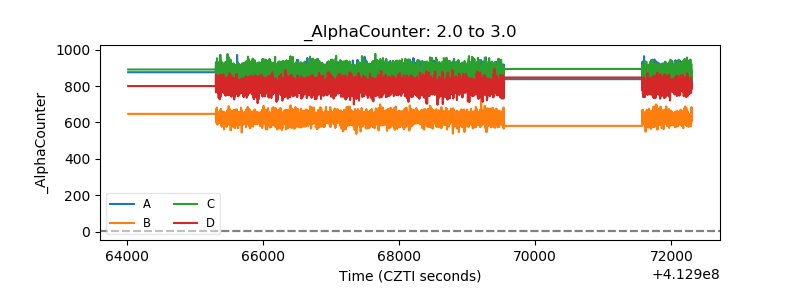 |
| _CPM_Rate | 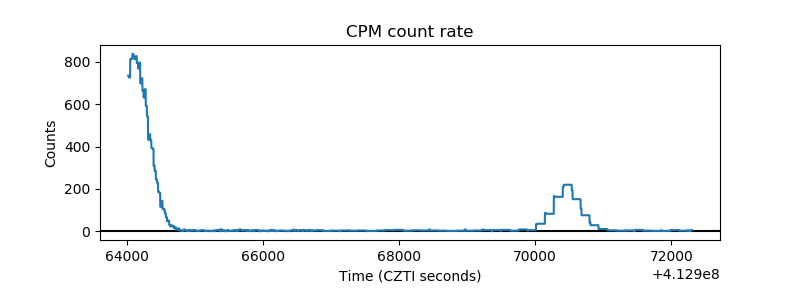 |
| CZT Counter | 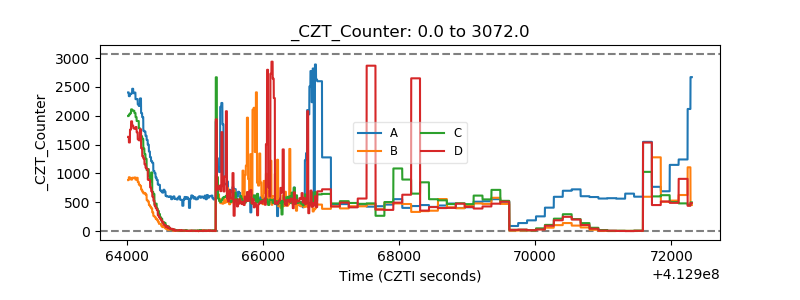 |
| +2.5 Volts monitor | 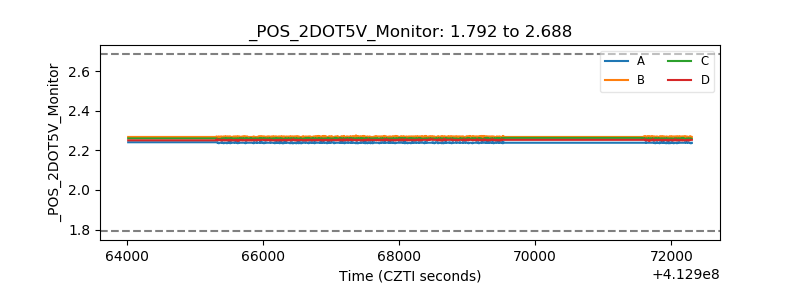 |
| +5 Volts monitor | 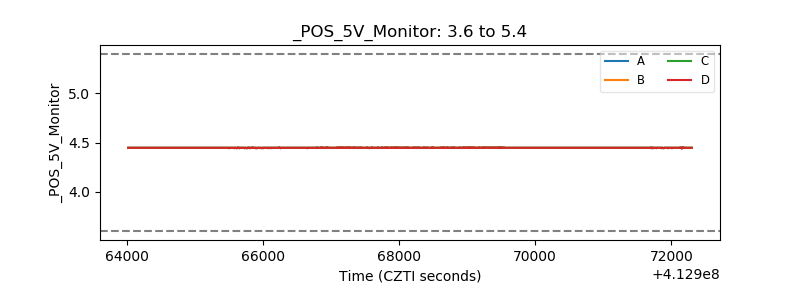 |
| _ROLL_ROT | 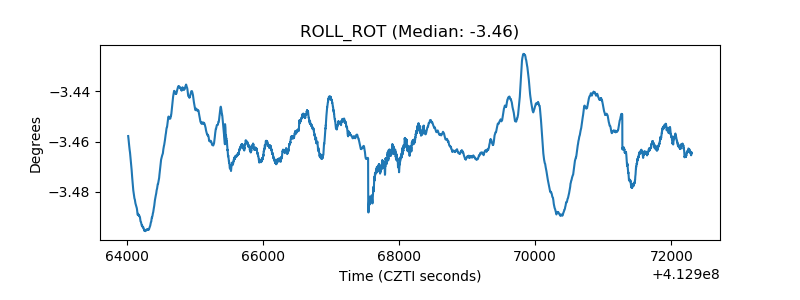 |
| _Roll_DEC | 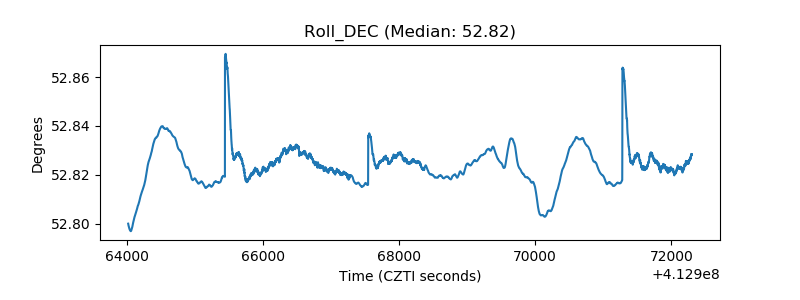 |
| _Roll_RA | 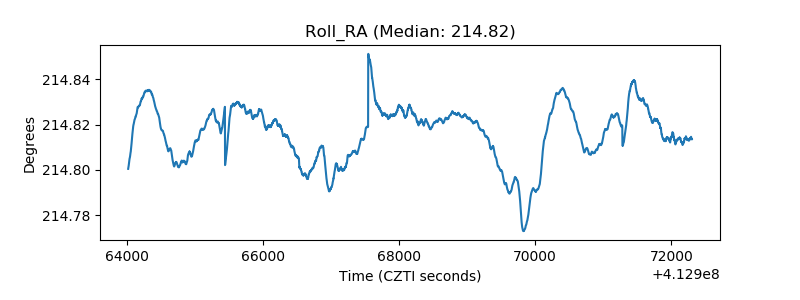 |
| Veto Counter | 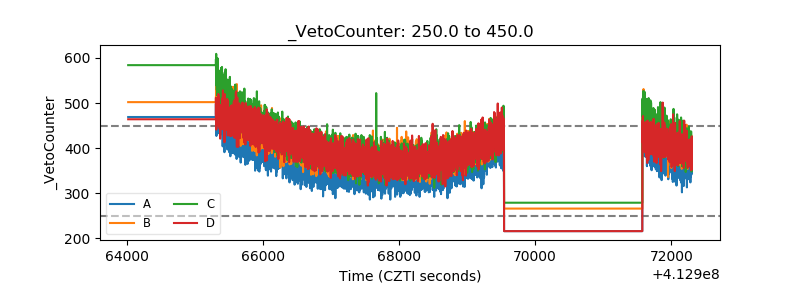 |