| Param | Original file | Final file |
|---|---|---|
| Filename | modeM0/AS1A12_022T01_9000005494_39725cztM0_level2.fits | modeM0/AS1A12_022T01_9000005494_39725cztM0_level2_quad_clean.evt |
| Size (bytes) | 398,908,800 | 87,842,880 |
| Size | 380.4 MB | 83.8 MB |
| Events in quadrant A | 3,541,958 | 576,445 |
| Events in quadrant B | 3,240,308 | 614,561 |
| Events in quadrant C | 3,396,772 | 590,099 |
| Events in quadrant D | 4,176,925 | 509,587 |
| Mode SS | |||
|---|---|---|---|
| Quadrant | BADHDUFLAG | Total packets | Discarded packets |
| A | 0 | 106 | 0 |
| B | 0 | 106 | 0 |
| C | 0 | 106 | 0 |
| D | 0 | 106 | 0 |
| Mode M0 | |||
|---|---|---|---|
| Quadrant | BADHDUFLAG | Total packets | Discarded packets |
| A | 0 | 13979 | 3 |
| B | 0 | 13251 | 2 |
| C | 0 | 13532 | 2 |
| D | 0 | 16071 | 2 |
| Mode M9 | |||
|---|---|---|---|
| Quadrant | BADHDUFLAG | Total packets | Discarded packets |
| A | 0 | 20 | 0 |
| B | 0 | 20 | 0 |
| C | 0 | 20 | 0 |
| D | 0 | 21 | 0 |
| Quadrant | Total seconds | Saturated seconds | Saturation percentage |
|---|---|---|---|
| A | 5276 | 339 | 6.425322% |
| B | 5276 | 104 | 1.971190% |
| C | 5276 | 88 | 1.667930% |
| D | 5276 | 495 | 9.382108% |
Noise dominated data is calculated using 1-second bins in cleaned event files. If a bin has >2000 counts, and if more than 50% of those come from <1% of pixels, then it is considered to be noise-dominated and hence unusable.
| Quadrant | # 1 sec bins | Bins with >0 counts | Bins with >2000 counts | High rate bins dominated by noise | Noise dominated (total time) | Noise dominated (detector-on time) | Marked lightcurve |
|---|---|---|---|---|---|---|---|
| A | 7038 | 5277 | 257 | 257 | 3.65% | 4.87% | 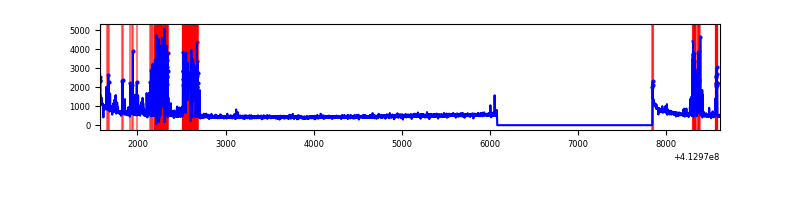 |
| B | 7038 | 5277 | 50 | 50 | 0.71% | 0.95% | 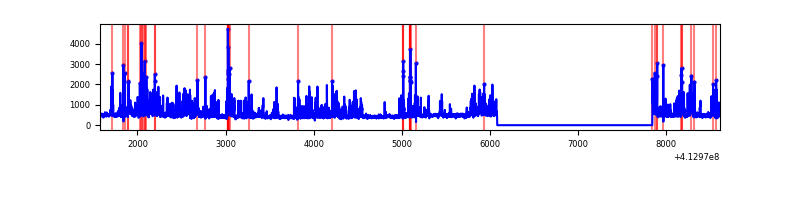 |
| C | 7038 | 5277 | 67 | 67 | 0.95% | 1.27% | 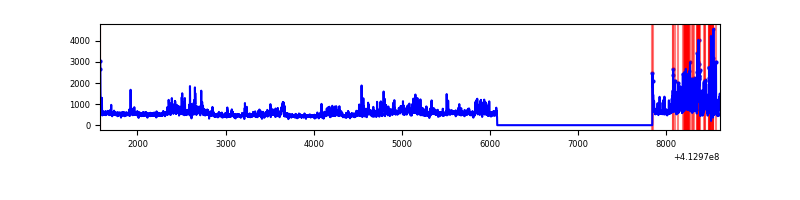 |
| D | 7038 | 5277 | 435 | 435 | 6.18% | 8.24% | 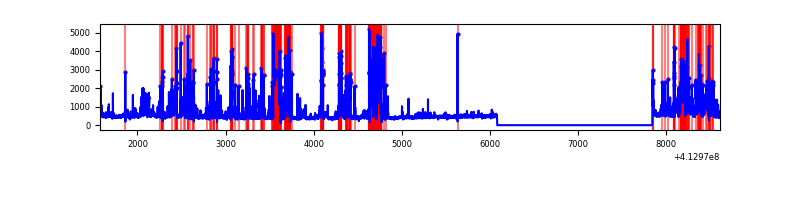 |
Top three noisy pixels from each quadrant. If the there are fewer than three noisy pixels in the level2.evt file, extra rows are filled as -1
| Pixel properties | Quadrant properties | ||||||
|---|---|---|---|---|---|---|---|
| Quadrant | DetID | PixID | Counts | Sigma | Mean | Median | Sigma |
| A | 15 | 174 | 696237 | 6108.63 | 562 | 552 | 113.9 |
| A | 10 | 83 | 441811 | 3874.58 | 562 | 552 | 113.9 |
| A | 13 | 248 | 222299 | 1947.1 | 562 | 552 | 113.9 |
| B | 5 | 172 | 845043 | 7537.58 | 576 | 560 | 112.0 |
| B | 5 | 255 | 47231 | 416.57 | 576 | 560 | 112.0 |
| B | 4 | 67 | 30010 | 262.86 | 576 | 560 | 112.0 |
| C | 9 | 187 | 511780 | 3840.18 | 569 | 572 | 133.1 |
| C | 15 | 208 | 410464 | 3079.1 | 569 | 572 | 133.1 |
| C | 15 | 214 | 218996 | 1640.79 | 569 | 572 | 133.1 |
| D | 12 | 227 | 1268671 | 9536.47 | 540 | 525 | 133.0 |
| D | 2 | 250 | 259618 | 1948.38 | 540 | 525 | 133.0 |
| D | 12 | 233 | 199147 | 1493.64 | 540 | 525 | 133.0 |
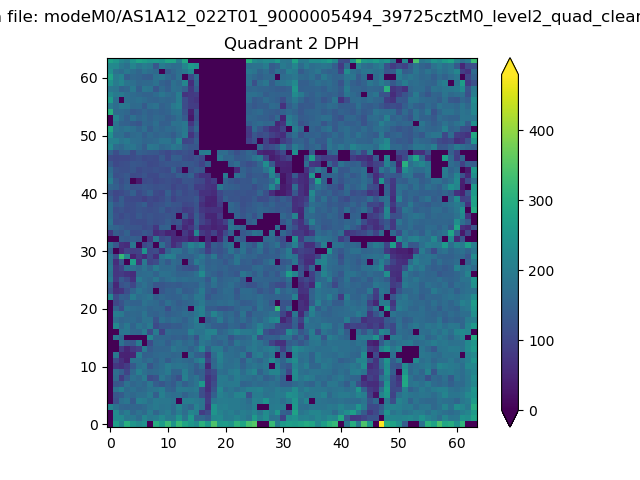
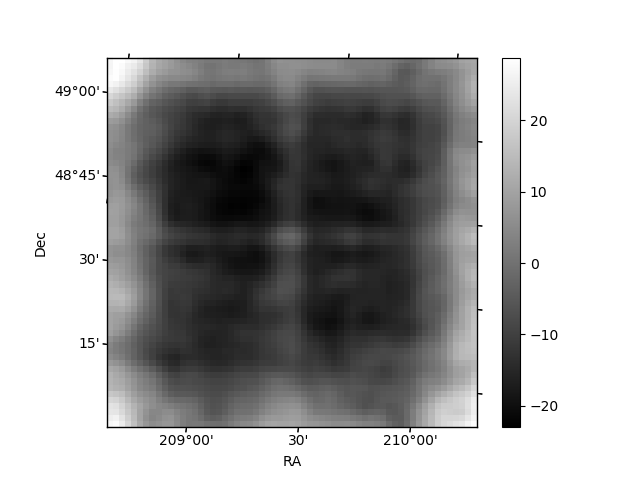
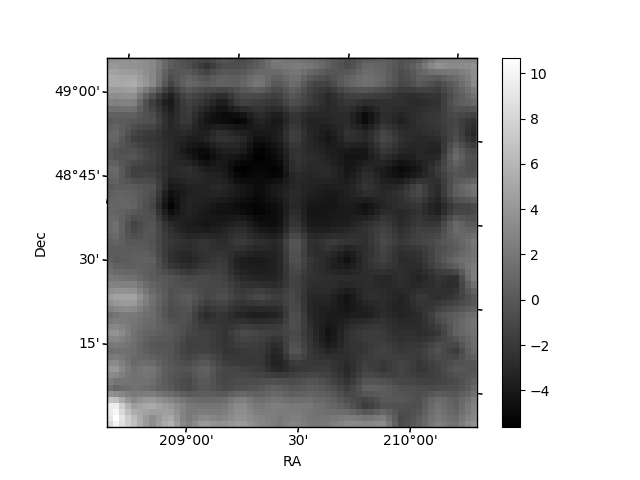
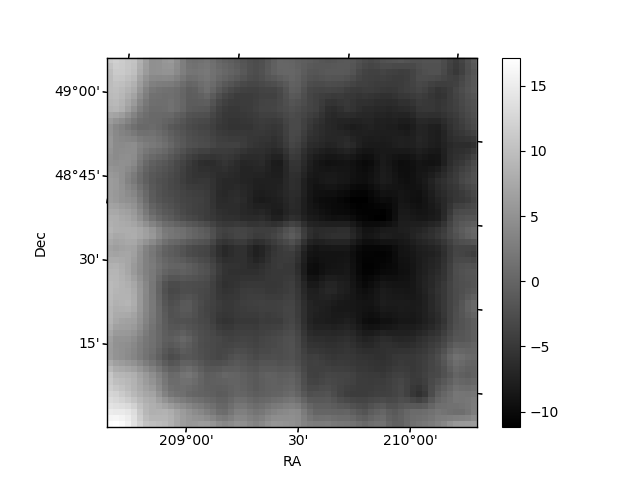
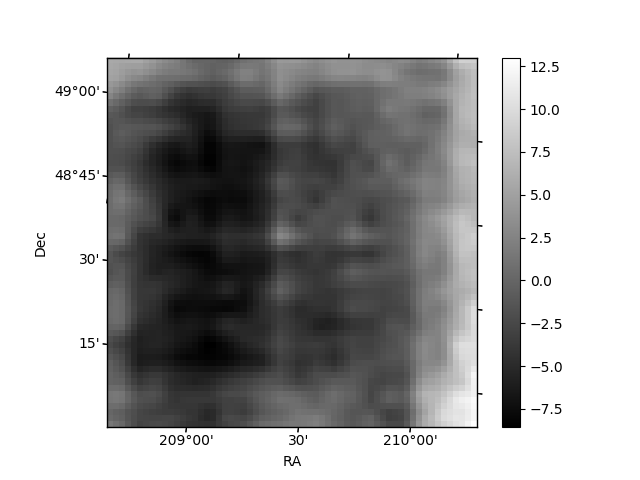
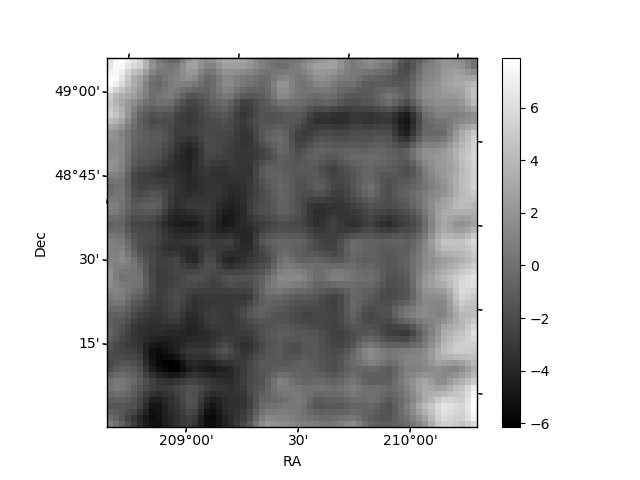
Histogram calculated using DETX and DETY for each event in the final _common_clean file
| Quadrant A | 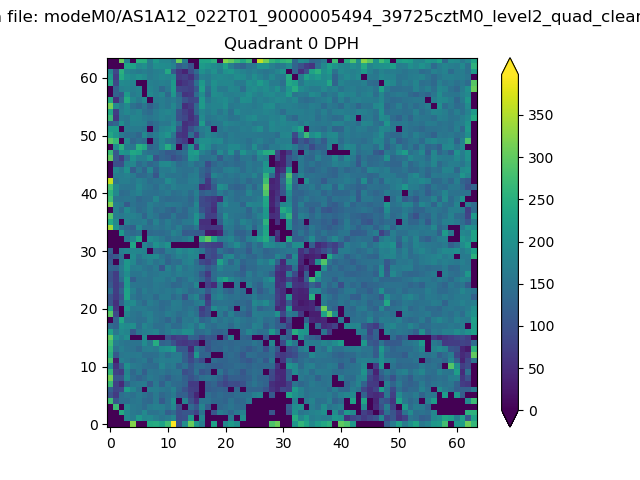 |
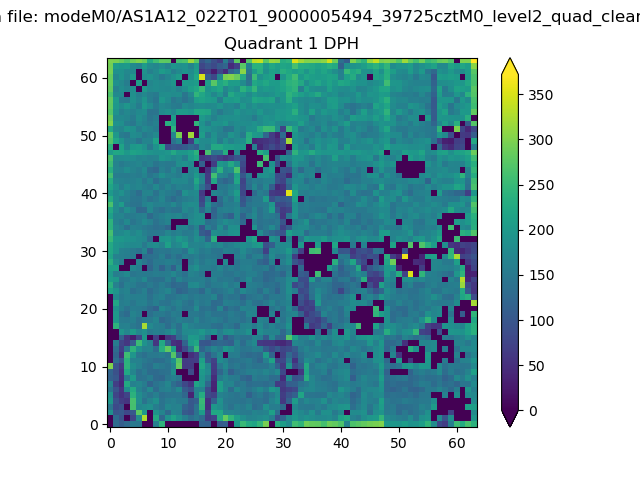 |
Quadrant B |
|---|---|---|---|
| Quadrant D | 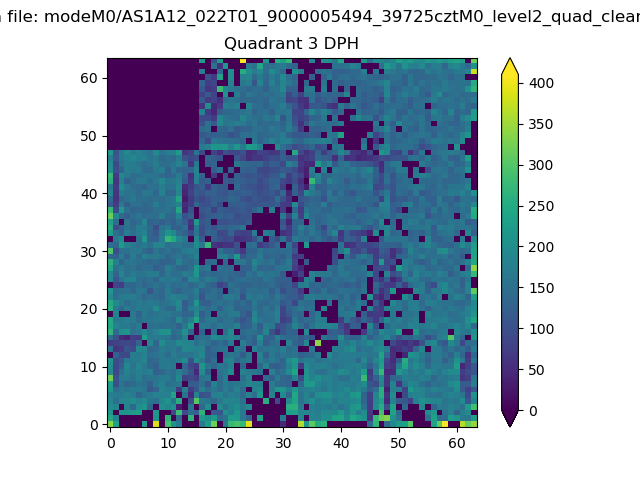 |
 |
Quadrant C |
| Plot type | Count rate plots | Images |
|---|---|---|
| Comparison with Poisson distribution Blue bars denote a histogram of data divided into 1 sec bins. Red curve is a Poisson curve with rate = median count rate of data. |
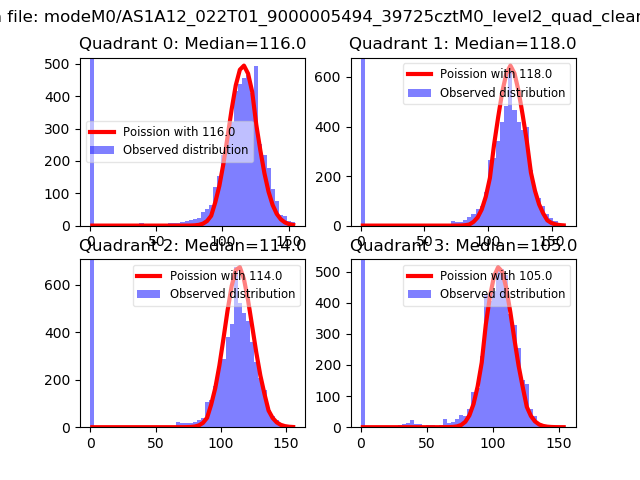 |
 |
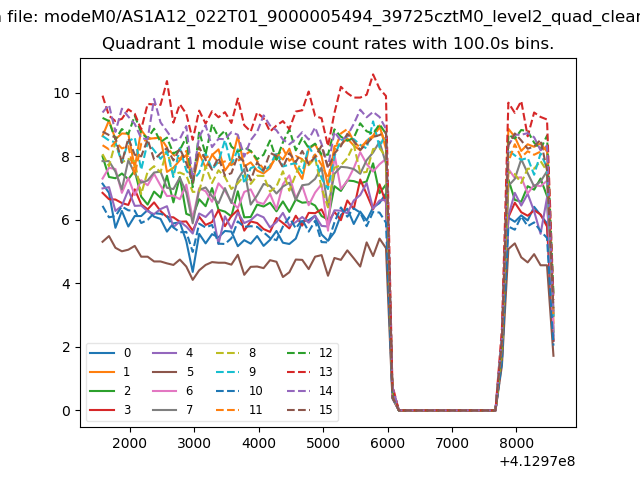
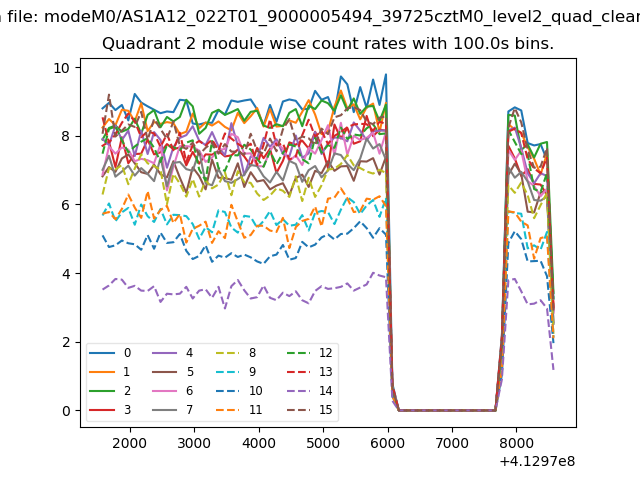
| Quadrant-wise count rates Data is divided into 100 sec bins |
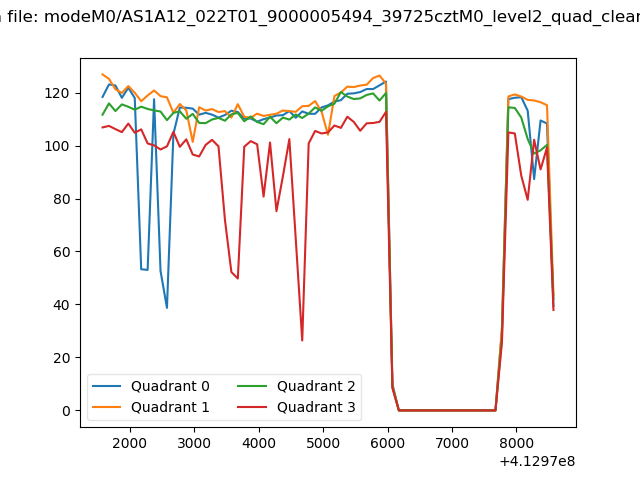 |
|
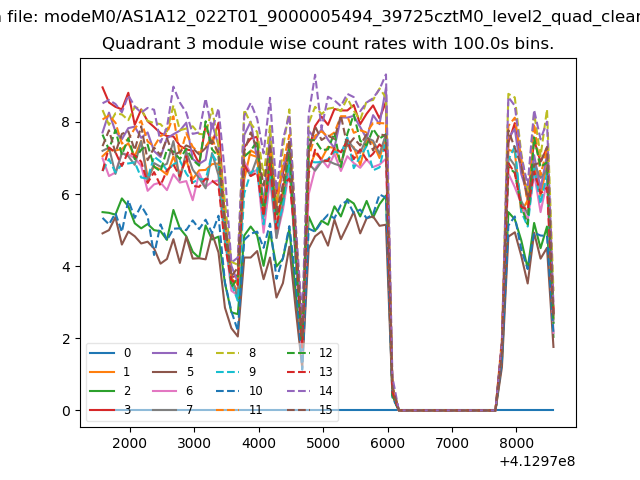
| Module-wise count rates for Quadrant A Data is divided into 100 sec bins |
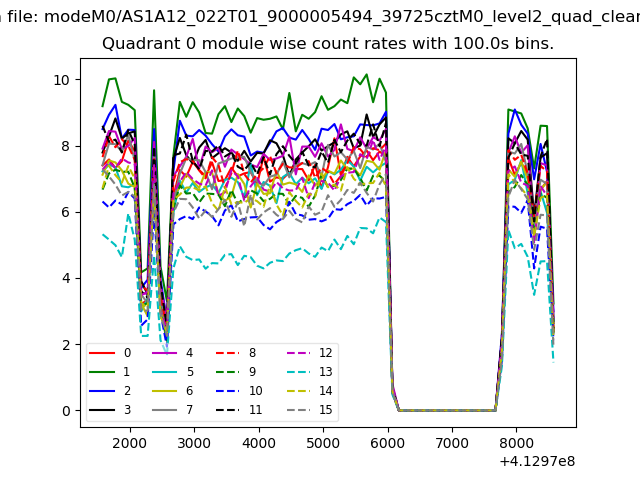 |
 |
| Module-wise count rates for Quadrant B Data is divided into 100 sec bins |
 |
 |
| Module-wise count rates for Quadrant C Data is divided into 100 sec bins |
 |
 |
| Module-wise count rates for Quadrant D Data is divided into 100 sec bins |
 |
 |
| Parameter | Plot |
|---|---|
| CZT HV Monitor | 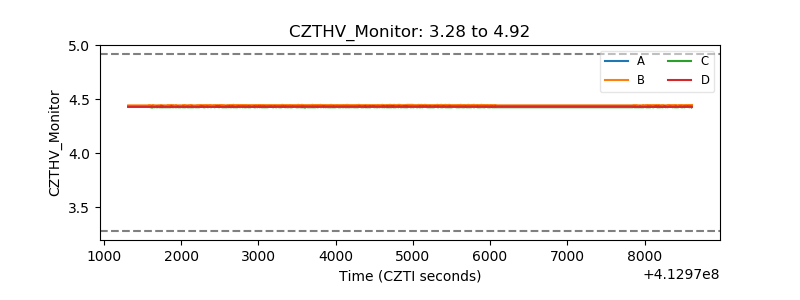 |
| D_VDD | 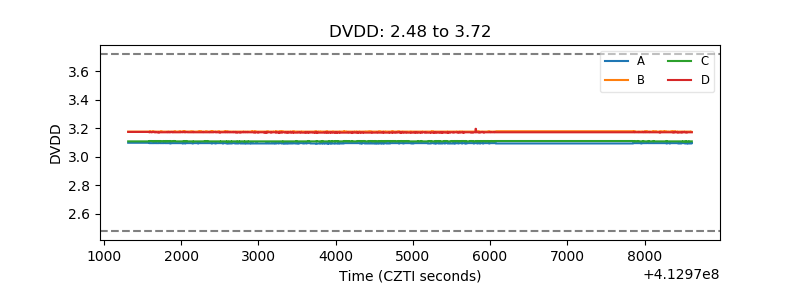 |
| Temperature 1 | 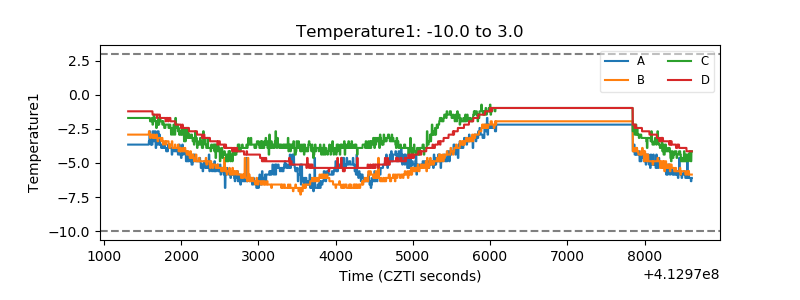 |
| Veto HV Monitor | 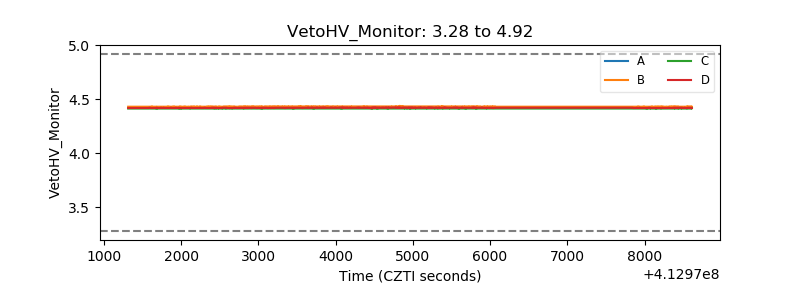 |
| Veto LLD | 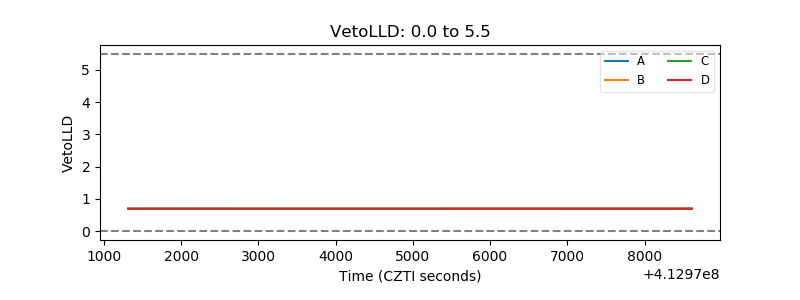 |
| Alpha Counter | 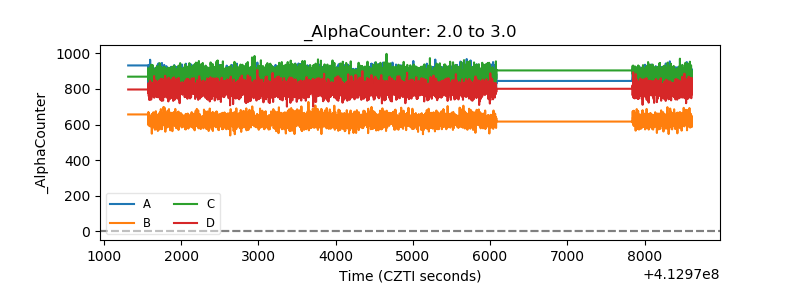 |
| _CPM_Rate | 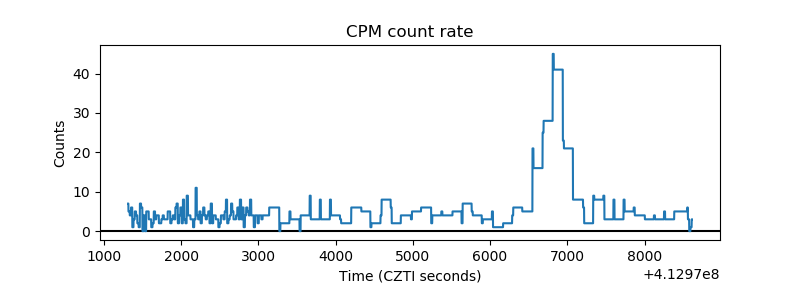 |
| CZT Counter | 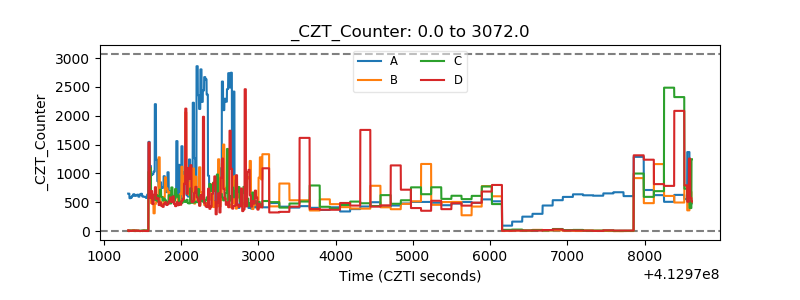 |
| +2.5 Volts monitor | 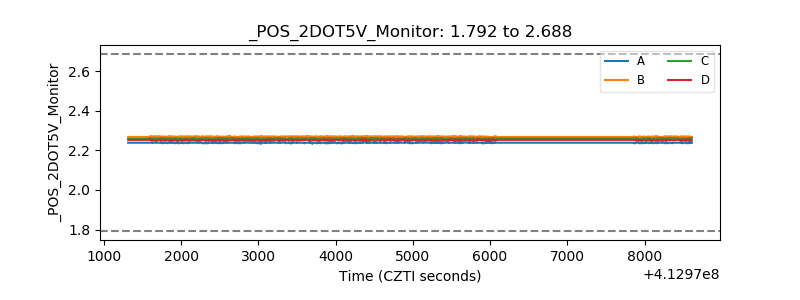 |
| +5 Volts monitor | 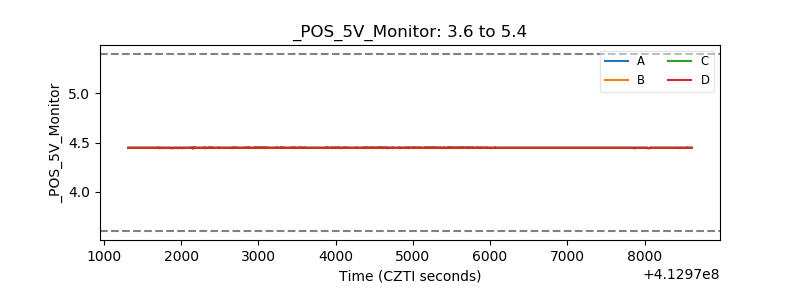 |
| _ROLL_ROT | 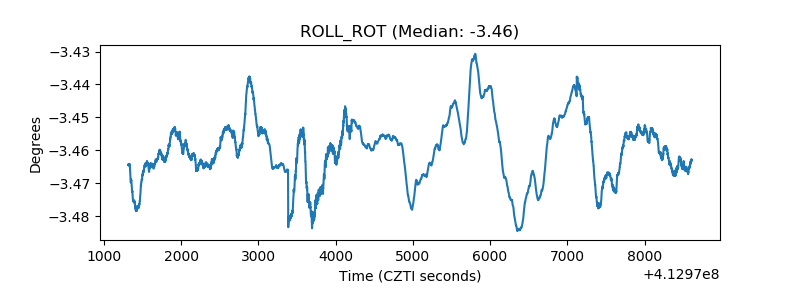 |
| _Roll_DEC | 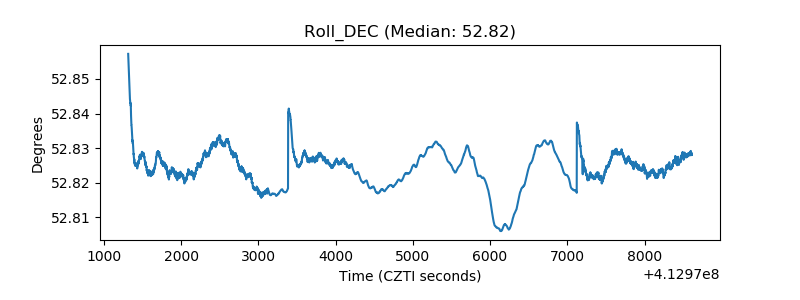 |
| _Roll_RA | 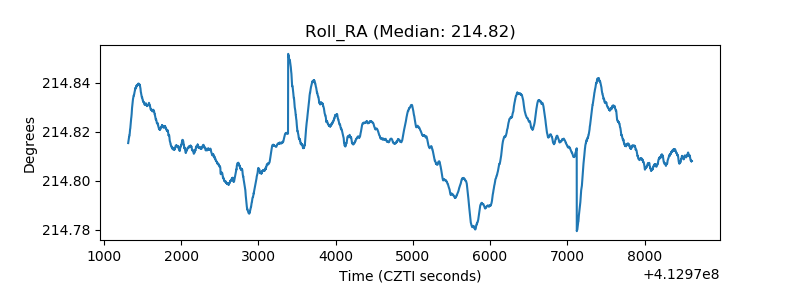 |
| Veto Counter | 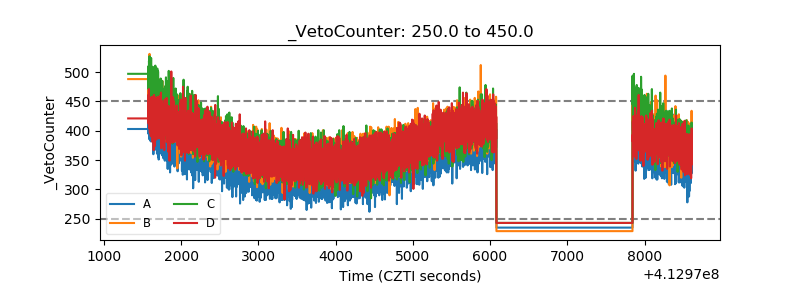 |