| Param | Original file | Final file |
|---|---|---|
| Filename | modeM0/AS1A12_022T01_9000005494_39726cztM0_level2.fits | modeM0/AS1A12_022T01_9000005494_39726cztM0_level2_quad_clean.evt |
| Size (bytes) | 401,863,680 | 94,746,240 |
| Size | 383.2 MB | 90.4 MB |
| Events in quadrant A | 3,430,242 | 629,256 |
| Events in quadrant B | 3,071,422 | 653,894 |
| Events in quadrant C | 4,229,435 | 621,618 |
| Events in quadrant D | 3,702,501 | 566,615 |
| Mode SS | |||
|---|---|---|---|
| Quadrant | BADHDUFLAG | Total packets | Discarded packets |
| A | 0 | 116 | 0 |
| B | 0 | 116 | 0 |
| C | 0 | 116 | 0 |
| D | 0 | 116 | 0 |
| Mode M0 | |||
|---|---|---|---|
| Quadrant | BADHDUFLAG | Total packets | Discarded packets |
| A | 0 | 13933 | 2 |
| B | 0 | 13040 | 1 |
| C | 0 | 16385 | 1 |
| D | 0 | 15045 | 1 |
| Mode M9 | |||
|---|---|---|---|
| Quadrant | BADHDUFLAG | Total packets | Discarded packets |
| A | 0 | 33 | 0 |
| B | 0 | 33 | 0 |
| C | 0 | 33 | 0 |
| D | 0 | 33 | 0 |
| Quadrant | Total seconds | Saturated seconds | Saturation percentage |
|---|---|---|---|
| A | 5690 | 155 | 2.724077% |
| B | 5690 | 59 | 1.036907% |
| C | 5690 | 118 | 2.073814% |
| D | 5690 | 209 | 3.673111% |
Noise dominated data is calculated using 1-second bins in cleaned event files. If a bin has >2000 counts, and if more than 50% of those come from <1% of pixels, then it is considered to be noise-dominated and hence unusable.
| Quadrant | # 1 sec bins | Bins with >0 counts | Bins with >2000 counts | High rate bins dominated by noise | Noise dominated (total time) | Noise dominated (detector-on time) | Marked lightcurve |
|---|---|---|---|---|---|---|---|
| A | 8914 | 5692 | 98 | 98 | 1.10% | 1.72% | 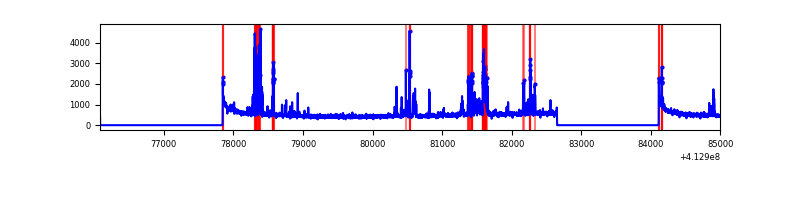 |
| B | 8914 | 5692 | 27 | 27 | 0.30% | 0.47% | 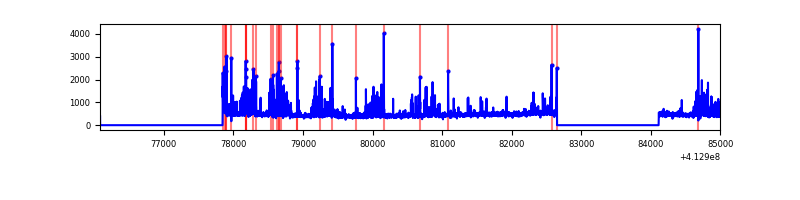 |
| C | 8914 | 5692 | 94 | 94 | 1.05% | 1.65% | 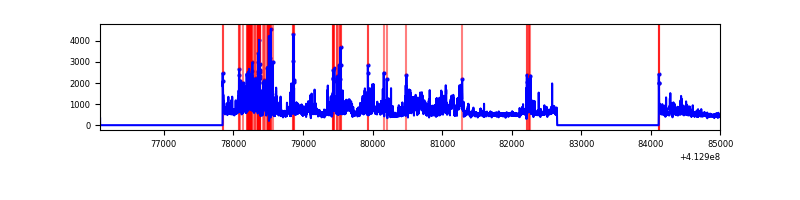 |
| D | 8914 | 5692 | 176 | 176 | 1.97% | 3.09% | 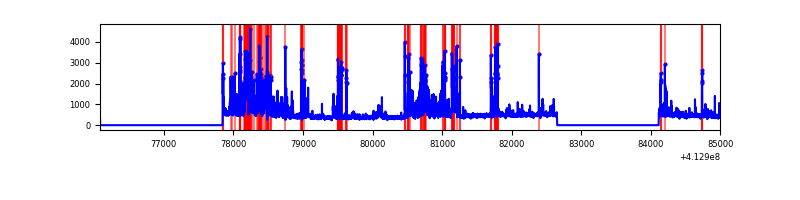 |
Top three noisy pixels from each quadrant. If the there are fewer than three noisy pixels in the level2.evt file, extra rows are filled as -1
| Pixel properties | Quadrant properties | ||||||
|---|---|---|---|---|---|---|---|
| Quadrant | DetID | PixID | Counts | Sigma | Mean | Median | Sigma |
| A | 10 | 83 | 457244 | 3623.49 | 619 | 605 | 126.0 |
| A | 15 | 174 | 412716 | 3270.15 | 619 | 605 | 126.0 |
| A | 13 | 248 | 130381 | 1029.79 | 619 | 605 | 126.0 |
| B | 5 | 172 | 482302 | 3956.43 | 620 | 603 | 121.8 |
| B | 5 | 255 | 89201 | 727.7 | 620 | 603 | 121.8 |
| B | 0 | 190 | 43044 | 348.59 | 620 | 603 | 121.8 |
| C | 15 | 208 | 1145415 | 8083.17 | 605 | 608 | 141.6 |
| C | 9 | 187 | 450864 | 3179.13 | 605 | 608 | 141.6 |
| C | 15 | 214 | 234180 | 1649.19 | 605 | 608 | 141.6 |
| D | 2 | 250 | 555531 | 3764.18 | 600 | 583 | 147.4 |
| D | 12 | 227 | 373059 | 2526.49 | 600 | 583 | 147.4 |
| D | 13 | 171 | 146766 | 991.55 | 600 | 583 | 147.4 |
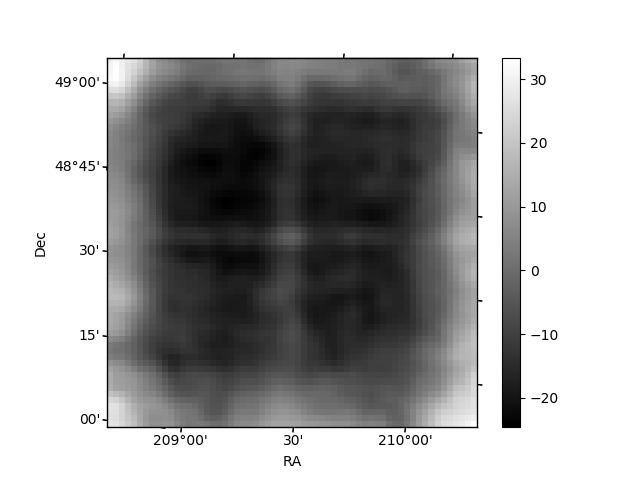
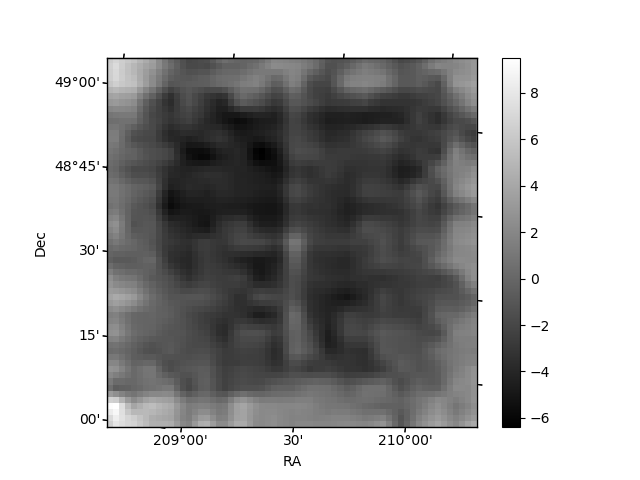
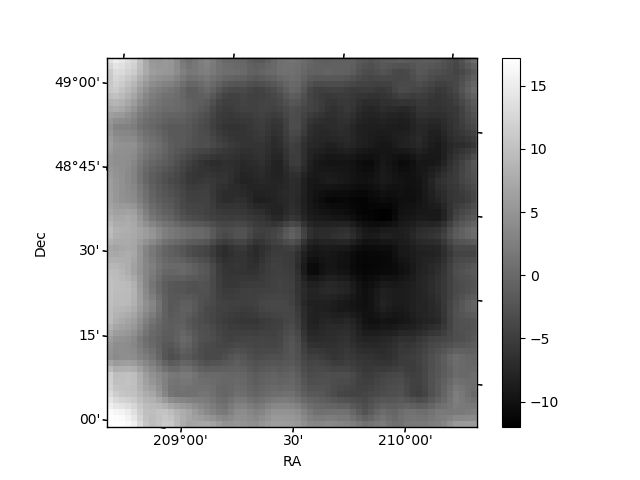
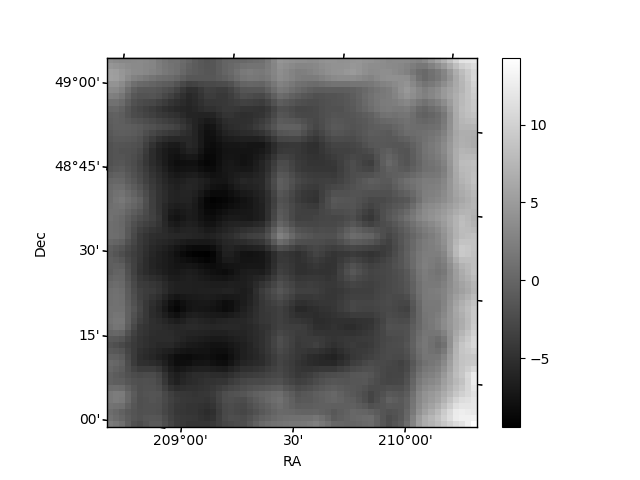
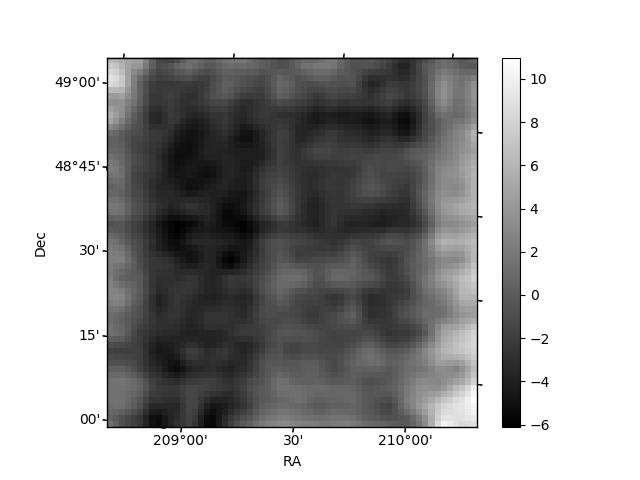
Histogram calculated using DETX and DETY for each event in the final _common_clean file
| Quadrant A | 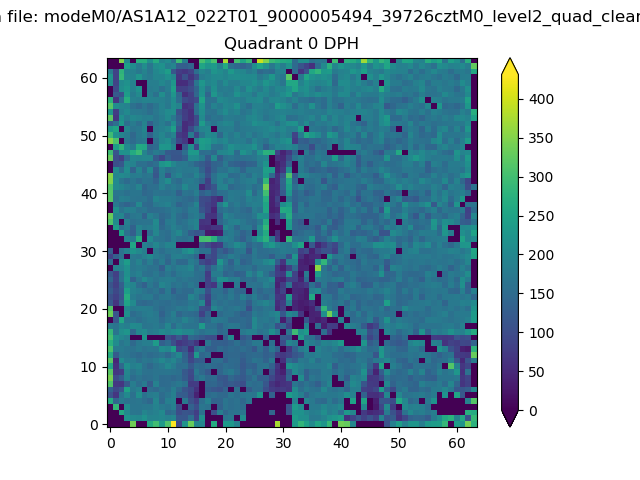 |
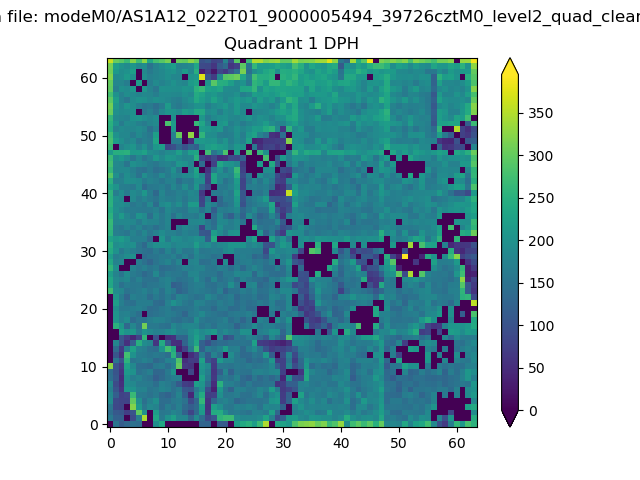 |
Quadrant B |
|---|---|---|---|
| Quadrant D | 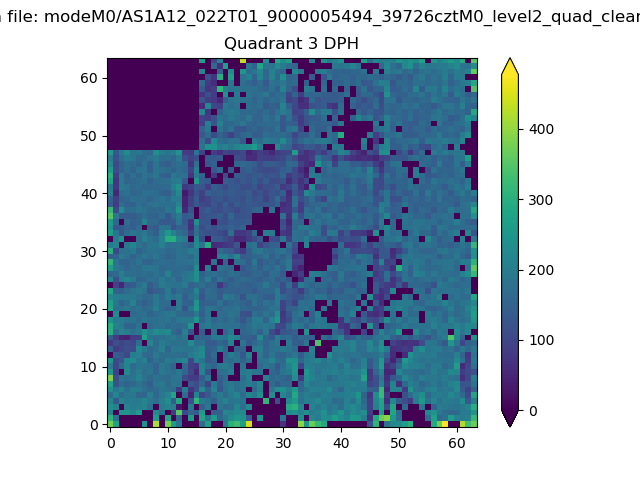 |
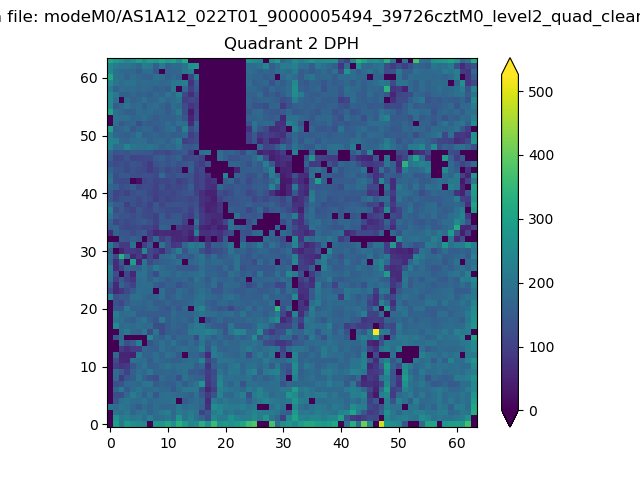 |
Quadrant C |
| Plot type | Count rate plots | Images |
|---|---|---|
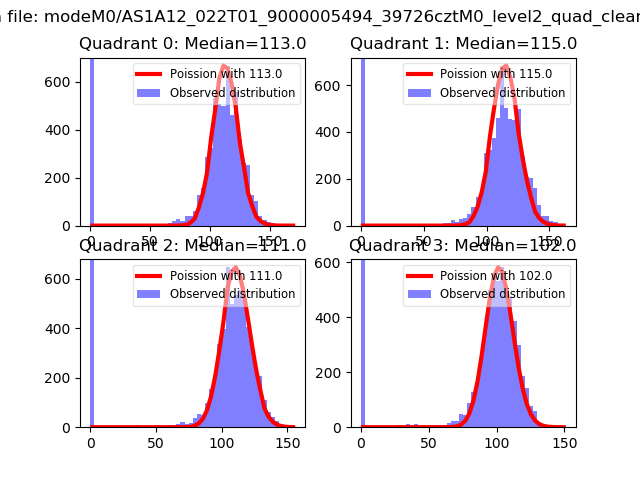
| Comparison with Poisson distribution Blue bars denote a histogram of data divided into 1 sec bins. Red curve is a Poisson curve with rate = median count rate of data. |
 |
 |
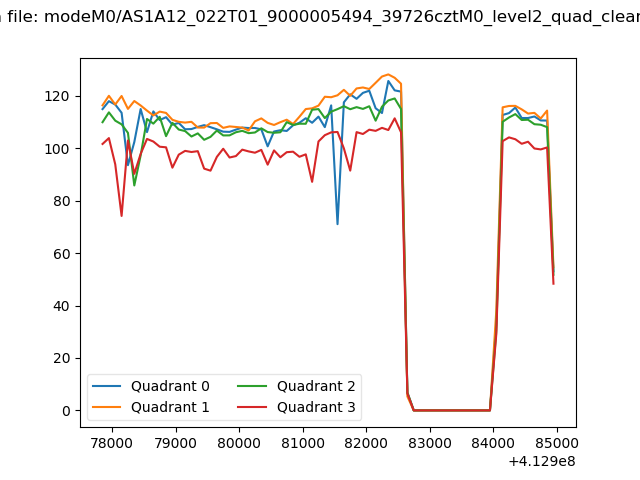
| Quadrant-wise count rates Data is divided into 100 sec bins |
 |
|
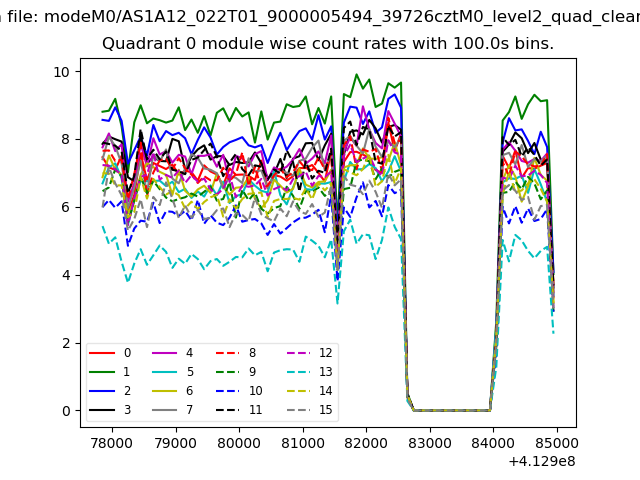
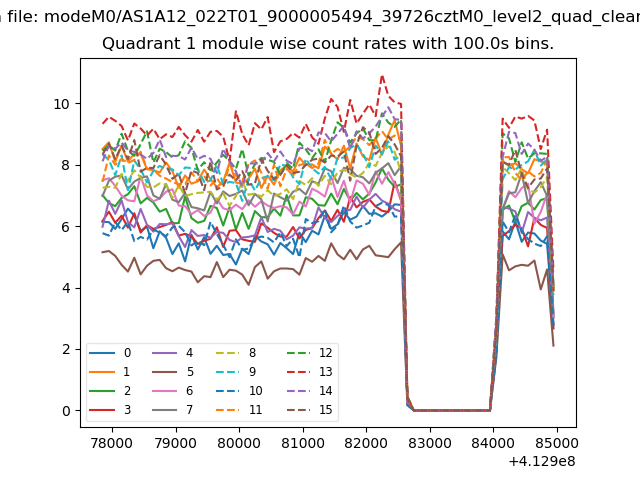
| Module-wise count rates for Quadrant A Data is divided into 100 sec bins |
 |
 |
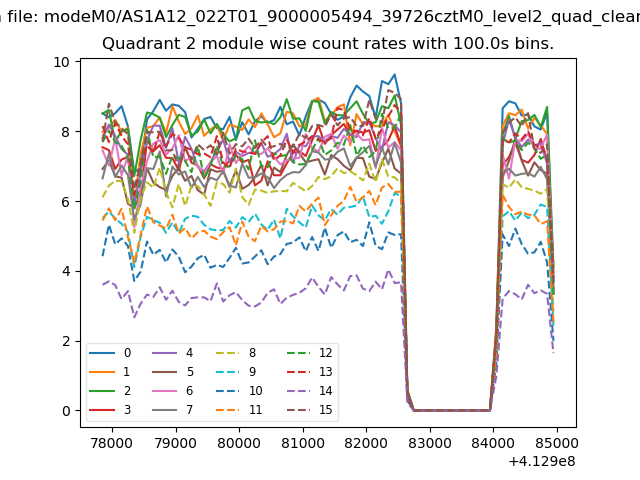
| Module-wise count rates for Quadrant B Data is divided into 100 sec bins |
 |
 |
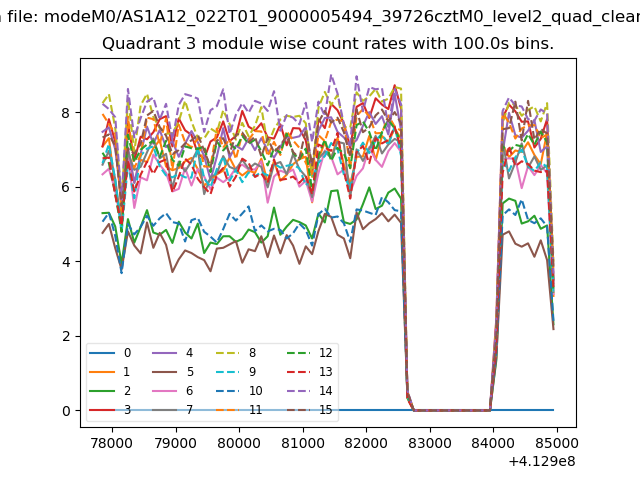
| Module-wise count rates for Quadrant C Data is divided into 100 sec bins |
 |
 |
| Module-wise count rates for Quadrant D Data is divided into 100 sec bins |
 |
 |
| Parameter | Plot |
|---|---|
| CZT HV Monitor | 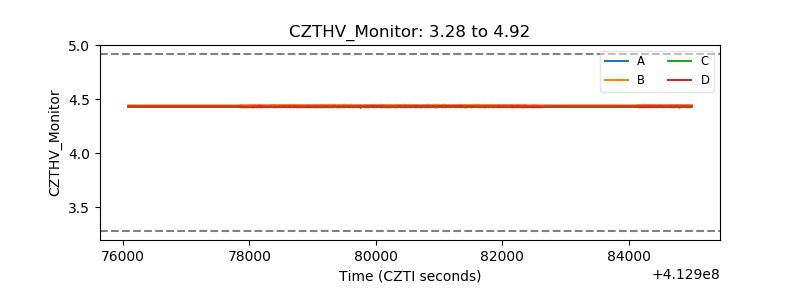 |
| D_VDD | 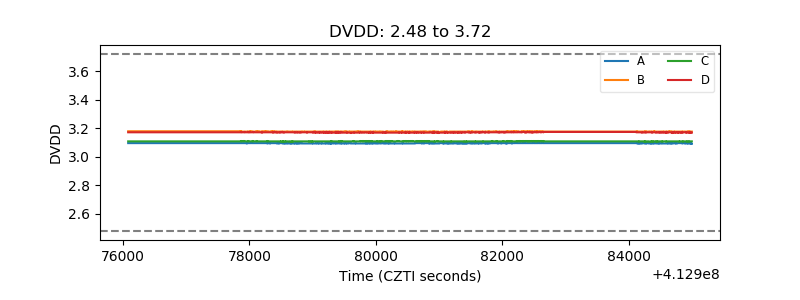 |
| Temperature 1 | 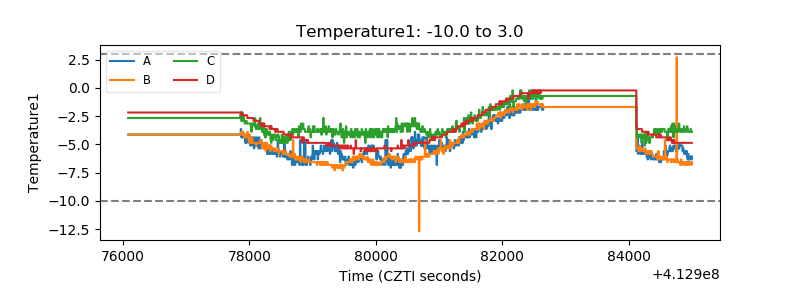 |
| Veto HV Monitor | 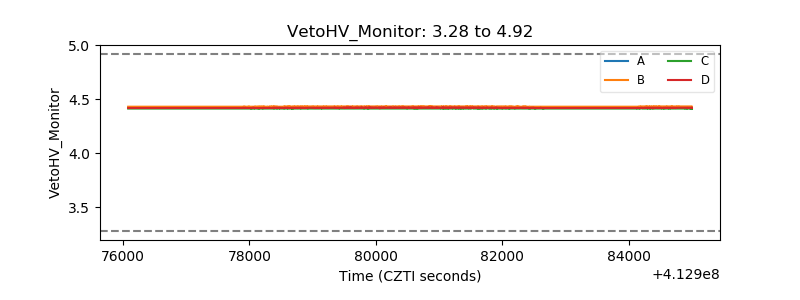 |
| Veto LLD | 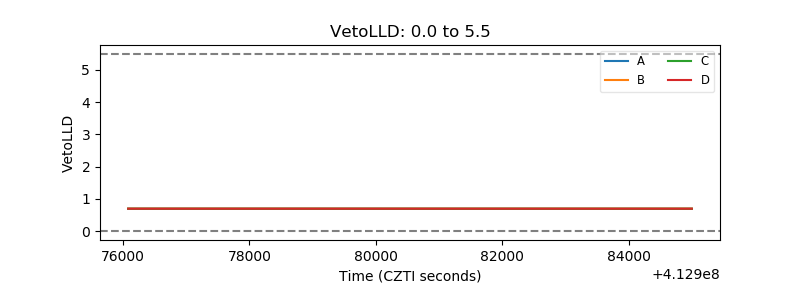 |
| Alpha Counter | 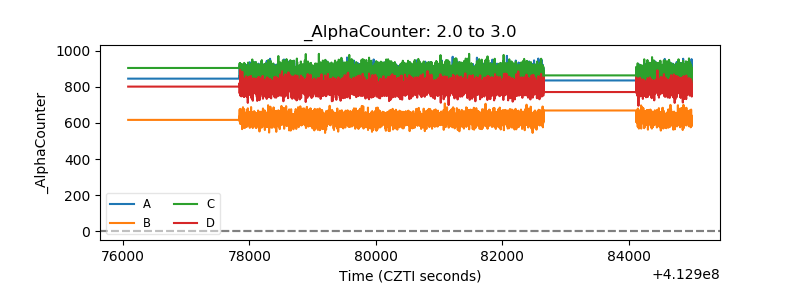 |
| _CPM_Rate | 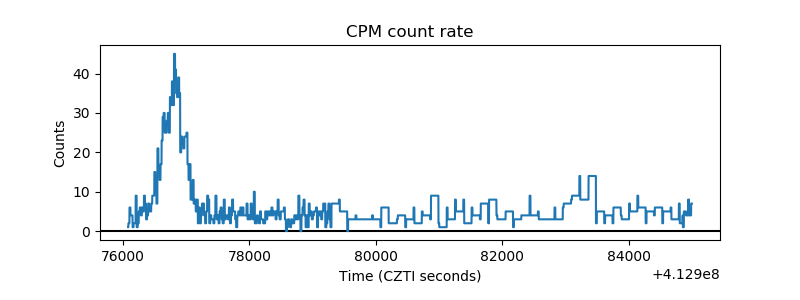 |
| CZT Counter | 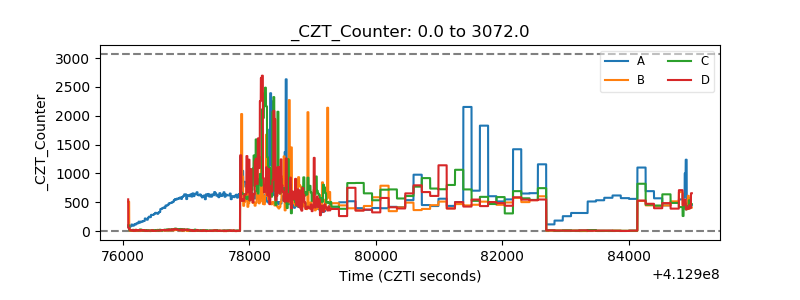 |
| +2.5 Volts monitor | 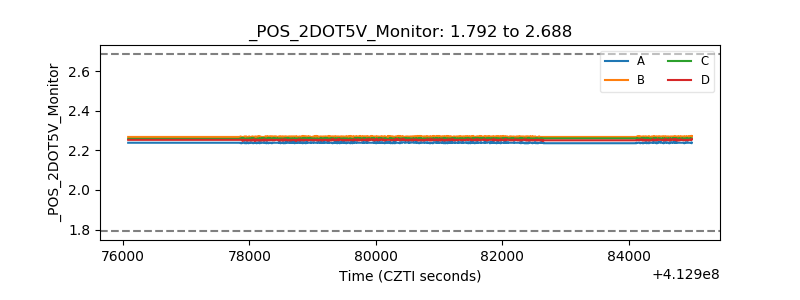 |
| +5 Volts monitor | 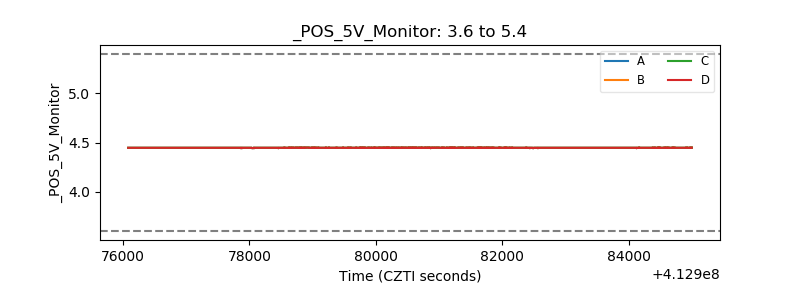 |
| _ROLL_ROT | 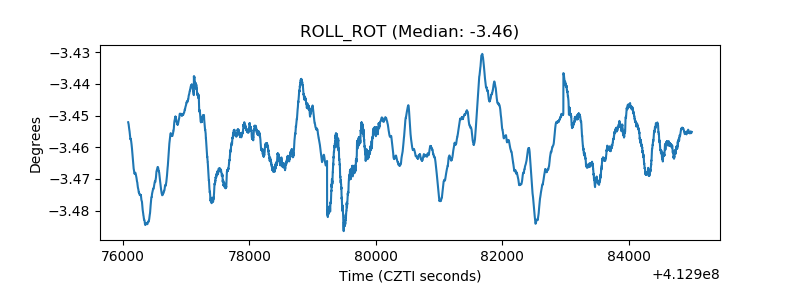 |
| _Roll_DEC | 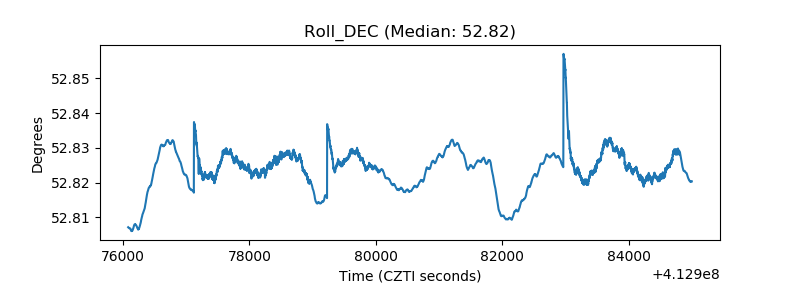 |
| _Roll_RA | 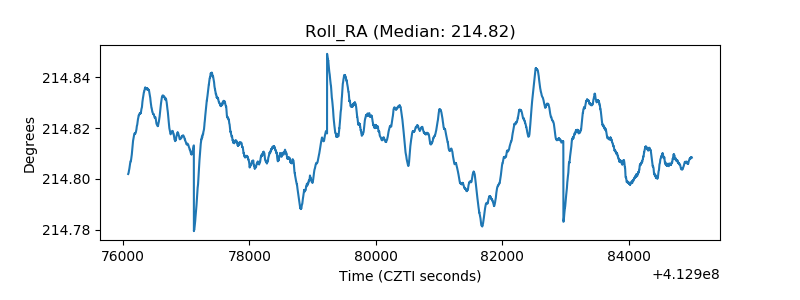 |
| Veto Counter | 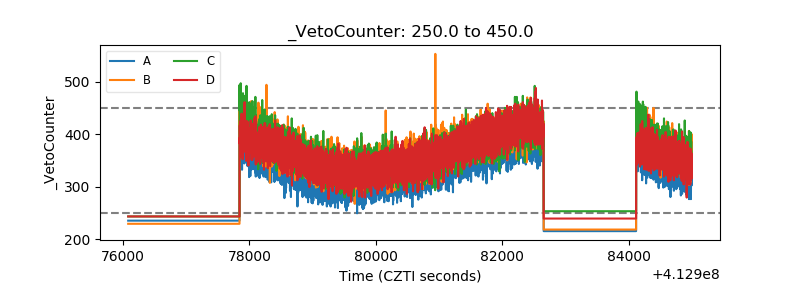 |