| Param | Original file | Final file |
|---|---|---|
| Filename | modeM0/AS1A12_022T01_9000005494_39727cztM0_level2.fits | modeM0/AS1A12_022T01_9000005494_39727cztM0_level2_quad_clean.evt |
| Size (bytes) | 356,235,840 | 96,042,240 |
| Size | 339.7 MB | 91.6 MB |
| Events in quadrant A | 3,244,379 | 639,464 |
| Events in quadrant B | 3,186,768 | 653,944 |
| Events in quadrant C | 3,305,654 | 629,091 |
| Events in quadrant D | 2,998,190 | 579,919 |
| Mode SS | |||
|---|---|---|---|
| Quadrant | BADHDUFLAG | Total packets | Discarded packets |
| A | 0 | 118 | 0 |
| B | 0 | 118 | 0 |
| C | 0 | 118 | 0 |
| D | 0 | 118 | 0 |
| Mode M0 | |||
|---|---|---|---|
| Quadrant | BADHDUFLAG | Total packets | Discarded packets |
| A | 0 | 13442 | 2 |
| B | 0 | 13437 | 1 |
| C | 0 | 13628 | 1 |
| D | 0 | 13171 | 1 |
| Mode M9 | |||
|---|---|---|---|
| Quadrant | BADHDUFLAG | Total packets | Discarded packets |
| A | 0 | 23 | 0 |
| B | 0 | 23 | 0 |
| C | 0 | 23 | 0 |
| D | 0 | 24 | 0 |
| Quadrant | Total seconds | Saturated seconds | Saturation percentage |
|---|---|---|---|
| A | 5802 | 95 | 1.637366% |
| B | 5802 | 91 | 1.568425% |
| C | 5802 | 65 | 1.120303% |
| D | 5802 | 83 | 1.430541% |
Noise dominated data is calculated using 1-second bins in cleaned event files. If a bin has >2000 counts, and if more than 50% of those come from <1% of pixels, then it is considered to be noise-dominated and hence unusable.
| Quadrant | # 1 sec bins | Bins with >0 counts | Bins with >2000 counts | High rate bins dominated by noise | Noise dominated (total time) | Noise dominated (detector-on time) | Marked lightcurve |
|---|---|---|---|---|---|---|---|
| A | 7114 | 5803 | 48 | 48 | 0.67% | 0.83% | 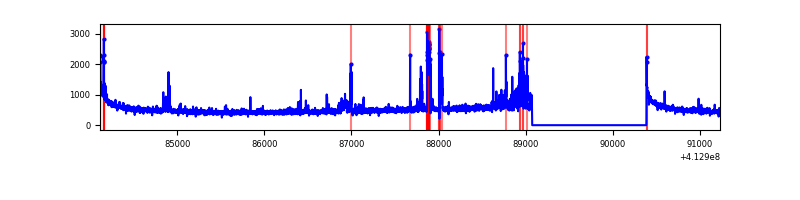 |
| B | 7114 | 5803 | 60 | 60 | 0.84% | 1.03% | 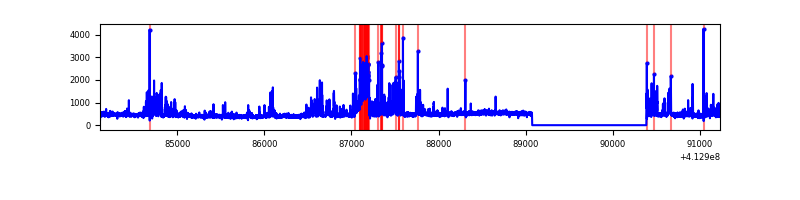 |
| C | 7114 | 5803 | 39 | 39 | 0.55% | 0.67% | 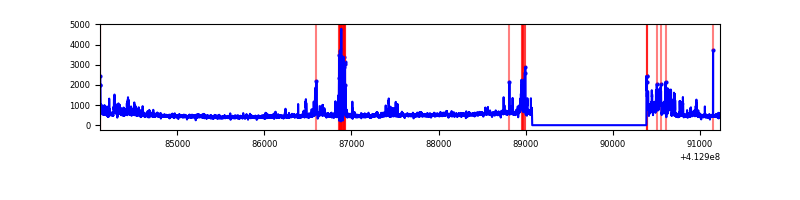 |
| D | 7114 | 5803 | 71 | 71 | 1.00% | 1.22% | 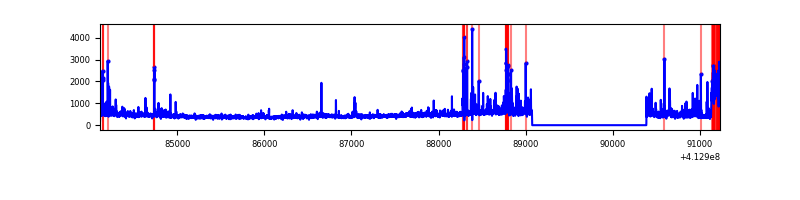 |
Top three noisy pixels from each quadrant. If the there are fewer than three noisy pixels in the level2.evt file, extra rows are filled as -1
| Pixel properties | Quadrant properties | ||||||
|---|---|---|---|---|---|---|---|
| Quadrant | DetID | PixID | Counts | Sigma | Mean | Median | Sigma |
| A | 10 | 83 | 463322 | 3599.64 | 627 | 613 | 128.5 |
| A | 15 | 174 | 234462 | 1819.22 | 627 | 613 | 128.5 |
| A | 13 | 248 | 93575 | 723.2 | 627 | 613 | 128.5 |
| B | 5 | 255 | 410624 | 3335.54 | 628 | 611 | 122.9 |
| B | 5 | 172 | 224964 | 1825.16 | 628 | 611 | 122.9 |
| B | 0 | 190 | 36802 | 294.42 | 628 | 611 | 122.9 |
| C | 15 | 208 | 380404 | 2646.97 | 615 | 618 | 143.5 |
| C | 15 | 214 | 240580 | 1672.45 | 615 | 618 | 143.5 |
| C | 9 | 187 | 235093 | 1634.21 | 615 | 618 | 143.5 |
| D | 12 | 227 | 234918 | 1549.85 | 615 | 597 | 151.2 |
| D | 13 | 249 | 154306 | 1016.66 | 615 | 597 | 151.2 |
| D | 12 | 233 | 111300 | 732.21 | 615 | 597 | 151.2 |
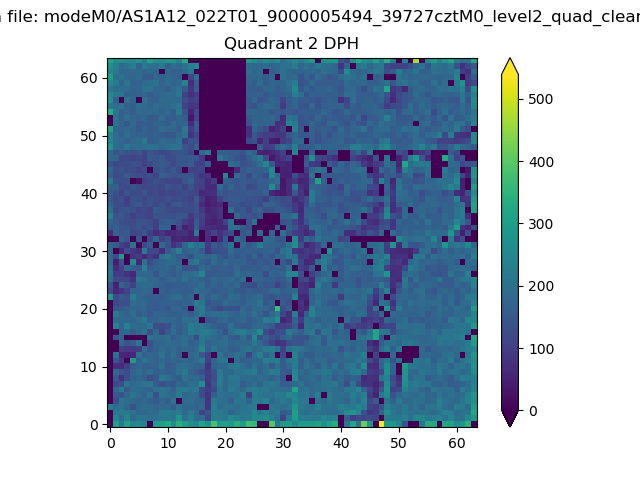
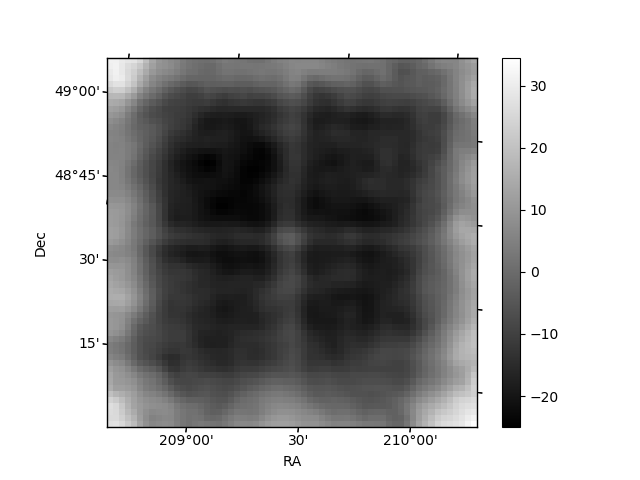
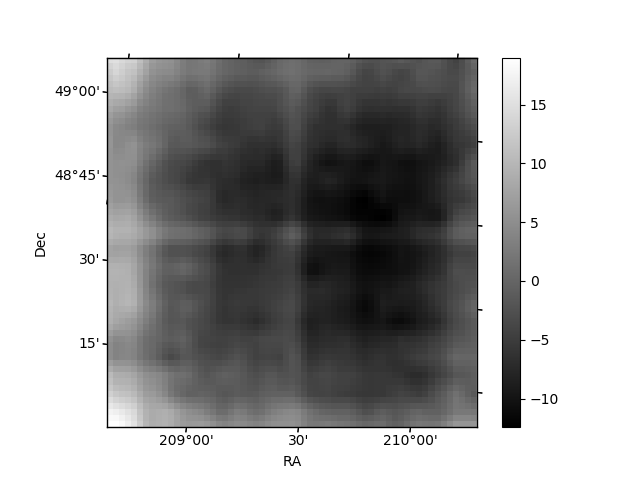
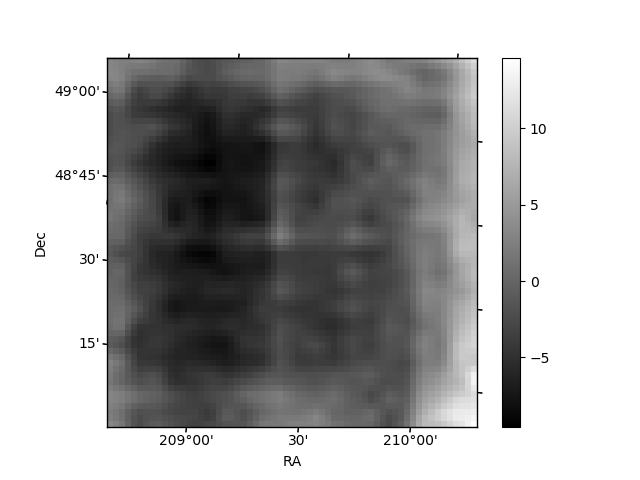
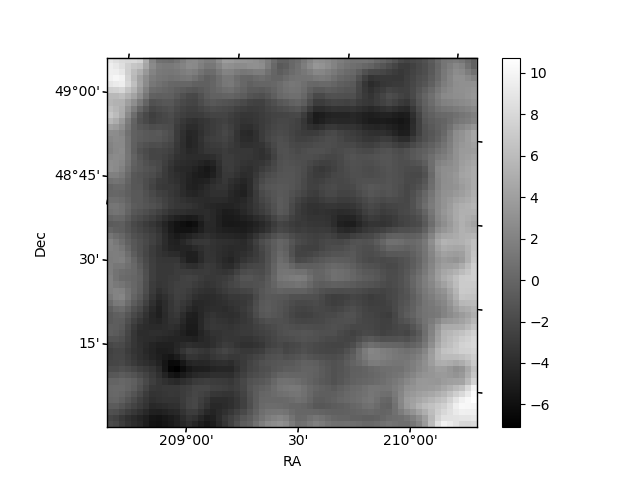
Histogram calculated using DETX and DETY for each event in the final _common_clean file
| Quadrant A | 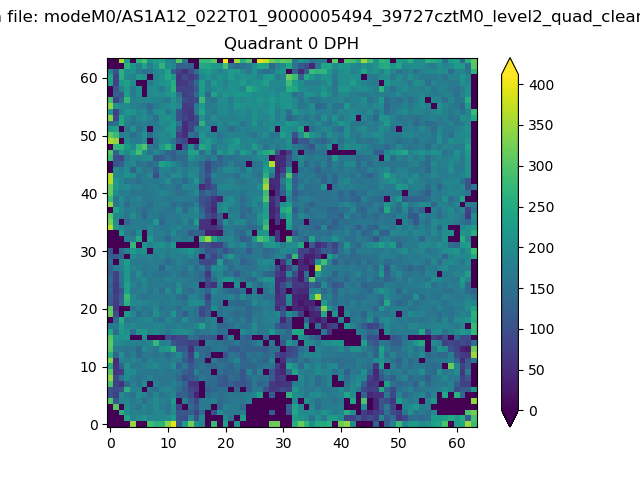 |
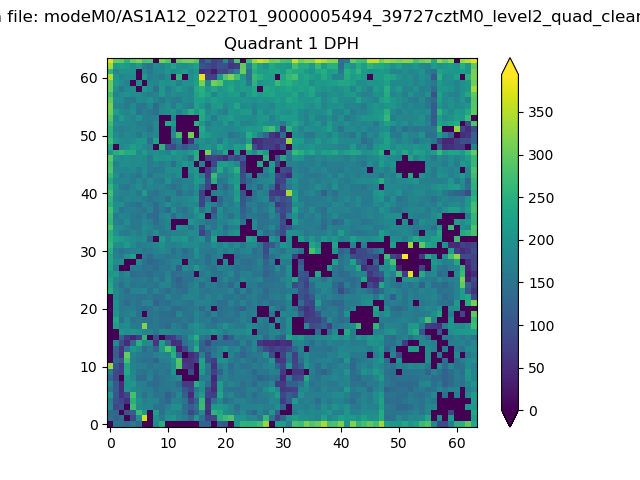 |
Quadrant B |
|---|---|---|---|
| Quadrant D | 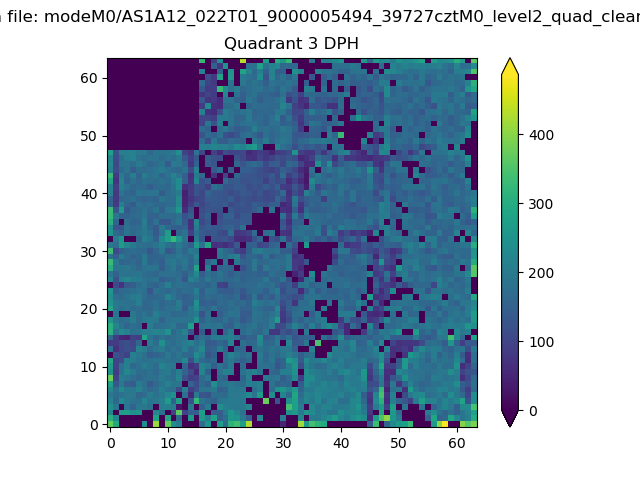 |
 |
Quadrant C |
| Plot type | Count rate plots | Images |
|---|---|---|
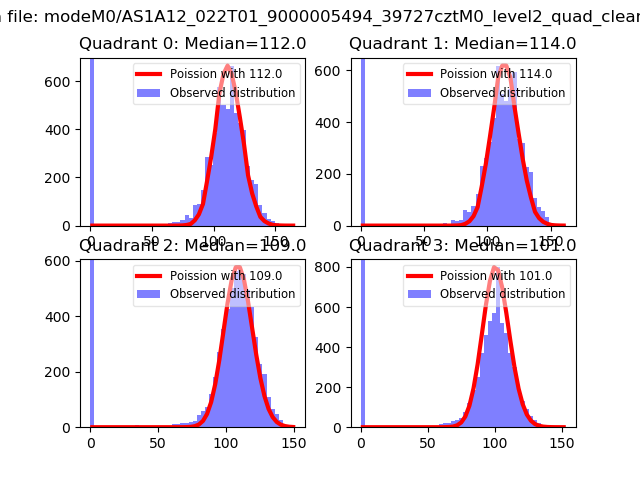
| Comparison with Poisson distribution Blue bars denote a histogram of data divided into 1 sec bins. Red curve is a Poisson curve with rate = median count rate of data. |
 |
 |
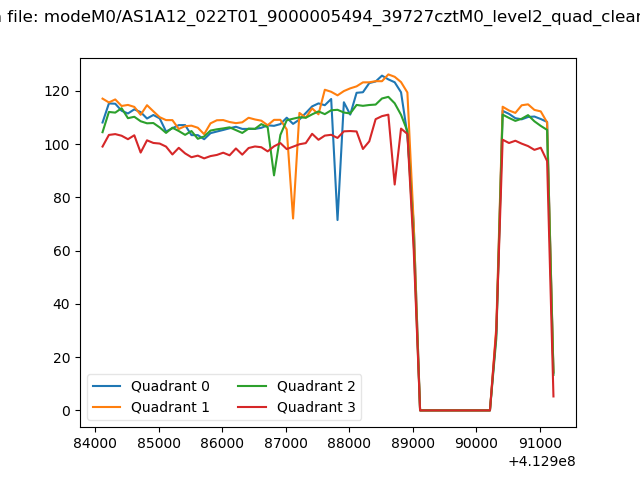
| Quadrant-wise count rates Data is divided into 100 sec bins |
 |
|
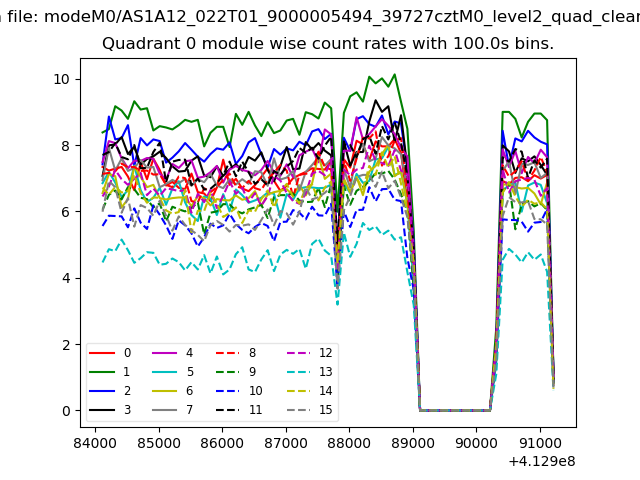
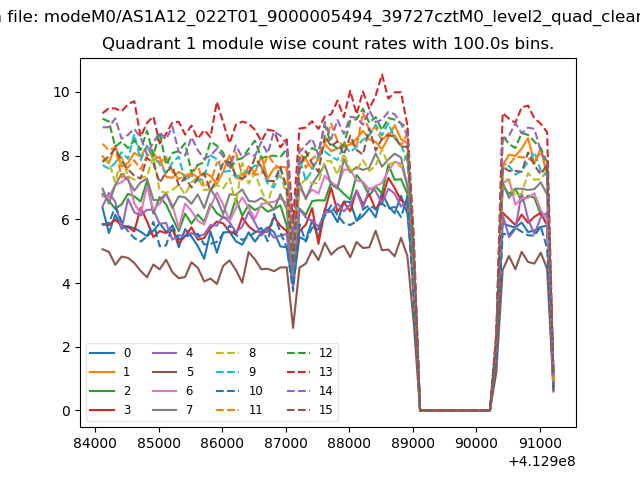
| Module-wise count rates for Quadrant A Data is divided into 100 sec bins |
 |
 |
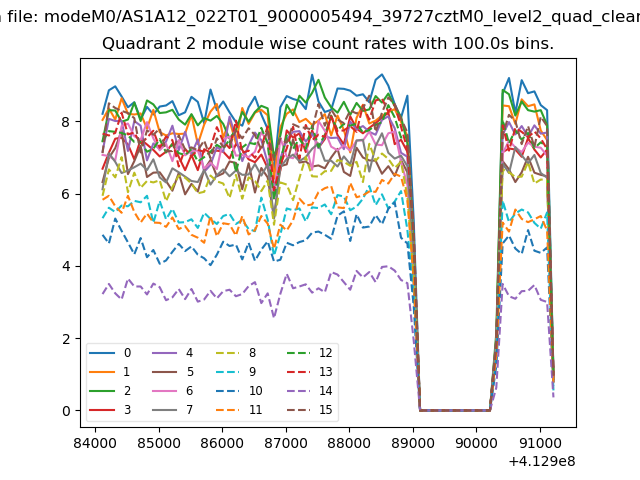
| Module-wise count rates for Quadrant B Data is divided into 100 sec bins |
 |
 |
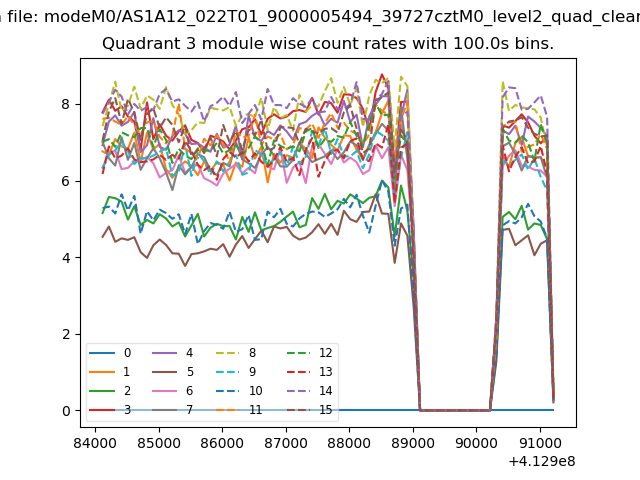
| Module-wise count rates for Quadrant C Data is divided into 100 sec bins |
 |
 |
| Module-wise count rates for Quadrant D Data is divided into 100 sec bins |
 |
 |
| Parameter | Plot |
|---|---|
| CZT HV Monitor | 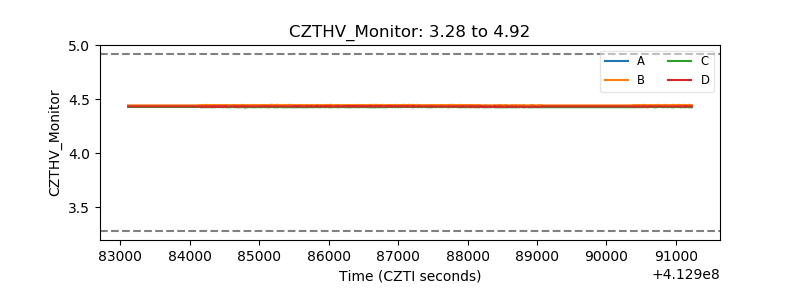 |
| D_VDD | 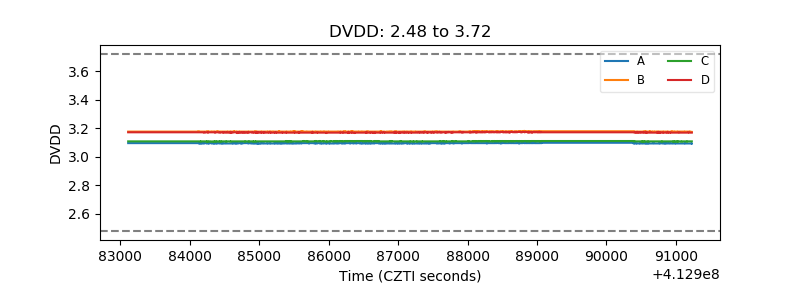 |
| Temperature 1 | 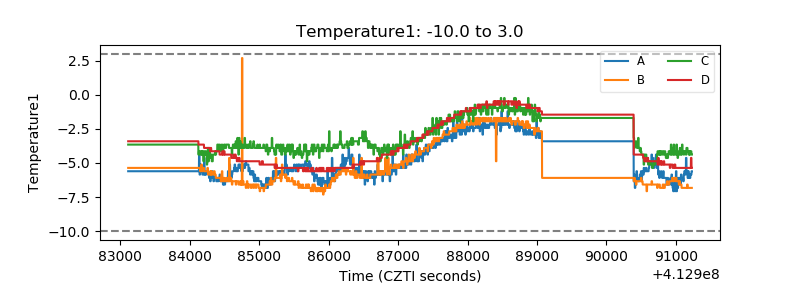 |
| Veto HV Monitor | 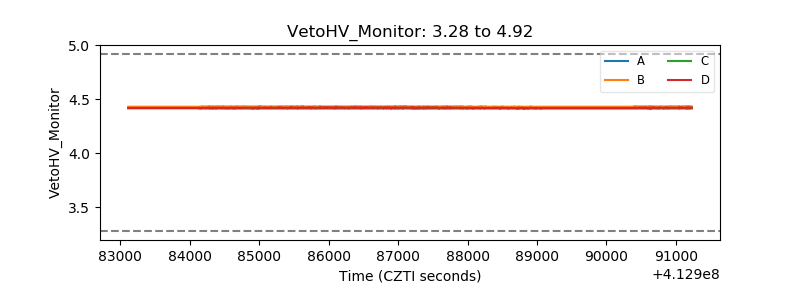 |
| Veto LLD | 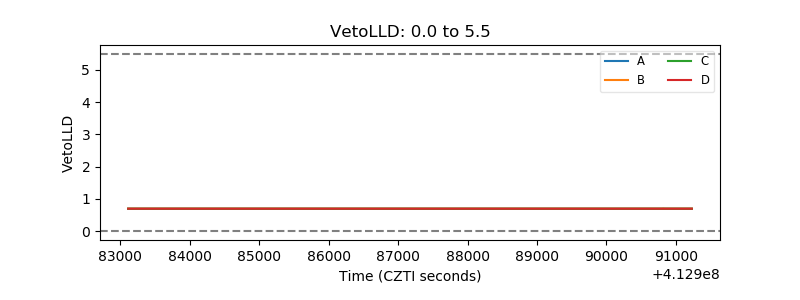 |
| Alpha Counter | 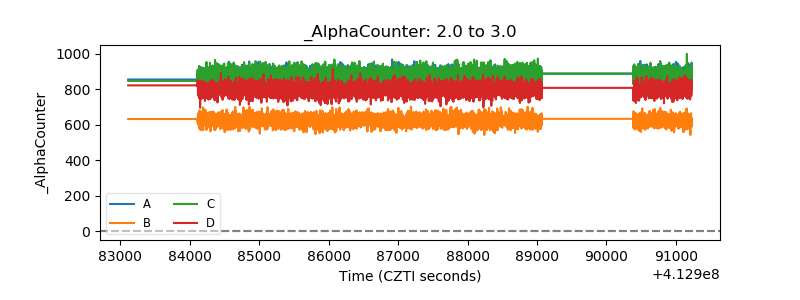 |
| _CPM_Rate | 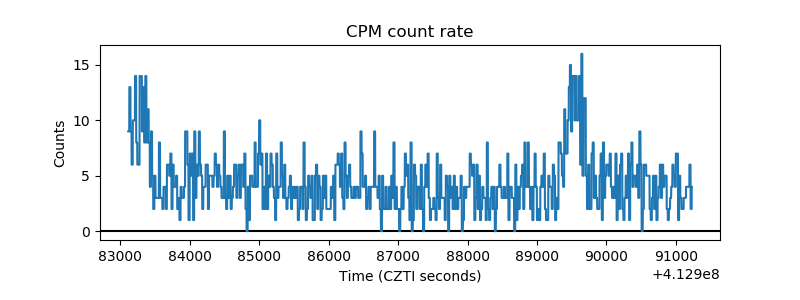 |
| CZT Counter |  |
| +2.5 Volts monitor | 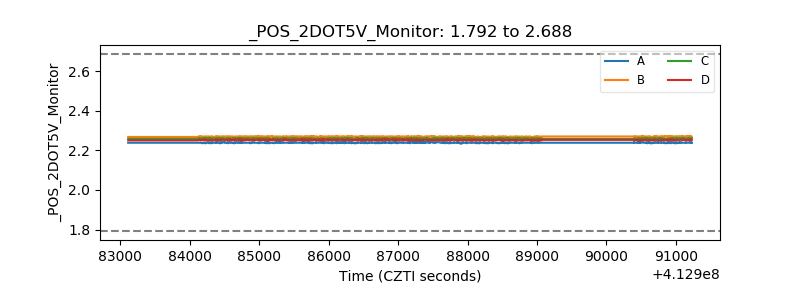 |
| +5 Volts monitor | 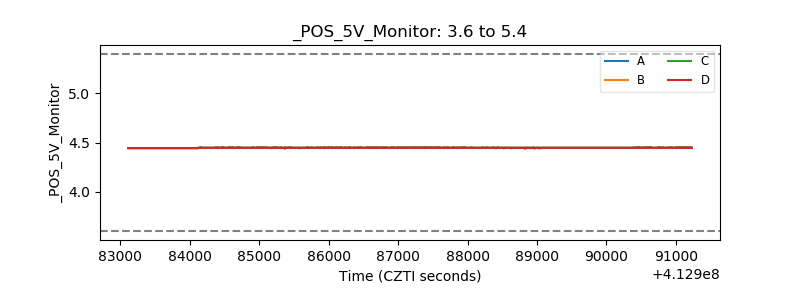 |
| _ROLL_ROT | 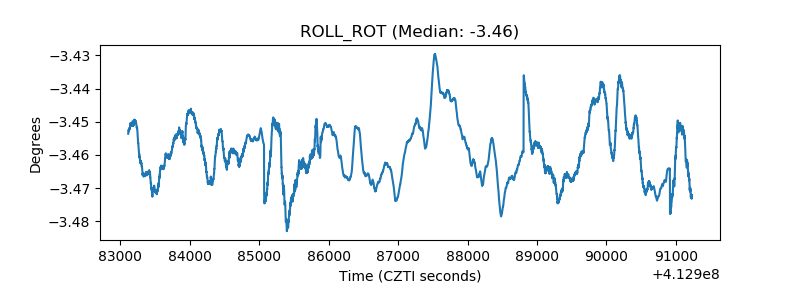 |
| _Roll_DEC | 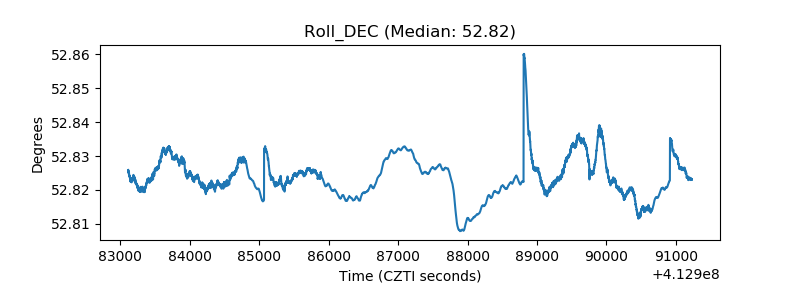 |
| _Roll_RA | 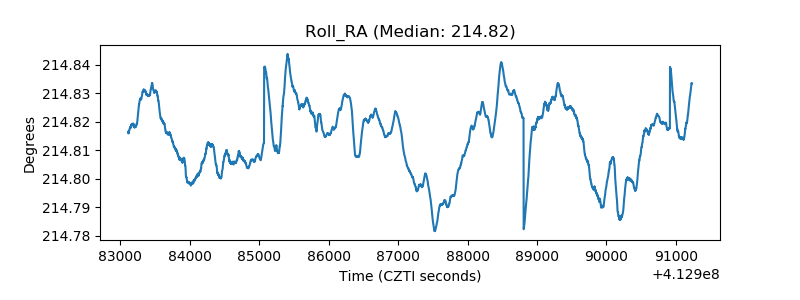 |
| Veto Counter | 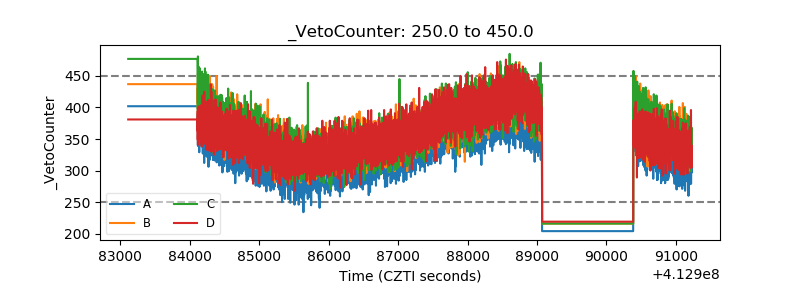 |