| Param | Original file | Final file |
|---|---|---|
| Filename | modeM0/AS1A12_022T01_9000005494_39731cztM0_level2.fits | modeM0/AS1A12_022T01_9000005494_39731cztM0_level2_quad_clean.evt |
| Size (bytes) | 431,651,520 | 89,130,240 |
| Size | 411.7 MB | 85.0 MB |
| Events in quadrant A | 3,542,440 | 598,262 |
| Events in quadrant B | 2,836,917 | 625,596 |
| Events in quadrant C | 3,797,185 | 595,154 |
| Events in quadrant D | 5,370,067 | 491,323 |
| Mode SS | |||
|---|---|---|---|
| Quadrant | BADHDUFLAG | Total packets | Discarded packets |
| A | 0 | 112 | 0 |
| B | 0 | 112 | 0 |
| C | 0 | 112 | 0 |
| D | 0 | 112 | 0 |
| Mode M0 | |||
|---|---|---|---|
| Quadrant | BADHDUFLAG | Total packets | Discarded packets |
| A | 0 | 13929 | 2 |
| B | 0 | 12187 | 1 |
| C | 0 | 15022 | 1 |
| D | 0 | 19715 | 1 |
| Mode M9 | |||
|---|---|---|---|
| Quadrant | BADHDUFLAG | Total packets | Discarded packets |
| A | 0 | 16 | 0 |
| B | 0 | 16 | 0 |
| C | 0 | 16 | 0 |
| D | 0 | 16 | 0 |
| Quadrant | Total seconds | Saturated seconds | Saturation percentage |
|---|---|---|---|
| A | 5554 | 201 | 3.619013% |
| B | 5554 | 70 | 1.260353% |
| C | 5554 | 46 | 0.828232% |
| D | 5554 | 770 | 13.863882% |
Noise dominated data is calculated using 1-second bins in cleaned event files. If a bin has >2000 counts, and if more than 50% of those come from <1% of pixels, then it is considered to be noise-dominated and hence unusable.
| Quadrant | # 1 sec bins | Bins with >0 counts | Bins with >2000 counts | High rate bins dominated by noise | Noise dominated (total time) | Noise dominated (detector-on time) | Marked lightcurve |
|---|---|---|---|---|---|---|---|
| A | 7138 | 5555 | 185 | 185 | 2.59% | 3.33% | 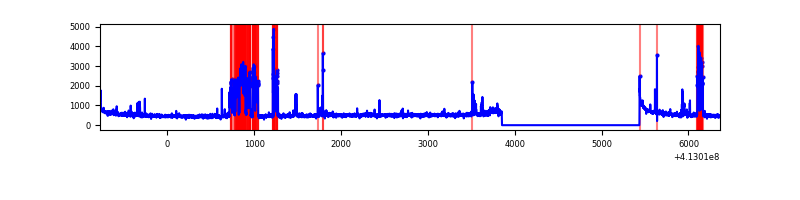 |
| B | 7138 | 5555 | 44 | 44 | 0.62% | 0.79% | 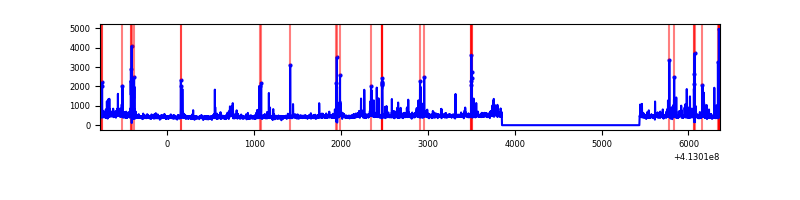 |
| C | 7138 | 5555 | 47 | 47 | 0.66% | 0.85% | 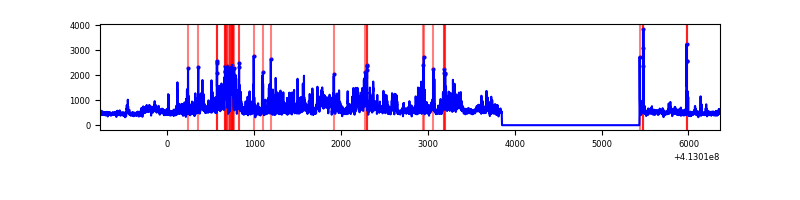 |
| D | 7138 | 5555 | 755 | 755 | 10.58% | 13.59% | 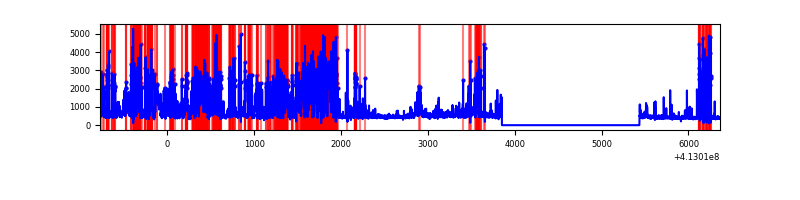 |
Top three noisy pixels from each quadrant. If the there are fewer than three noisy pixels in the level2.evt file, extra rows are filled as -1
| Pixel properties | Quadrant properties | ||||||
|---|---|---|---|---|---|---|---|
| Quadrant | DetID | PixID | Counts | Sigma | Mean | Median | Sigma |
| A | 15 | 174 | 729245 | 5866.28 | 606 | 594 | 124.2 |
| A | 10 | 83 | 418539 | 3364.82 | 606 | 594 | 124.2 |
| A | 9 | 143 | 49486 | 393.62 | 606 | 594 | 124.2 |
| B | 5 | 172 | 284502 | 2402.26 | 605 | 587 | 118.2 |
| B | 5 | 255 | 94371 | 793.52 | 605 | 587 | 118.2 |
| B | 0 | 190 | 41143 | 343.15 | 605 | 587 | 118.2 |
| C | 9 | 187 | 588635 | 4268.42 | 591 | 593 | 137.8 |
| C | 15 | 208 | 570855 | 4139.36 | 591 | 593 | 137.8 |
| C | 15 | 214 | 229551 | 1661.94 | 591 | 593 | 137.8 |
| D | 12 | 227 | 3010310 | 21513.1 | 561 | 545 | 139.9 |
| D | 13 | 249 | 97105 | 690.19 | 561 | 545 | 139.9 |
| D | 2 | 250 | 74486 | 528.51 | 561 | 545 | 139.9 |
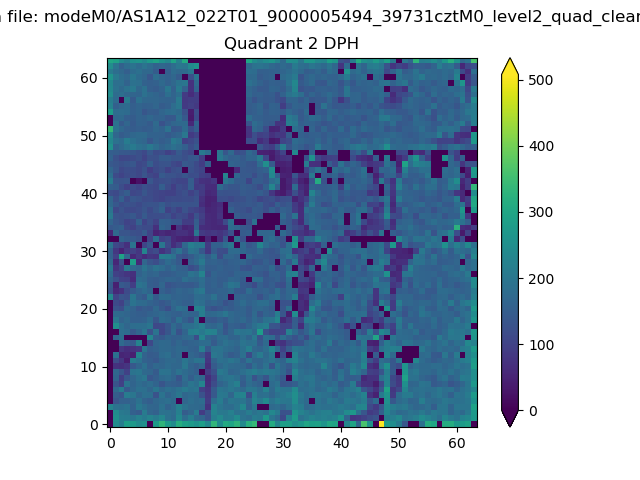
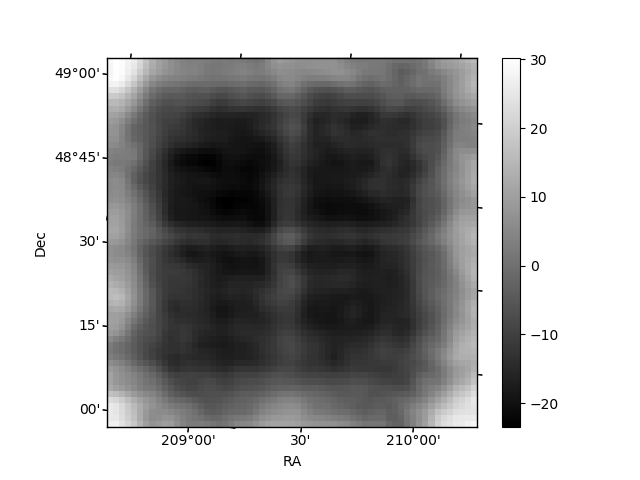
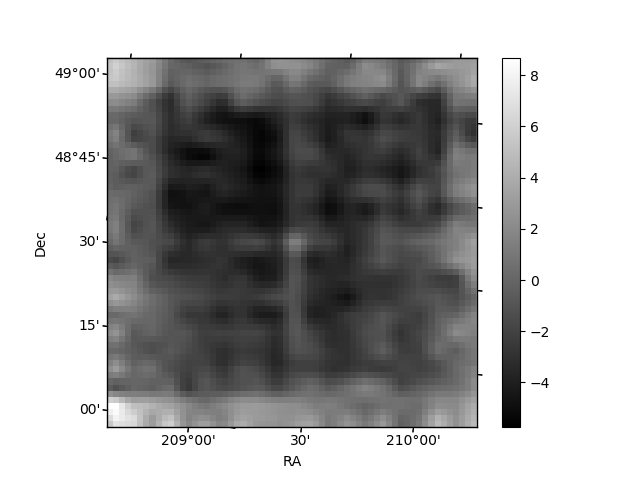
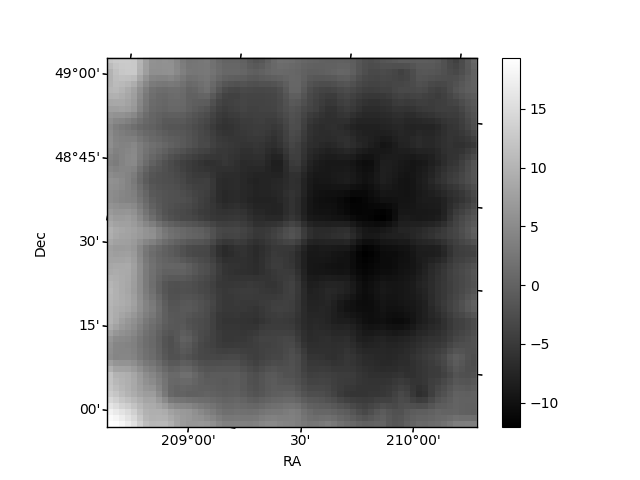
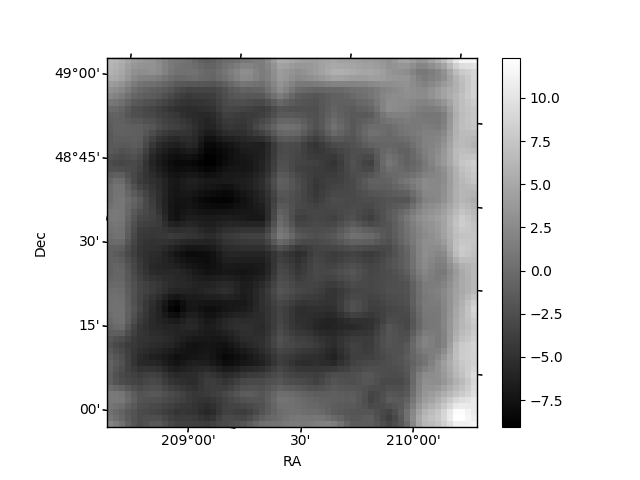
Histogram calculated using DETX and DETY for each event in the final _common_clean file
| Quadrant A | 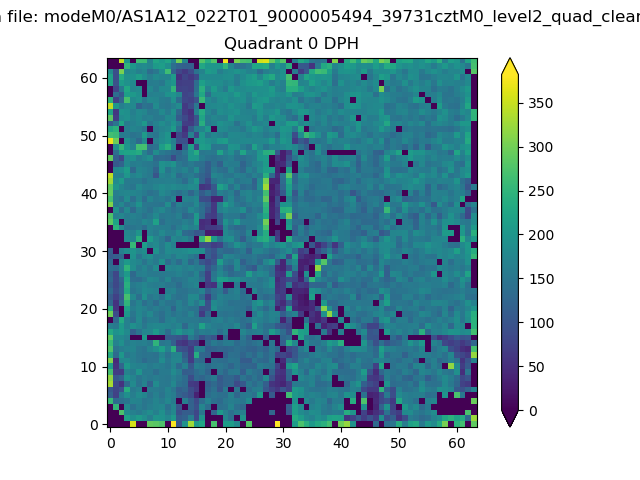 |
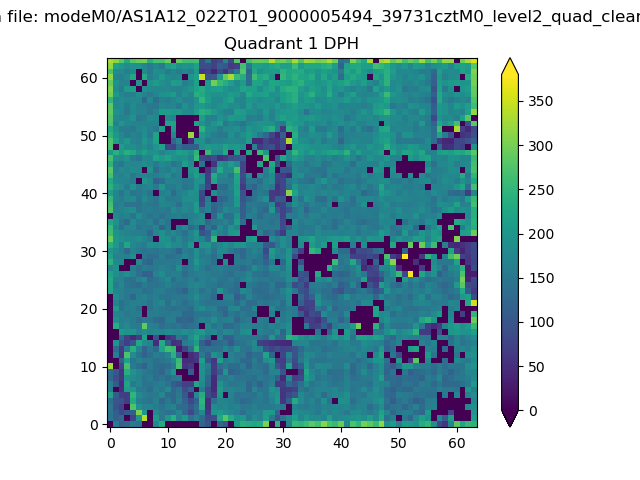 |
Quadrant B |
|---|---|---|---|
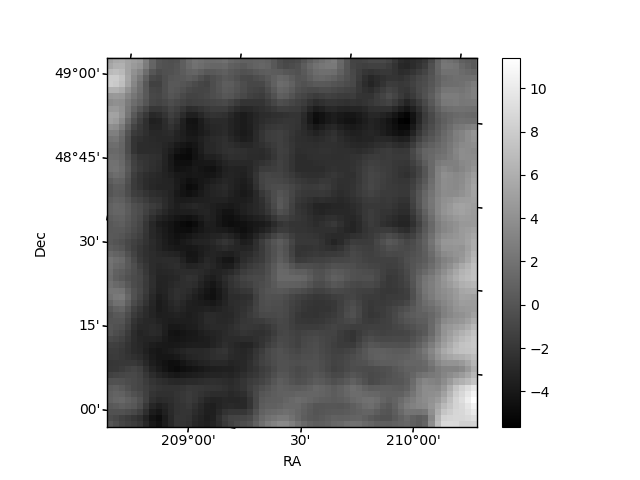
| Quadrant D | 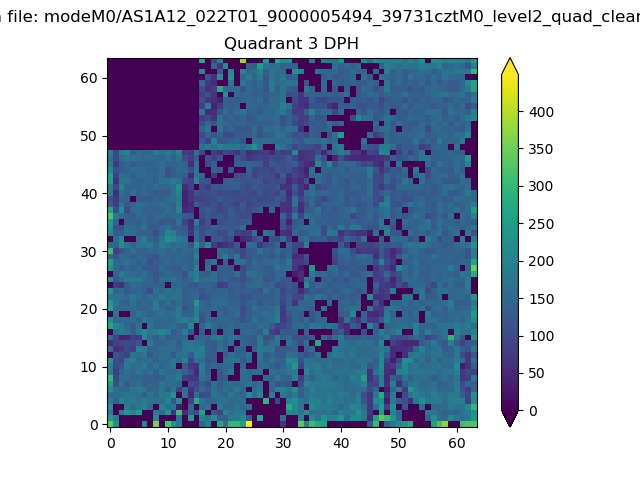 |
 |
Quadrant C |
| Plot type | Count rate plots | Images |
|---|---|---|
| Comparison with Poisson distribution Blue bars denote a histogram of data divided into 1 sec bins. Red curve is a Poisson curve with rate = median count rate of data. |
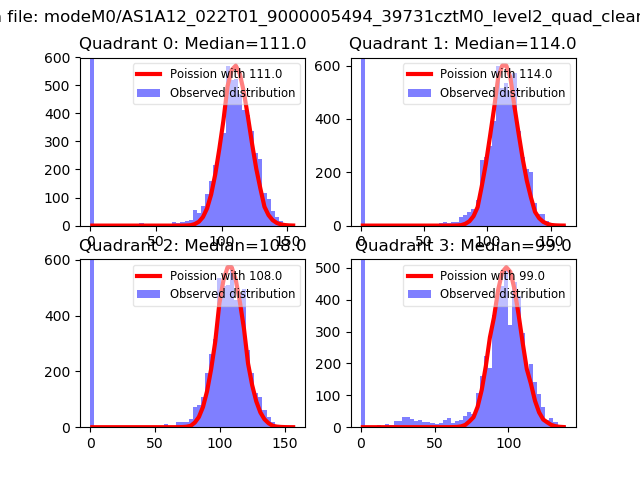 |
 |
| Quadrant-wise count rates Data is divided into 100 sec bins |
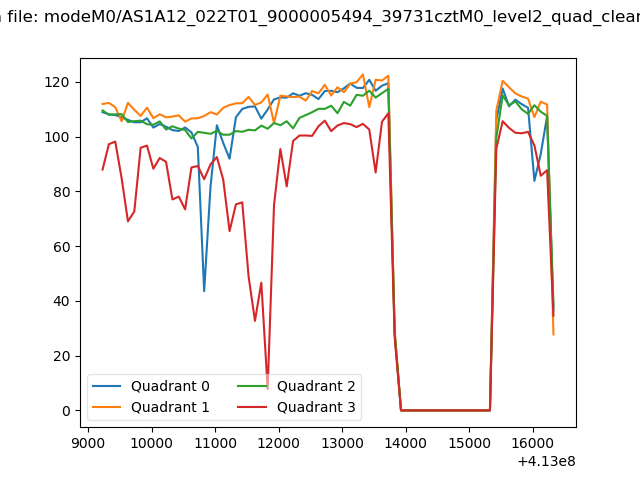 |
|
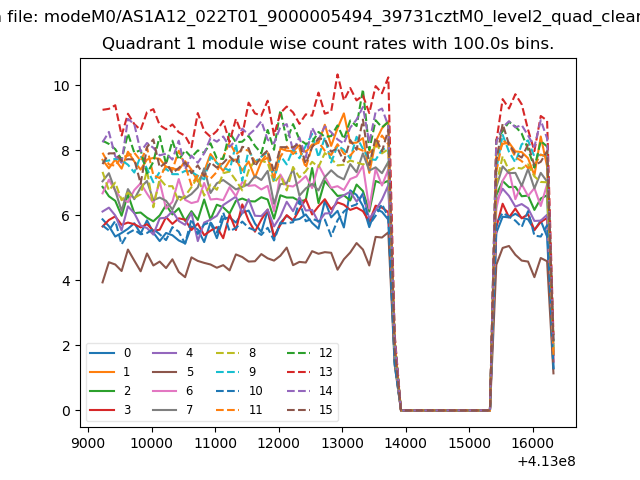
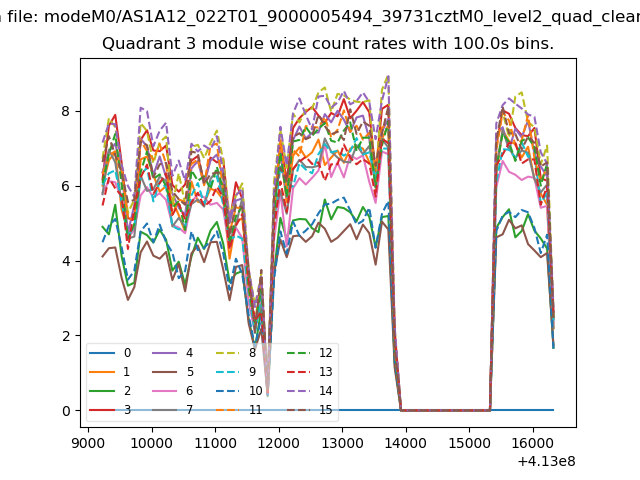
| Module-wise count rates for Quadrant A Data is divided into 100 sec bins |
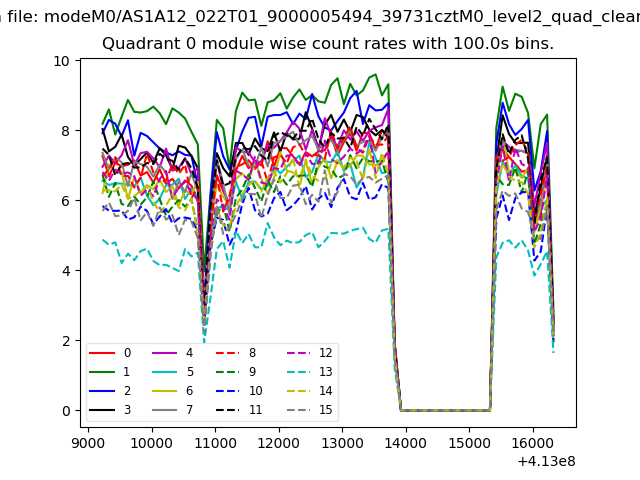 |
 |
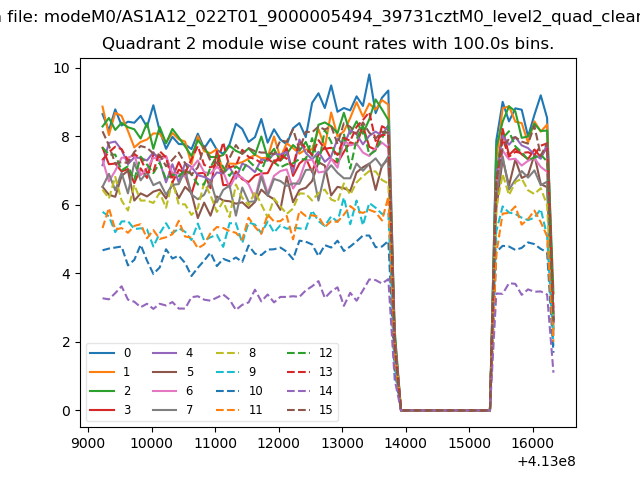
| Module-wise count rates for Quadrant B Data is divided into 100 sec bins |
 |
 |
| Module-wise count rates for Quadrant C Data is divided into 100 sec bins |
 |
 |
| Module-wise count rates for Quadrant D Data is divided into 100 sec bins |
 |
 |
| Parameter | Plot |
|---|---|
| CZT HV Monitor |  |
| D_VDD | 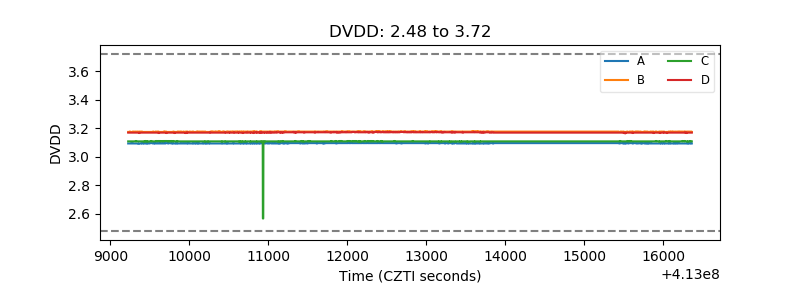 |
| Temperature 1 | 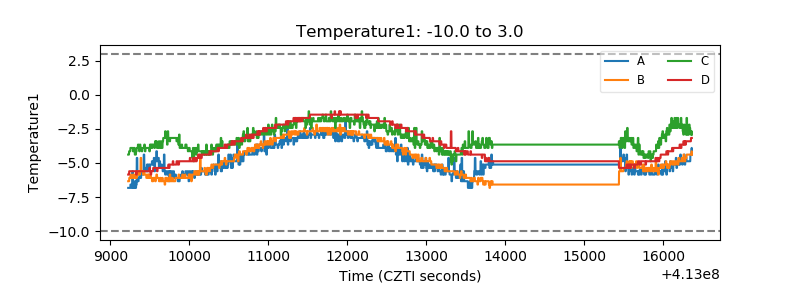 |
| Veto HV Monitor | 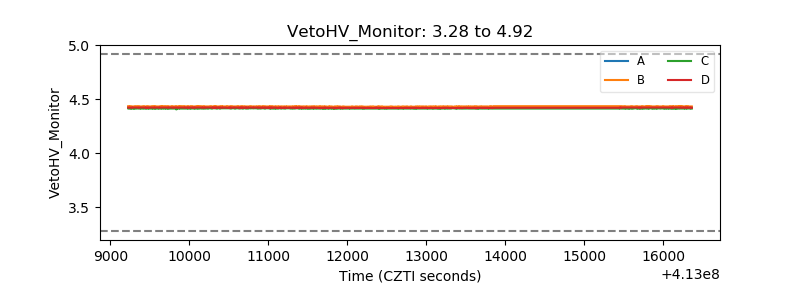 |
| Veto LLD |  |
| Alpha Counter | 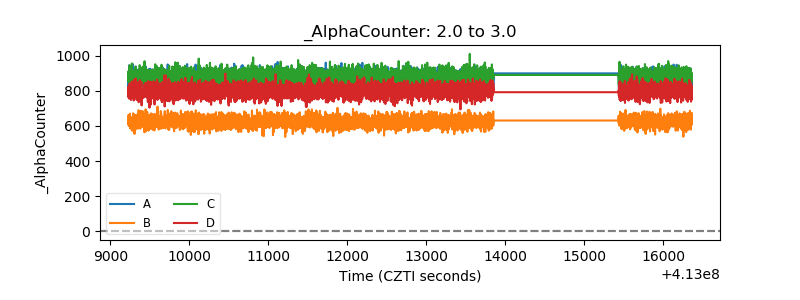 |
| _CPM_Rate | 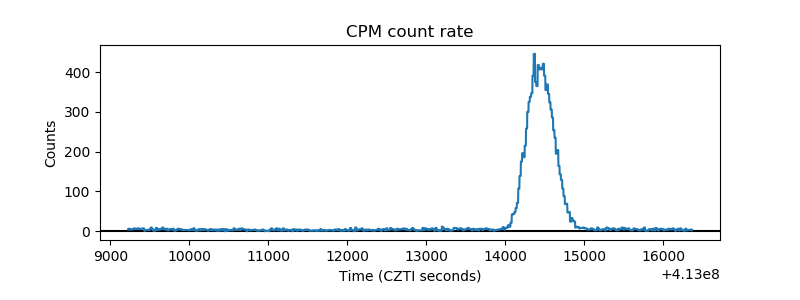 |
| CZT Counter | 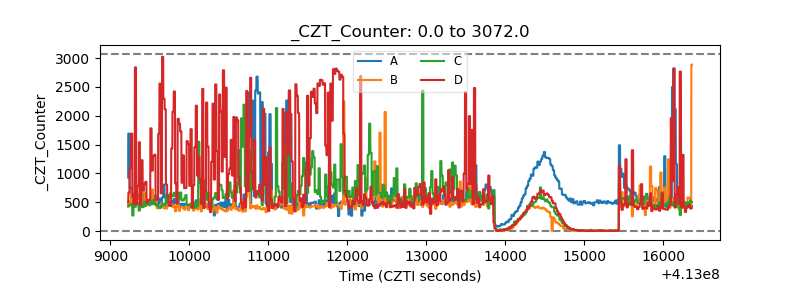 |
| +2.5 Volts monitor | 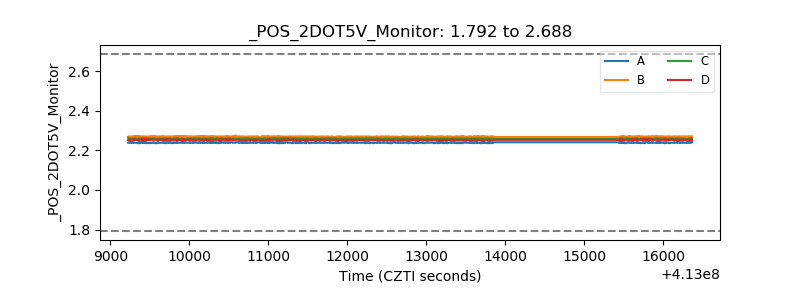 |
| +5 Volts monitor | 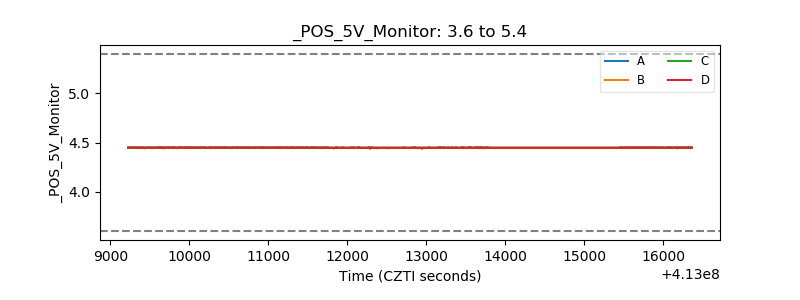 |
| _ROLL_ROT | 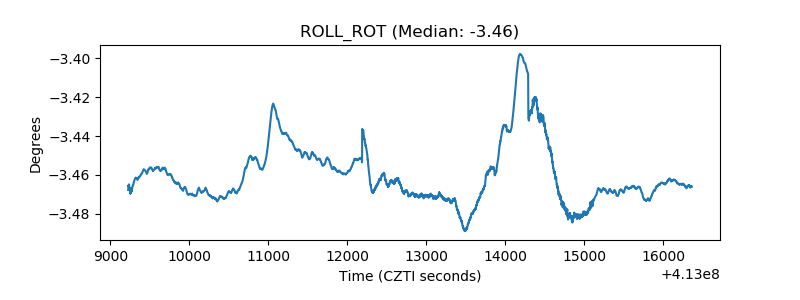 |
| _Roll_DEC | 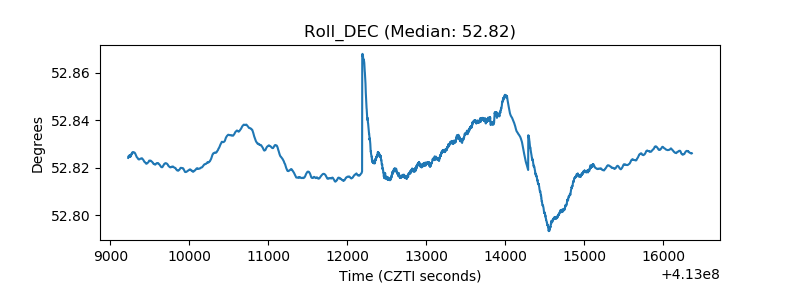 |
| _Roll_RA | 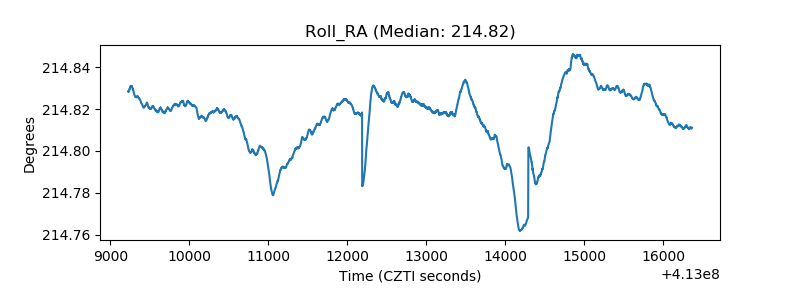 |
| Veto Counter | 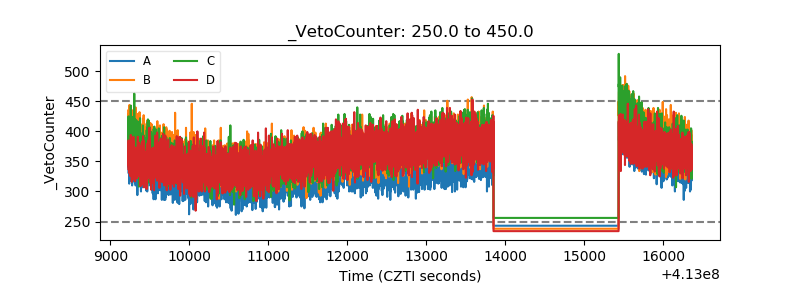 |