| Param | Original file | Final file |
|---|---|---|
| Filename | modeM0/AS1A12_022T01_9000005494_39733cztM0_level2.fits | modeM0/AS1A12_022T01_9000005494_39733cztM0_level2_quad_clean.evt |
| Size (bytes) | 372,447,360 | 91,175,040 |
| Size | 355.2 MB | 87.0 MB |
| Events in quadrant A | 3,273,493 | 614,560 |
| Events in quadrant B | 2,818,272 | 633,150 |
| Events in quadrant C | 3,418,113 | 593,945 |
| Events in quadrant D | 3,852,065 | 536,636 |
| Mode SS | |||
|---|---|---|---|
| Quadrant | BADHDUFLAG | Total packets | Discarded packets |
| A | 0 | 112 | 0 |
| B | 0 | 112 | 0 |
| C | 0 | 112 | 0 |
| D | 0 | 112 | 0 |
| Mode M0 | |||
|---|---|---|---|
| Quadrant | BADHDUFLAG | Total packets | Discarded packets |
| A | 0 | 12976 | 3 |
| B | 0 | 11937 | 2 |
| C | 0 | 13676 | 2 |
| D | 0 | 15224 | 2 |
| Mode M9 | |||
|---|---|---|---|
| Quadrant | BADHDUFLAG | Total packets | Discarded packets |
| A | 0 | 18 | 0 |
| B | 0 | 18 | 0 |
| C | 0 | 18 | 0 |
| D | 0 | 19 | 0 |
| Quadrant | Total seconds | Saturated seconds | Saturation percentage |
|---|---|---|---|
| A | 5463 | 122 | 2.233205% |
| B | 5463 | 75 | 1.372872% |
| C | 5463 | 55 | 1.006773% |
| D | 5463 | 256 | 4.686070% |
Noise dominated data is calculated using 1-second bins in cleaned event files. If a bin has >2000 counts, and if more than 50% of those come from <1% of pixels, then it is considered to be noise-dominated and hence unusable.
| Quadrant | # 1 sec bins | Bins with >0 counts | Bins with >2000 counts | High rate bins dominated by noise | Noise dominated (total time) | Noise dominated (detector-on time) | Marked lightcurve |
|---|---|---|---|---|---|---|---|
| A | 7195 | 5464 | 80 | 80 | 1.11% | 1.46% | 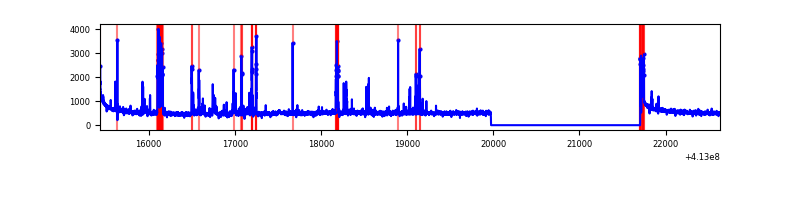 |
| B | 7195 | 5464 | 37 | 37 | 0.51% | 0.68% | 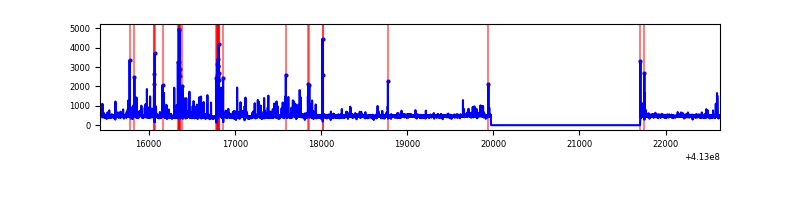 |
| C | 7195 | 5464 | 39 | 39 | 0.54% | 0.71% | 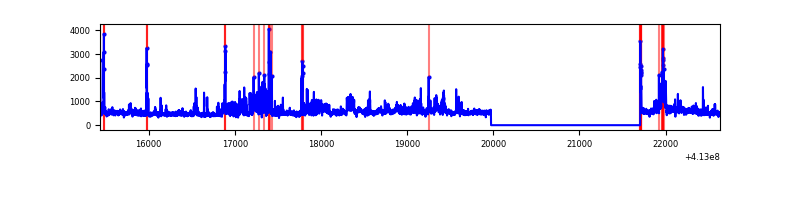 |
| D | 7195 | 5464 | 211 | 211 | 2.93% | 3.86% | 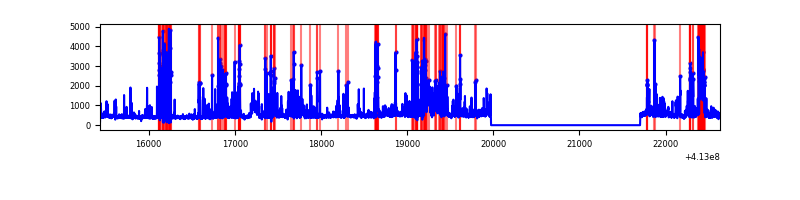 |
Top three noisy pixels from each quadrant. If the there are fewer than three noisy pixels in the level2.evt file, extra rows are filled as -1
| Pixel properties | Quadrant properties | ||||||
|---|---|---|---|---|---|---|---|
| Quadrant | DetID | PixID | Counts | Sigma | Mean | Median | Sigma |
| A | 10 | 83 | 444468 | 3572.95 | 609 | 598 | 124.2 |
| A | 15 | 174 | 299792 | 2408.37 | 609 | 598 | 124.2 |
| A | 9 | 143 | 165906 | 1330.65 | 609 | 598 | 124.2 |
| B | 5 | 172 | 341153 | 2888.95 | 604 | 587 | 117.9 |
| B | 5 | 255 | 35610 | 297.09 | 604 | 587 | 117.9 |
| B | 4 | 170 | 24618 | 203.85 | 604 | 587 | 117.9 |
| C | 15 | 208 | 569240 | 4130.52 | 589 | 592 | 137.7 |
| C | 9 | 187 | 253985 | 1840.58 | 589 | 592 | 137.7 |
| C | 15 | 214 | 240691 | 1744.02 | 589 | 592 | 137.7 |
| D | 12 | 227 | 1067850 | 7387.77 | 584 | 567 | 144.5 |
| D | 12 | 233 | 261249 | 1804.45 | 584 | 567 | 144.5 |
| D | 13 | 249 | 136105 | 938.2 | 584 | 567 | 144.5 |
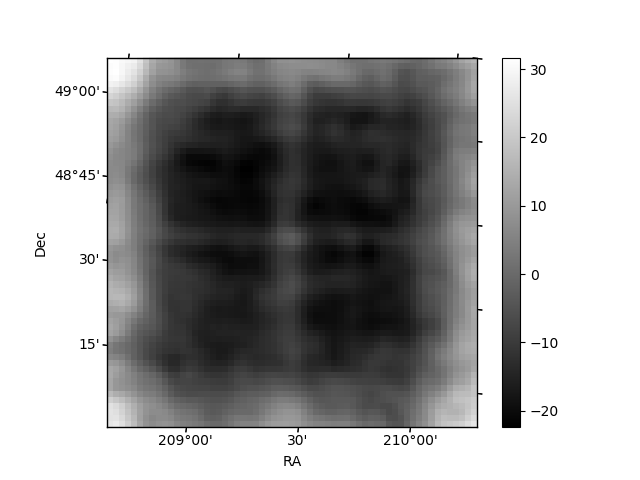
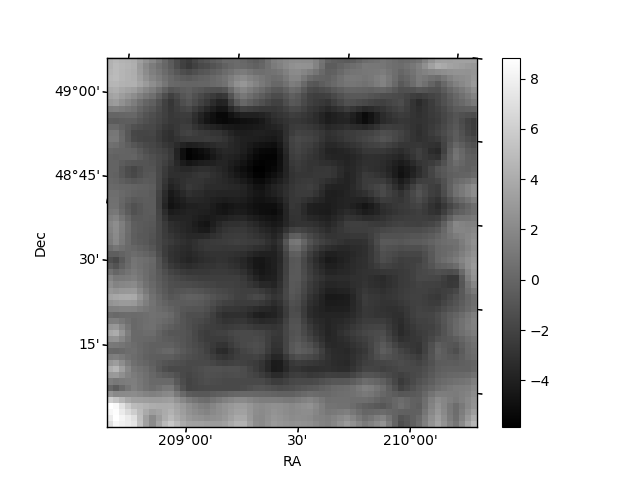
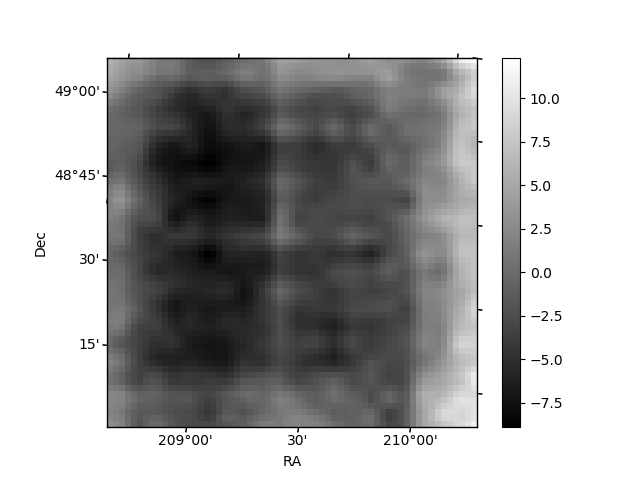
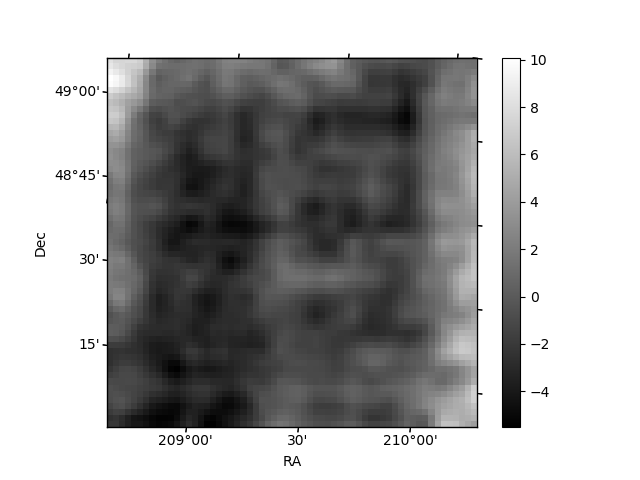
Histogram calculated using DETX and DETY for each event in the final _common_clean file
| Quadrant A | 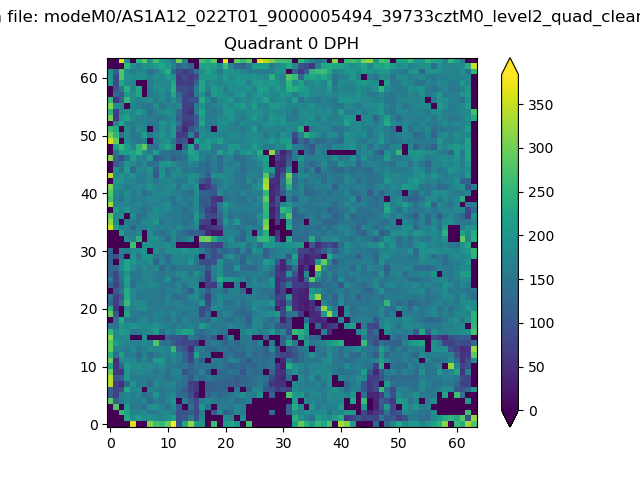 |
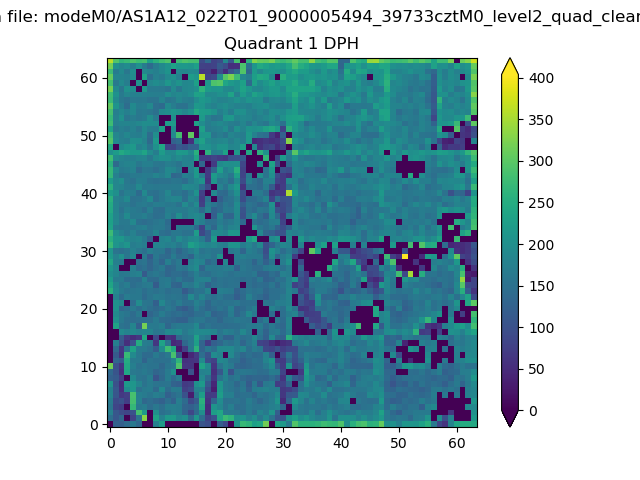 |
Quadrant B |
|---|---|---|---|
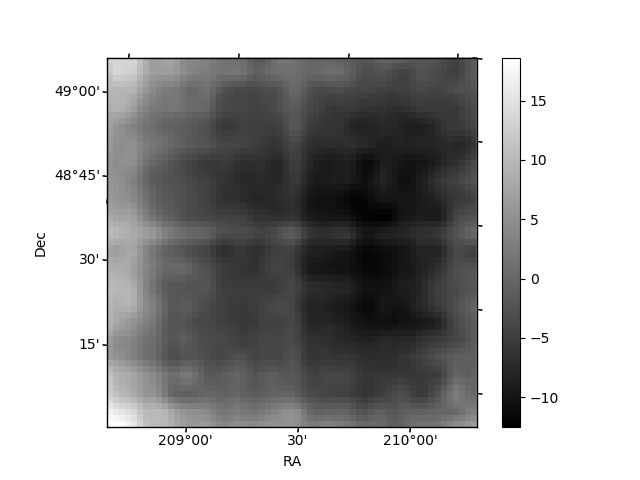
| Quadrant D | 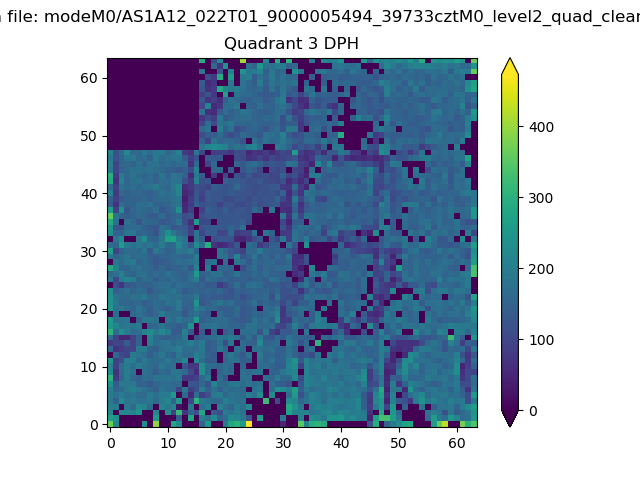 |
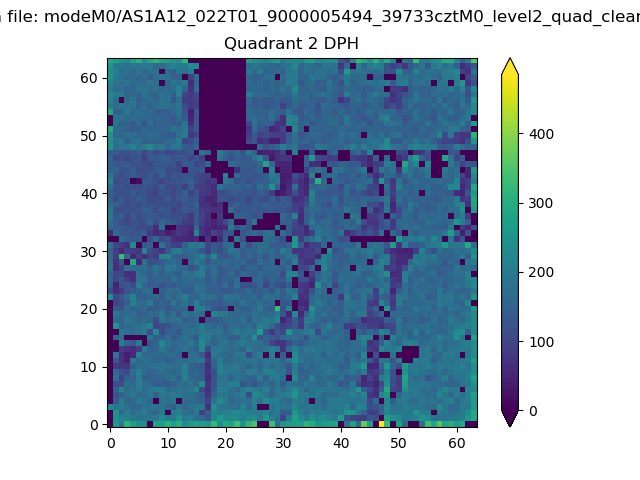 |
Quadrant C |
| Plot type | Count rate plots | Images |
|---|---|---|
| Comparison with Poisson distribution Blue bars denote a histogram of data divided into 1 sec bins. Red curve is a Poisson curve with rate = median count rate of data. |
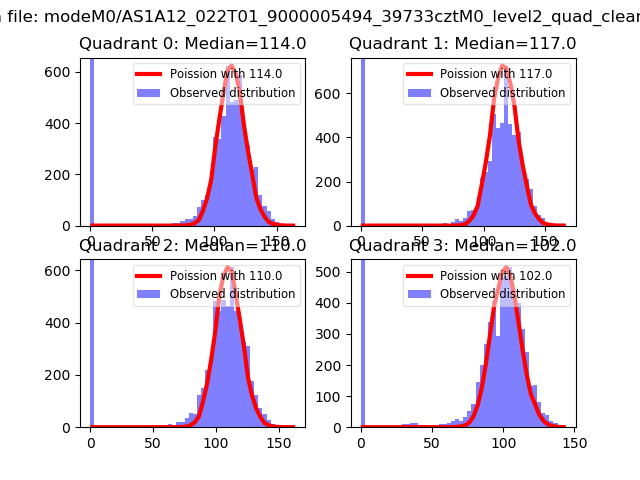 |
 |
| Quadrant-wise count rates Data is divided into 100 sec bins |
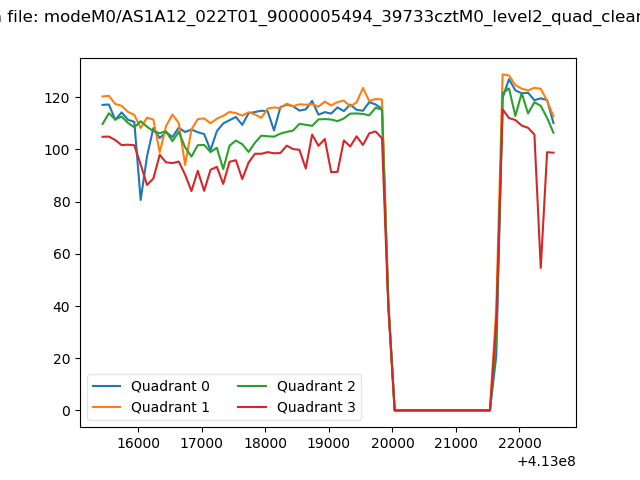 |
|
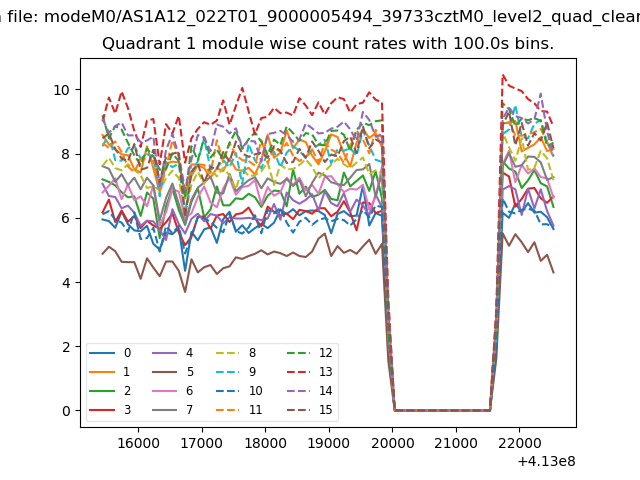
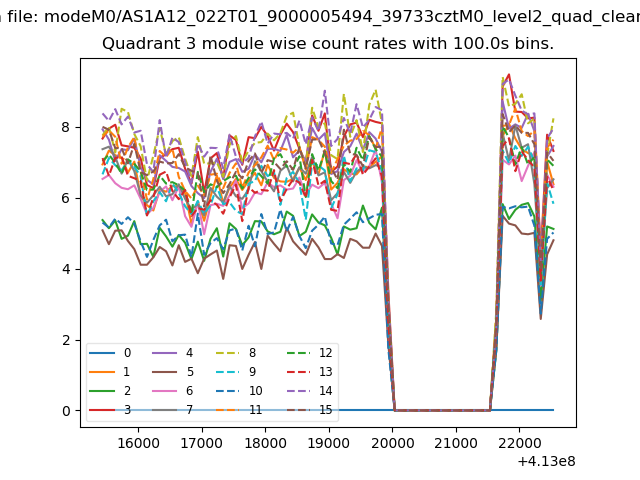
| Module-wise count rates for Quadrant A Data is divided into 100 sec bins |
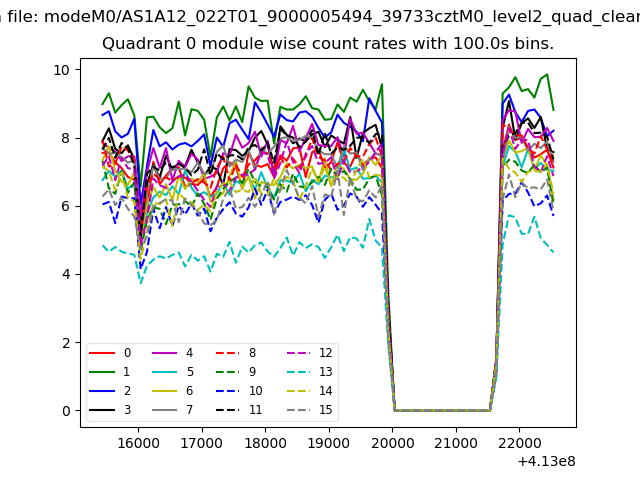 |
 |
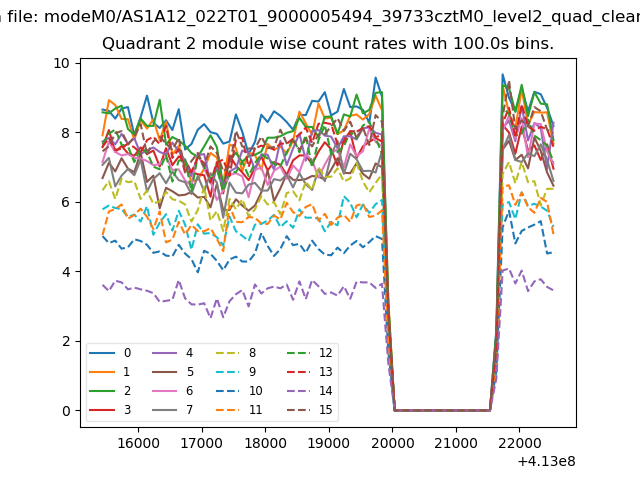
| Module-wise count rates for Quadrant B Data is divided into 100 sec bins |
 |
 |
| Module-wise count rates for Quadrant C Data is divided into 100 sec bins |
 |
 |
| Module-wise count rates for Quadrant D Data is divided into 100 sec bins |
 |
 |
| Parameter | Plot |
|---|---|
| CZT HV Monitor | 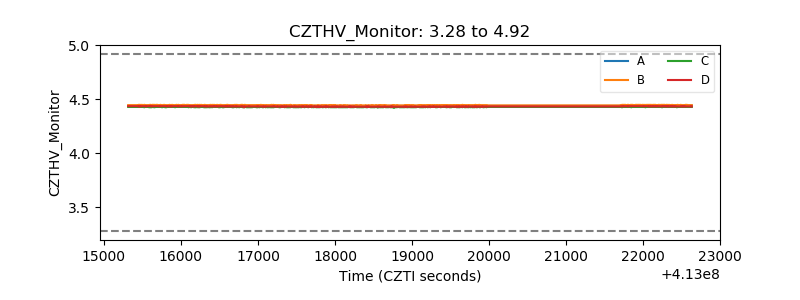 |
| D_VDD | 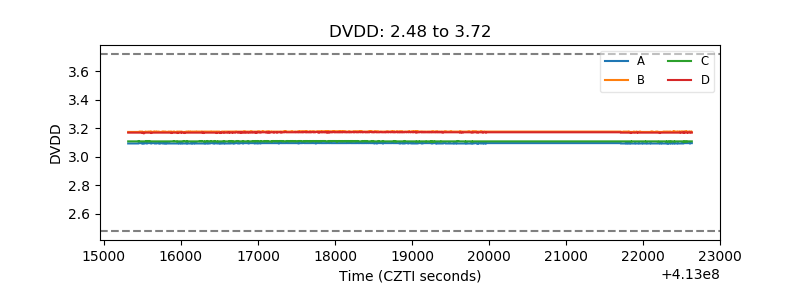 |
| Temperature 1 | 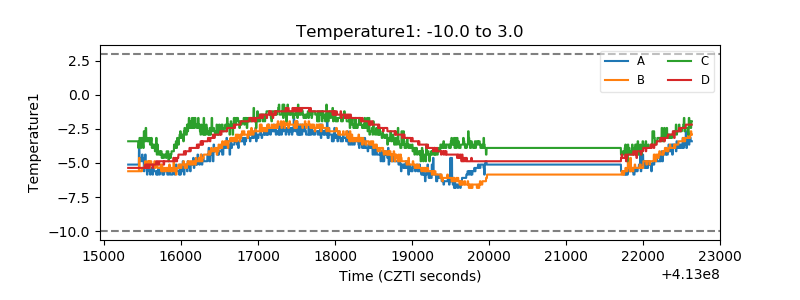 |
| Veto HV Monitor | 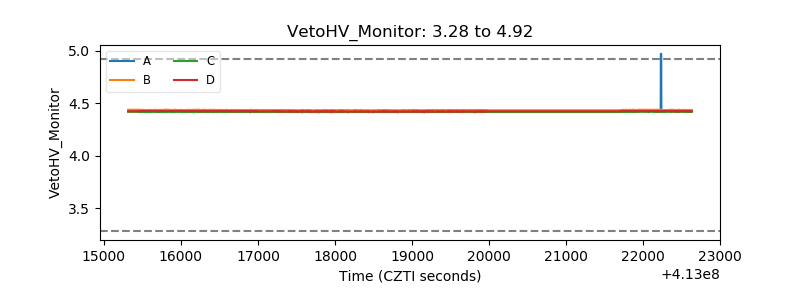 |
| Veto LLD | 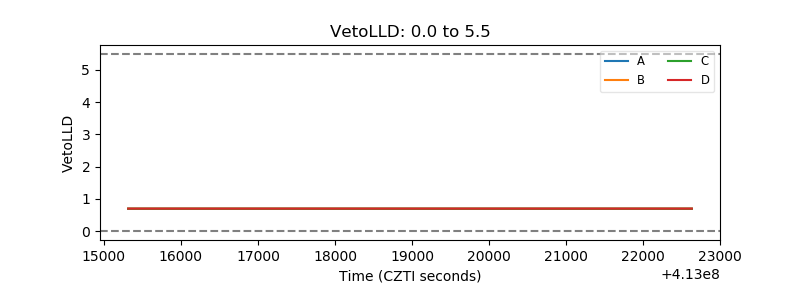 |
| Alpha Counter | 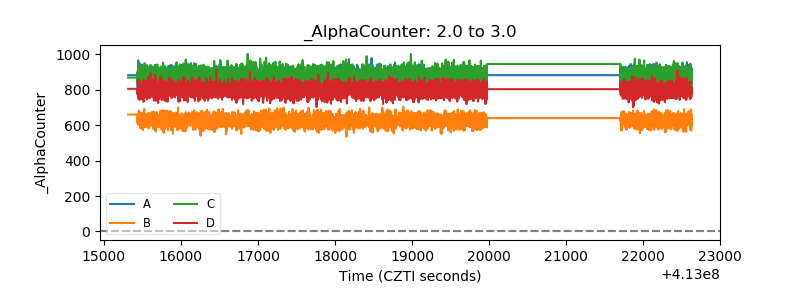 |
| _CPM_Rate | 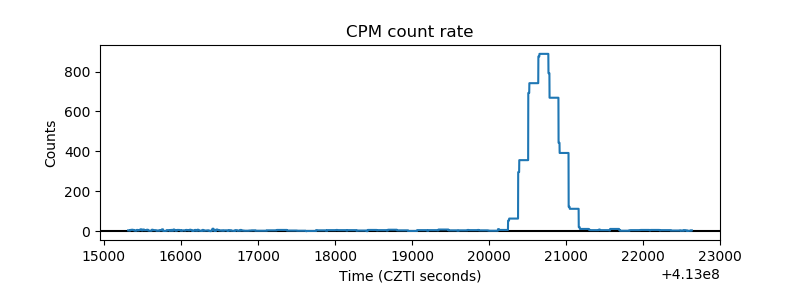 |
| CZT Counter | 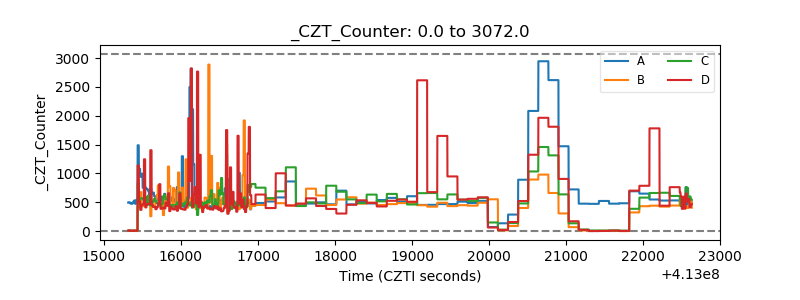 |
| +2.5 Volts monitor | 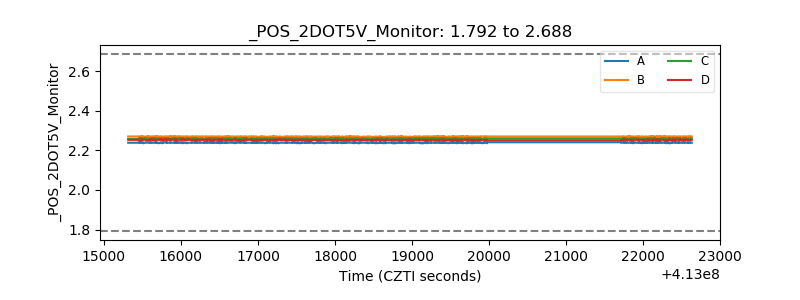 |
| +5 Volts monitor | 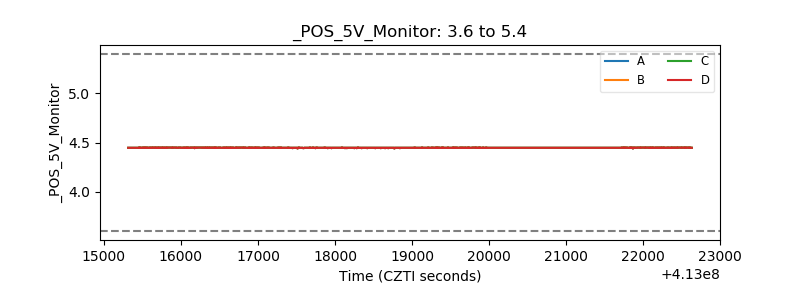 |
| _ROLL_ROT | 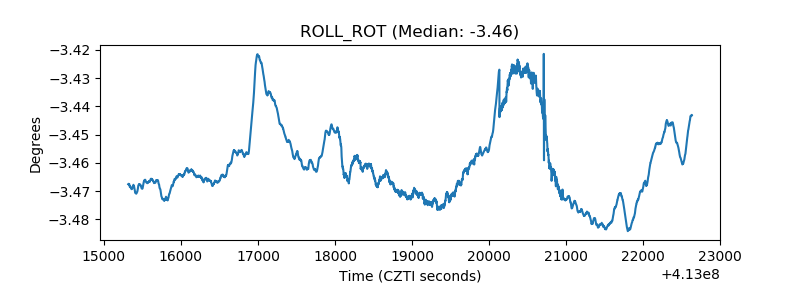 |
| _Roll_DEC | 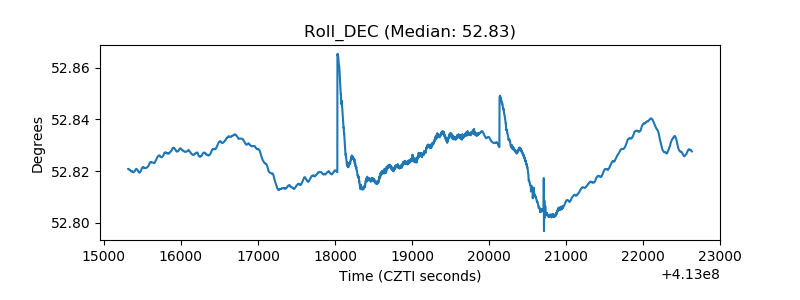 |
| _Roll_RA | 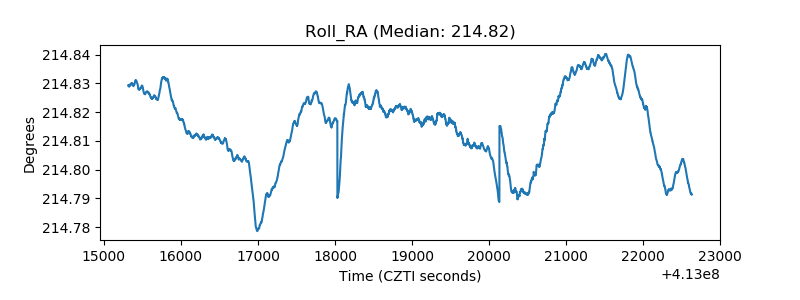 |
| Veto Counter | 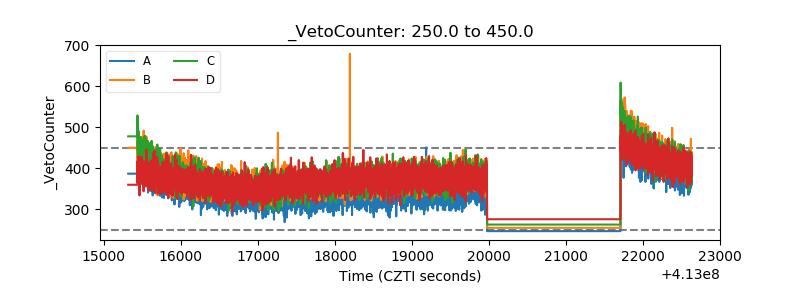 |