| Param | Original file | Final file |
|---|---|---|
| Filename | modeM0/AS1A12_022T01_9000005494_39734cztM0_level2.fits | modeM0/AS1A12_022T01_9000005494_39734cztM0_level2_quad_clean.evt |
| Size (bytes) | 397,751,040 | 89,821,440 |
| Size | 379.3 MB | 85.7 MB |
| Events in quadrant A | 3,228,358 | 628,165 |
| Events in quadrant B | 2,579,279 | 642,288 |
| Events in quadrant C | 4,197,813 | 578,669 |
| Events in quadrant D | 4,310,768 | 503,678 |
| Mode SS | |||
|---|---|---|---|
| Quadrant | BADHDUFLAG | Total packets | Discarded packets |
| A | 0 | 108 | 0 |
| B | 0 | 108 | 0 |
| C | 0 | 108 | 0 |
| D | 0 | 108 | 0 |
| Mode M0 | |||
|---|---|---|---|
| Quadrant | BADHDUFLAG | Total packets | Discarded packets |
| A | 0 | 12744 | 3 |
| B | 0 | 10988 | 2 |
| C | 0 | 16055 | 2 |
| D | 0 | 16316 | 2 |
| Mode M9 | |||
|---|---|---|---|
| Quadrant | BADHDUFLAG | Total packets | Discarded packets |
| A | 0 | 18 | 0 |
| B | 0 | 18 | 0 |
| C | 0 | 18 | 0 |
| D | 0 | 19 | 0 |
| Quadrant | Total seconds | Saturated seconds | Saturation percentage |
|---|---|---|---|
| A | 5236 | 88 | 1.680672% |
| B | 5236 | 29 | 0.553858% |
| C | 5236 | 271 | 5.175707% |
| D | 5236 | 605 | 11.554622% |
Noise dominated data is calculated using 1-second bins in cleaned event files. If a bin has >2000 counts, and if more than 50% of those come from <1% of pixels, then it is considered to be noise-dominated and hence unusable.
| Quadrant | # 1 sec bins | Bins with >0 counts | Bins with >2000 counts | High rate bins dominated by noise | Noise dominated (total time) | Noise dominated (detector-on time) | Marked lightcurve |
|---|---|---|---|---|---|---|---|
| A | 7088 | 5237 | 64 | 64 | 0.90% | 1.22% | 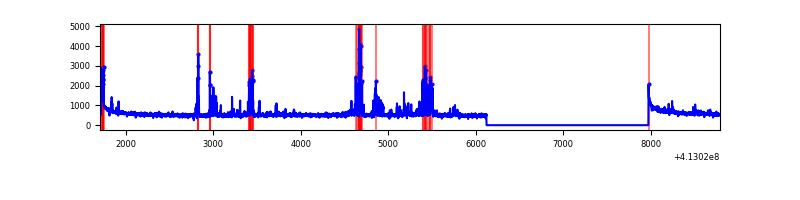 |
| B | 7088 | 5237 | 13 | 13 | 0.18% | 0.25% | 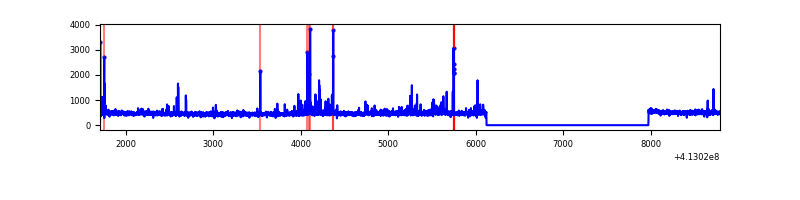 |
| C | 7088 | 5237 | 240 | 240 | 3.39% | 4.58% | 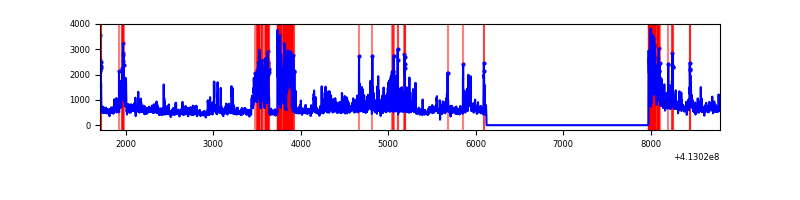 |
| D | 7088 | 5237 | 465 | 465 | 6.56% | 8.88% | 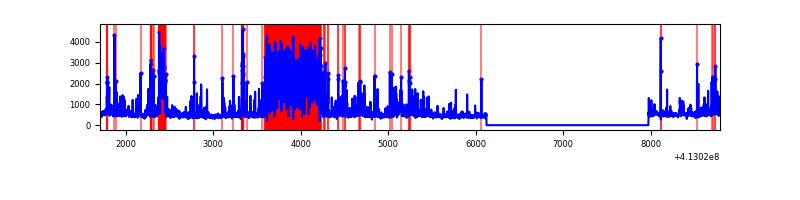 |
Top three noisy pixels from each quadrant. If the there are fewer than three noisy pixels in the level2.evt file, extra rows are filled as -1
| Pixel properties | Quadrant properties | ||||||
|---|---|---|---|---|---|---|---|
| Quadrant | DetID | PixID | Counts | Sigma | Mean | Median | Sigma |
| A | 10 | 83 | 433349 | 3550.4 | 605 | 595 | 121.9 |
| A | 9 | 143 | 304298 | 2491.64 | 605 | 595 | 121.9 |
| A | 15 | 174 | 103787 | 846.61 | 605 | 595 | 121.9 |
| B | 5 | 172 | 112028 | 971.1 | 597 | 581 | 114.8 |
| B | 5 | 255 | 31296 | 267.64 | 597 | 581 | 114.8 |
| B | 0 | 230 | 26871 | 229.08 | 597 | 581 | 114.8 |
| C | 15 | 208 | 906648 | 6747.45 | 575 | 580 | 134.3 |
| C | 9 | 187 | 774219 | 5761.26 | 575 | 580 | 134.3 |
| C | 15 | 214 | 233467 | 1734.3 | 575 | 580 | 134.3 |
| D | 12 | 233 | 1446084 | 10485.65 | 560 | 545 | 137.9 |
| D | 12 | 227 | 507580 | 3677.93 | 560 | 545 | 137.9 |
| D | 2 | 250 | 139021 | 1004.48 | 560 | 545 | 137.9 |
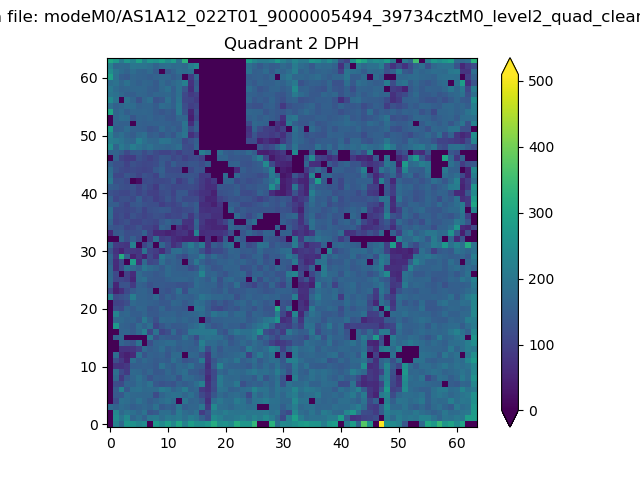
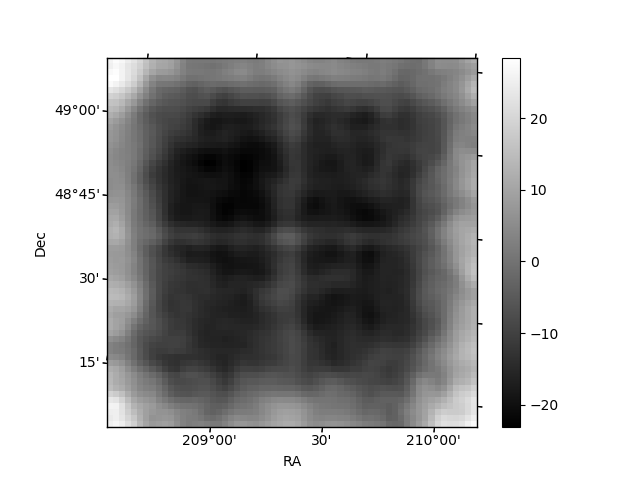
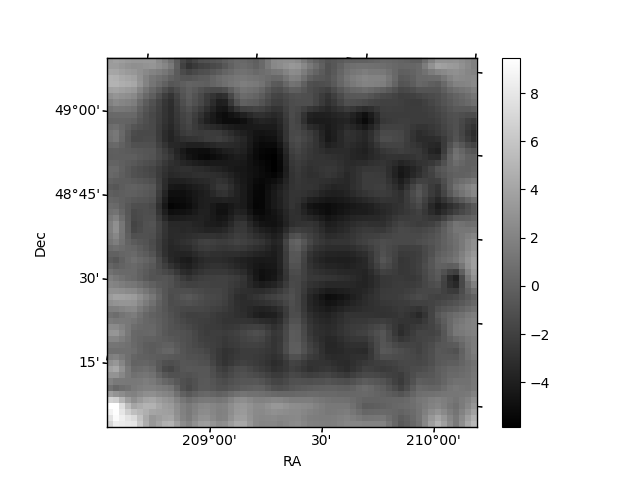
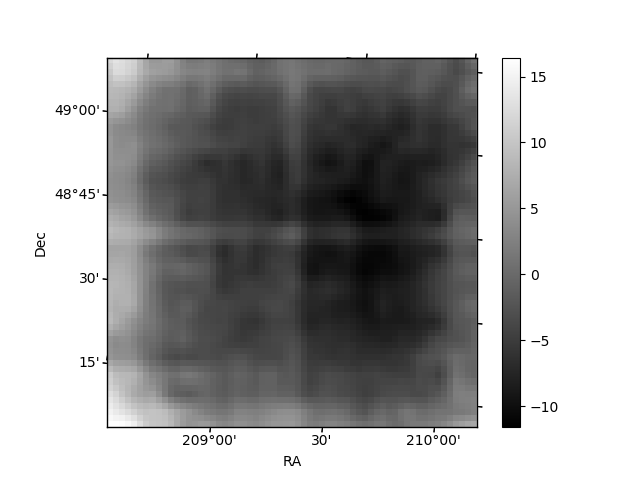
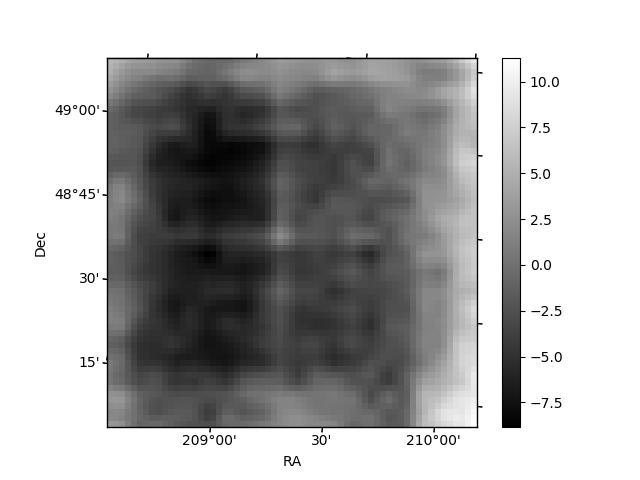
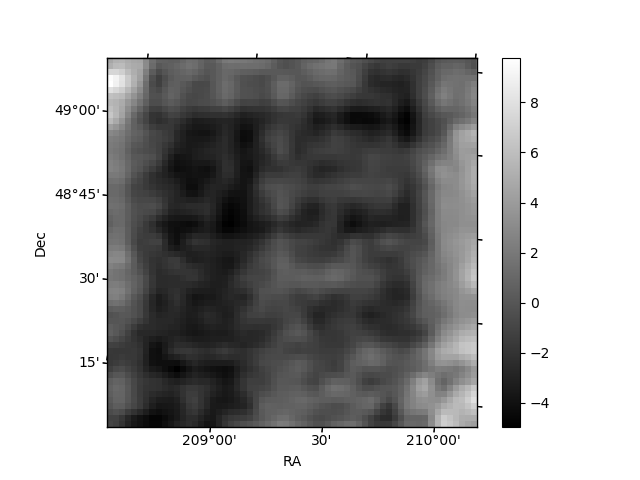
Histogram calculated using DETX and DETY for each event in the final _common_clean file
| Quadrant A | 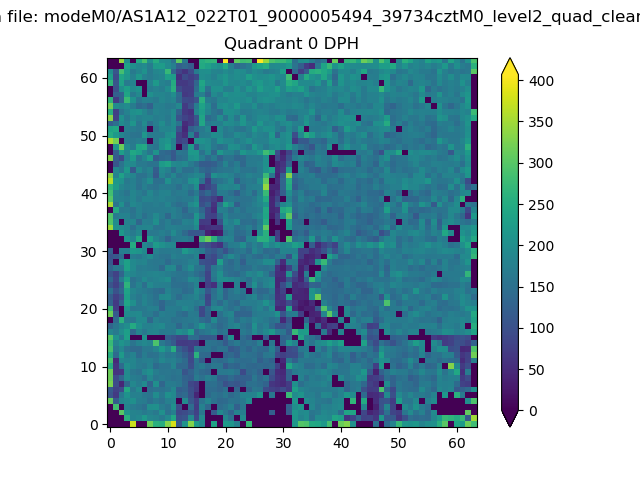 |
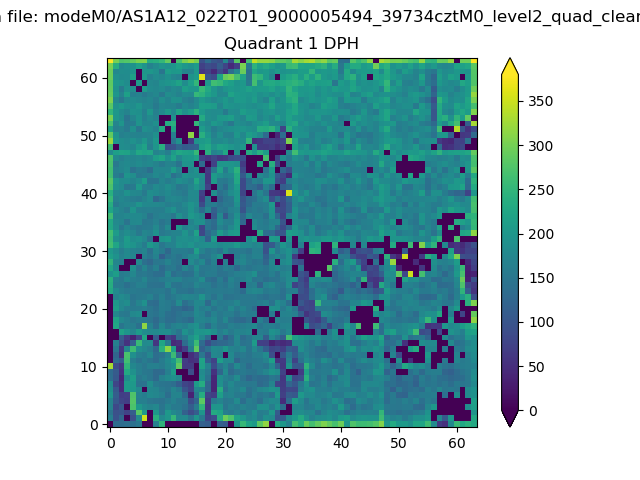 |
Quadrant B |
|---|---|---|---|
| Quadrant D | 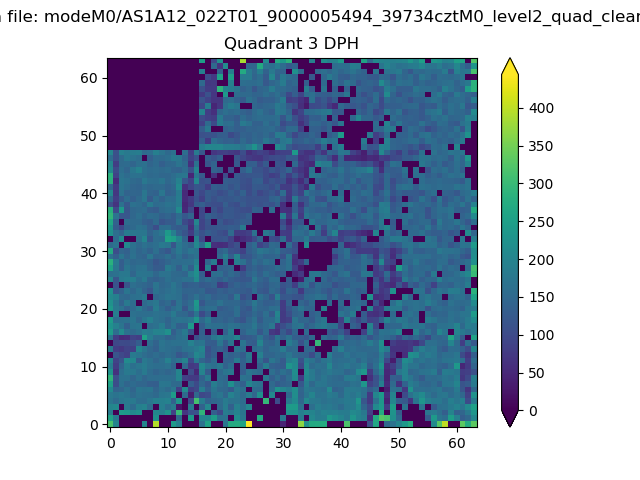 |
 |
Quadrant C |
| Plot type | Count rate plots | Images |
|---|---|---|
| Comparison with Poisson distribution Blue bars denote a histogram of data divided into 1 sec bins. Red curve is a Poisson curve with rate = median count rate of data. |
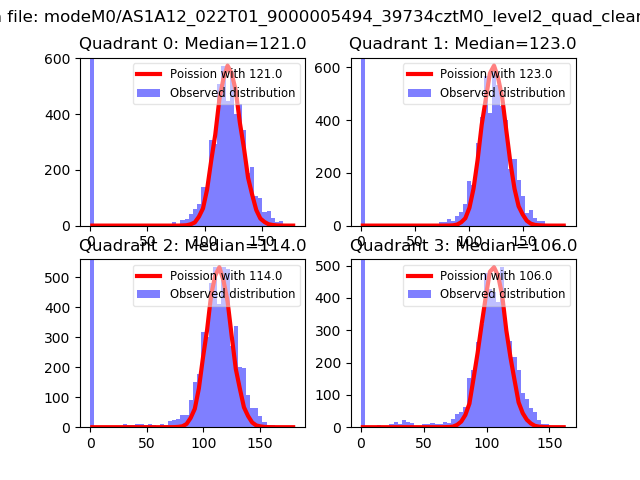 |
 |
| Quadrant-wise count rates Data is divided into 100 sec bins |
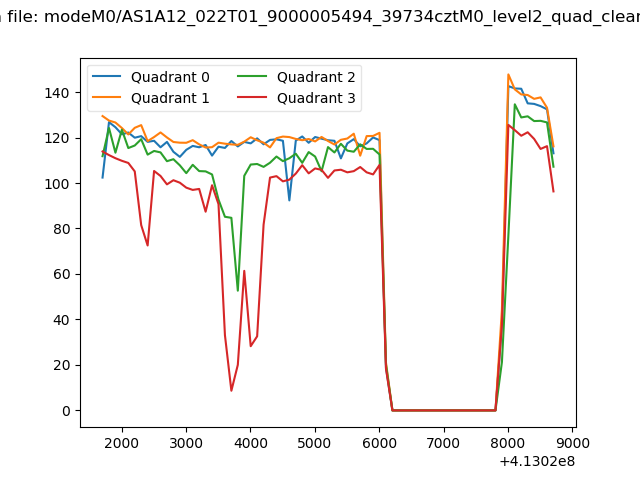 |
|
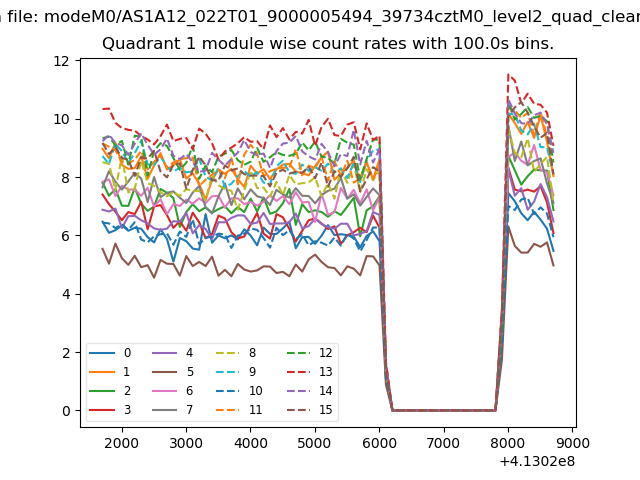
| Module-wise count rates for Quadrant A Data is divided into 100 sec bins |
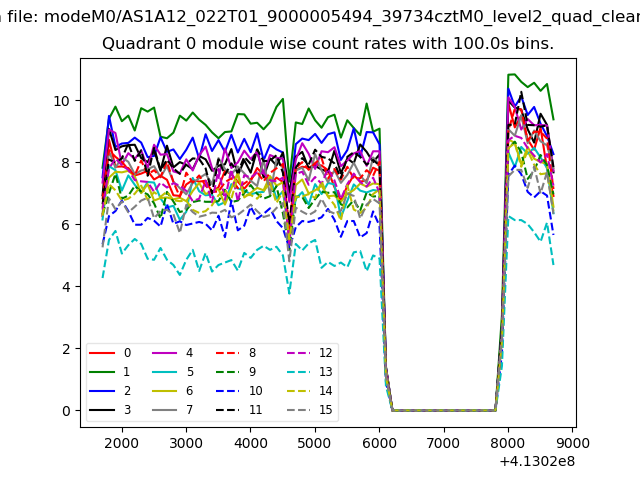 |
 |
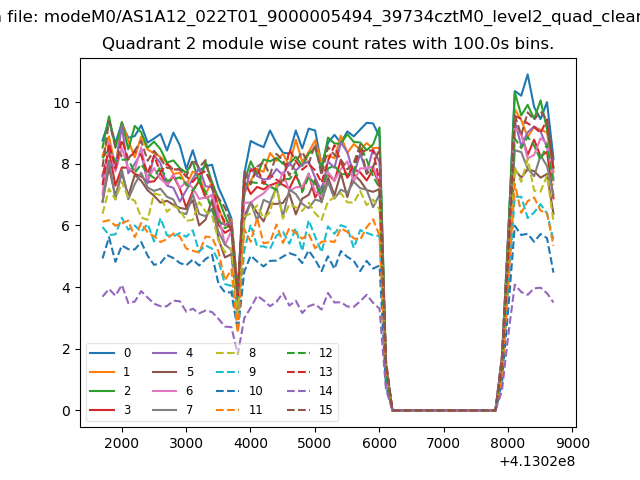
| Module-wise count rates for Quadrant B Data is divided into 100 sec bins |
 |
 |
| Module-wise count rates for Quadrant C Data is divided into 100 sec bins |
 |
 |
| Module-wise count rates for Quadrant D Data is divided into 100 sec bins |
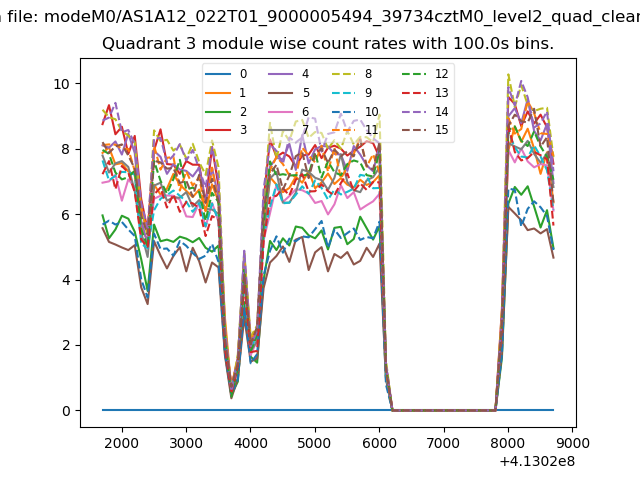 |
 |
| Parameter | Plot |
|---|---|
| CZT HV Monitor | 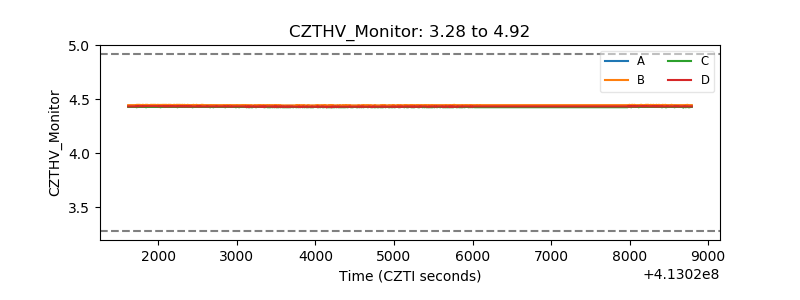 |
| D_VDD | 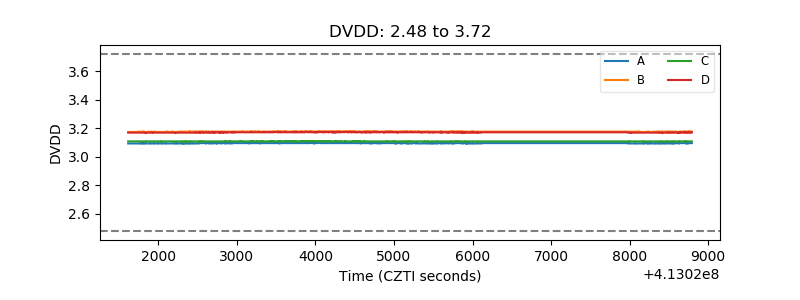 |
| Temperature 1 | 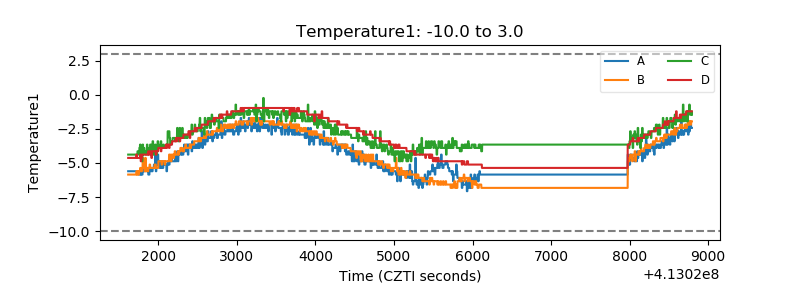 |
| Veto HV Monitor | 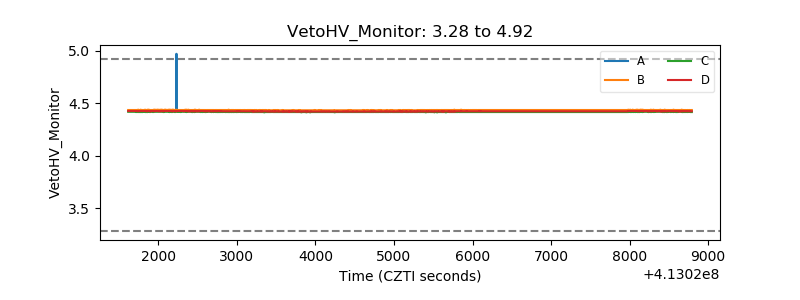 |
| Veto LLD | 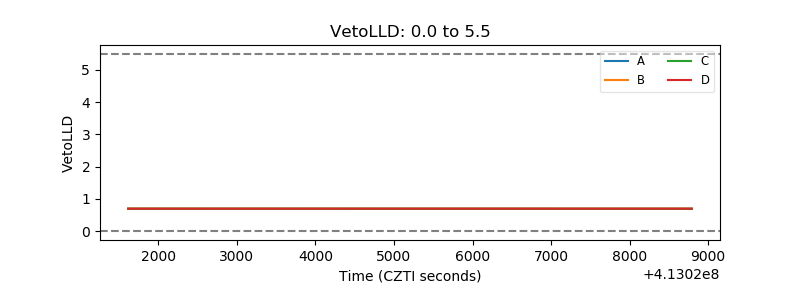 |
| Alpha Counter | 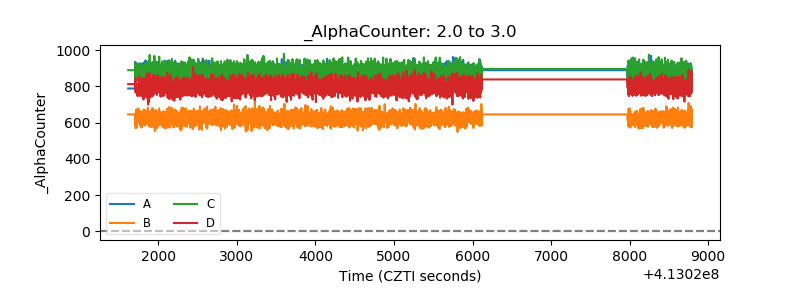 |
| _CPM_Rate | 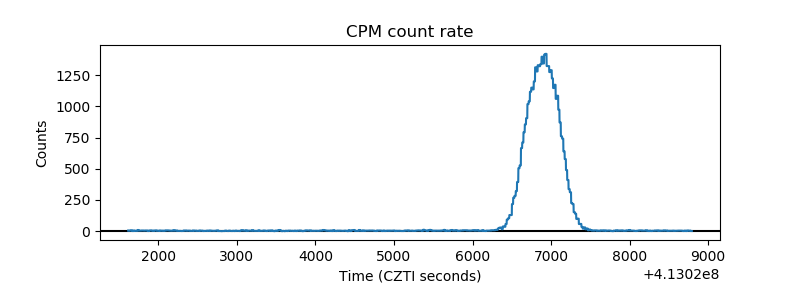 |
| CZT Counter | 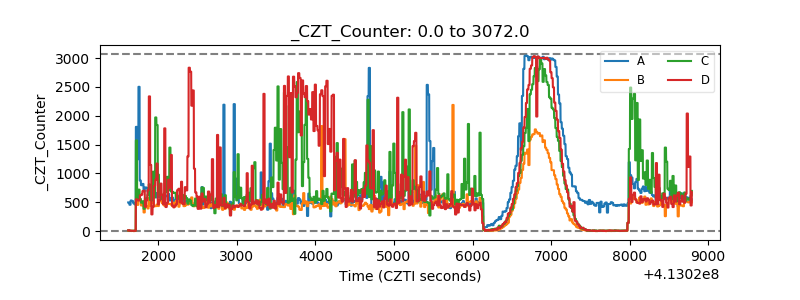 |
| +2.5 Volts monitor | 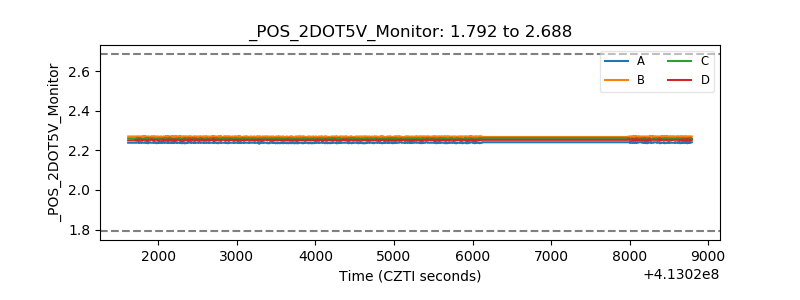 |
| +5 Volts monitor |  |
| _ROLL_ROT | 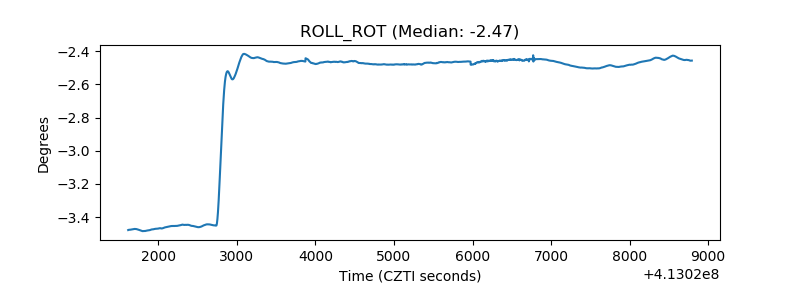 |
| _Roll_DEC | 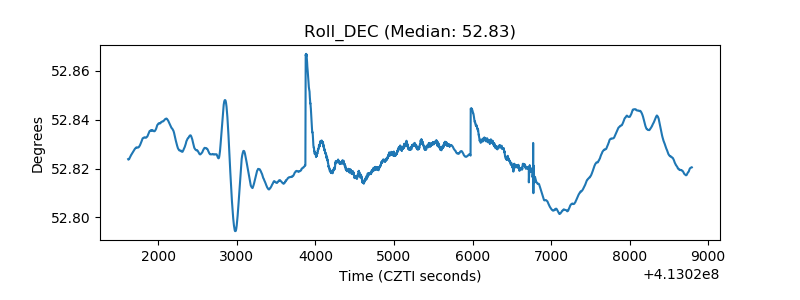 |
| _Roll_RA | 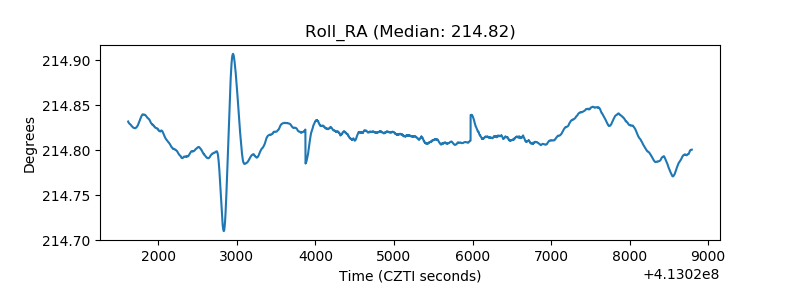 |
| Veto Counter | 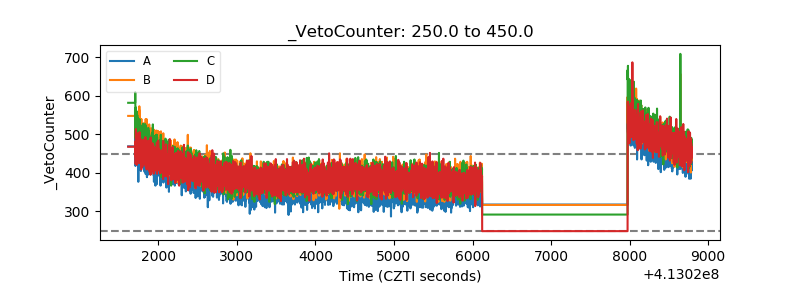 |