| Param | Original file | Final file |
|---|---|---|
| Filename | modeM0/AS1A12_022T01_9000005494_39735cztM0_level2.fits | modeM0/AS1A12_022T01_9000005494_39735cztM0_level2_quad_clean.evt |
| Size (bytes) | 373,204,800 | 99,982,080 |
| Size | 355.9 MB | 95.4 MB |
| Events in quadrant A | 3,305,627 | 693,234 |
| Events in quadrant B | 2,724,166 | 706,983 |
| Events in quadrant C | 3,946,319 | 644,896 |
| Events in quadrant D | 3,418,914 | 604,810 |
| Mode SS | |||
|---|---|---|---|
| Quadrant | BADHDUFLAG | Total packets | Discarded packets |
| A | 0 | 110 | 0 |
| B | 0 | 110 | 0 |
| C | 0 | 110 | 0 |
| D | 0 | 110 | 0 |
| Mode M0 | |||
|---|---|---|---|
| Quadrant | BADHDUFLAG | Total packets | Discarded packets |
| A | 0 | 13074 | 3 |
| B | 0 | 11342 | 2 |
| C | 0 | 15235 | 2 |
| D | 0 | 13632 | 2 |
| Mode M9 | |||
|---|---|---|---|
| Quadrant | BADHDUFLAG | Total packets | Discarded packets |
| A | 0 | 20 | 0 |
| B | 0 | 20 | 0 |
| C | 0 | 20 | 0 |
| D | 0 | 20 | 0 |
| Quadrant | Total seconds | Saturated seconds | Saturation percentage |
|---|---|---|---|
| A | 5396 | 83 | 1.538176% |
| B | 5396 | 15 | 0.277984% |
| C | 5396 | 156 | 2.891030% |
| D | 5397 | 139 | 2.575505% |
Noise dominated data is calculated using 1-second bins in cleaned event files. If a bin has >2000 counts, and if more than 50% of those come from <1% of pixels, then it is considered to be noise-dominated and hence unusable.
| Quadrant | # 1 sec bins | Bins with >0 counts | Bins with >2000 counts | High rate bins dominated by noise | Noise dominated (total time) | Noise dominated (detector-on time) | Marked lightcurve |
|---|---|---|---|---|---|---|---|
| A | 7398 | 5397 | 46 | 46 | 0.62% | 0.85% | 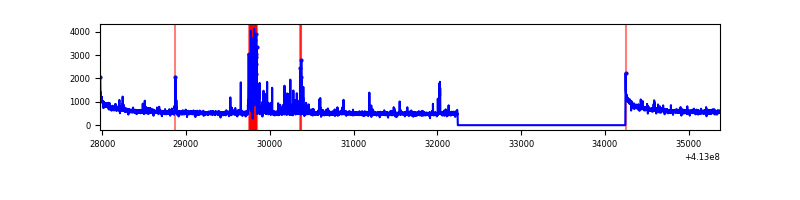 |
| B | 7398 | 5397 | 7 | 7 | 0.09% | 0.13% | 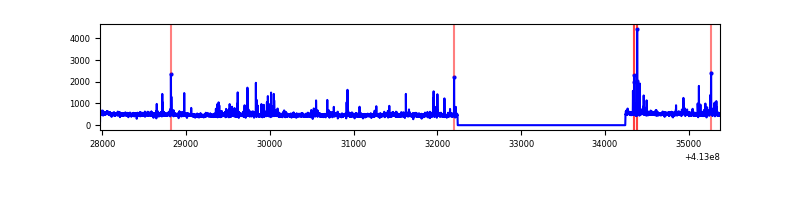 |
| C | 7398 | 5397 | 123 | 123 | 1.66% | 2.28% | 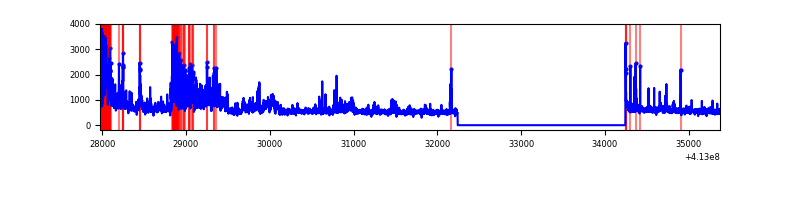 |
| D | 7399 | 5398 | 103 | 103 | 1.39% | 1.91% | 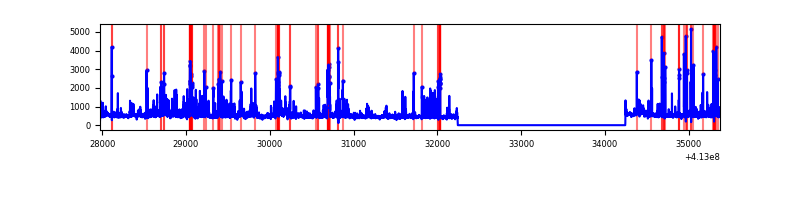 |
Top three noisy pixels from each quadrant. If the there are fewer than three noisy pixels in the level2.evt file, extra rows are filled as -1
| Pixel properties | Quadrant properties | ||||||
|---|---|---|---|---|---|---|---|
| Quadrant | DetID | PixID | Counts | Sigma | Mean | Median | Sigma |
| A | 10 | 83 | 460750 | 3516.11 | 650 | 639 | 130.9 |
| A | 13 | 248 | 212157 | 1616.39 | 650 | 639 | 130.9 |
| A | 15 | 174 | 55337 | 418.0 | 650 | 639 | 130.9 |
| B | 5 | 255 | 100759 | 823.36 | 639 | 622 | 121.6 |
| B | 0 | 230 | 29787 | 239.81 | 639 | 622 | 121.6 |
| B | 5 | 172 | 23259 | 186.13 | 639 | 622 | 121.6 |
| C | 9 | 187 | 904640 | 6307.27 | 620 | 626 | 143.3 |
| C | 15 | 208 | 289366 | 2014.53 | 620 | 626 | 143.3 |
| C | 15 | 214 | 238485 | 1659.53 | 620 | 626 | 143.3 |
| D | 12 | 227 | 379421 | 2470.37 | 630 | 613 | 153.3 |
| D | 12 | 233 | 349465 | 2275.01 | 630 | 613 | 153.3 |
| D | 2 | 250 | 85503 | 553.6 | 630 | 613 | 153.3 |
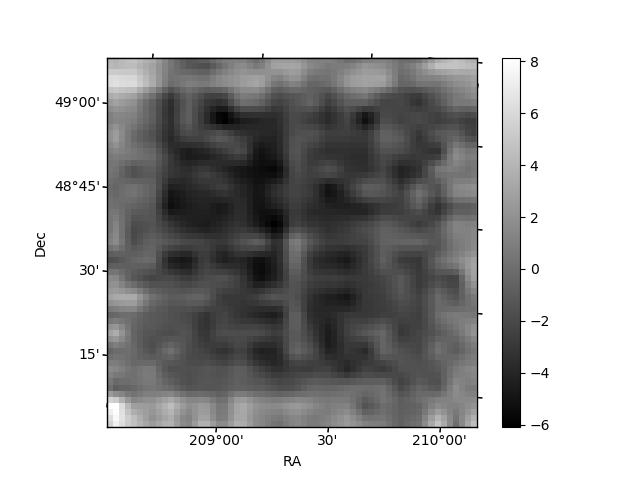
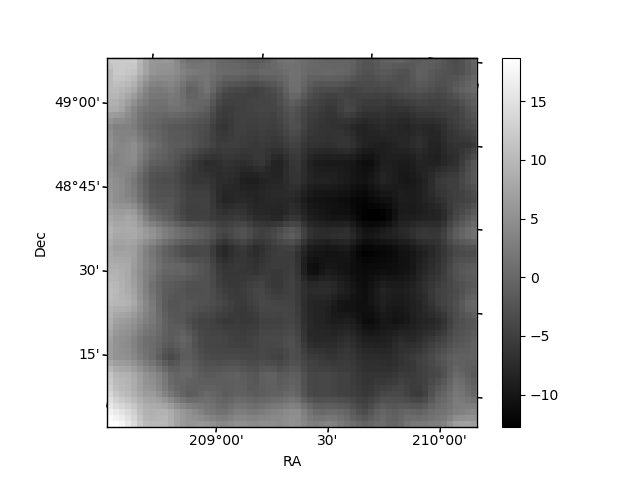
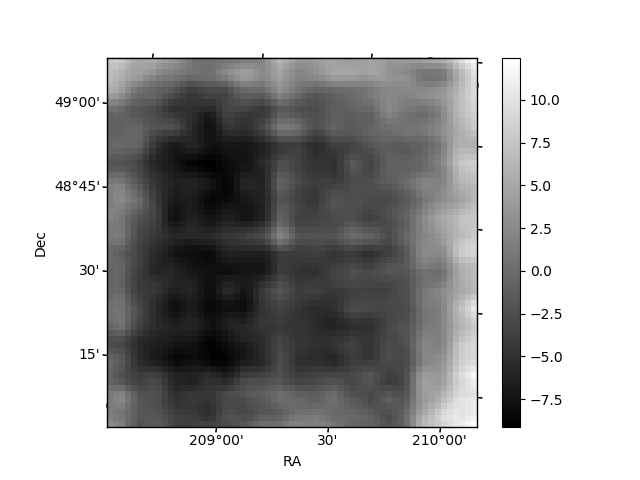
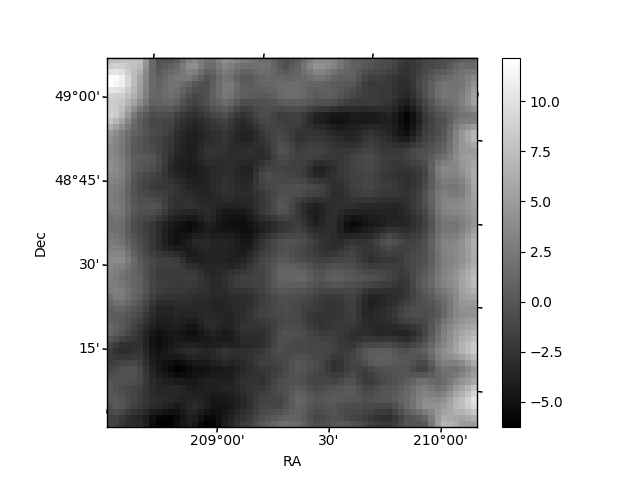
Histogram calculated using DETX and DETY for each event in the final _common_clean file
| Quadrant A | 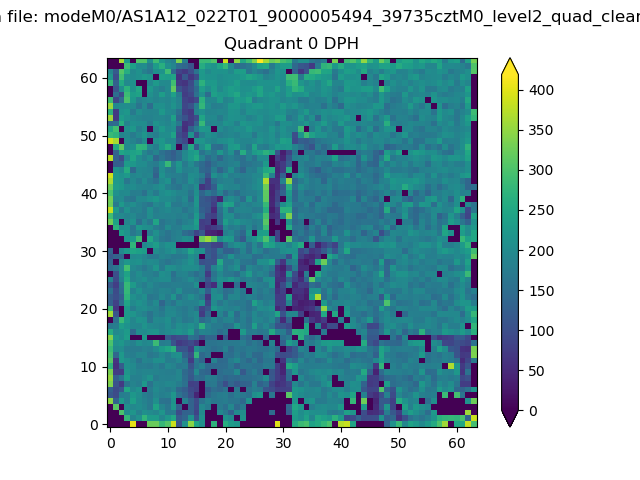 |
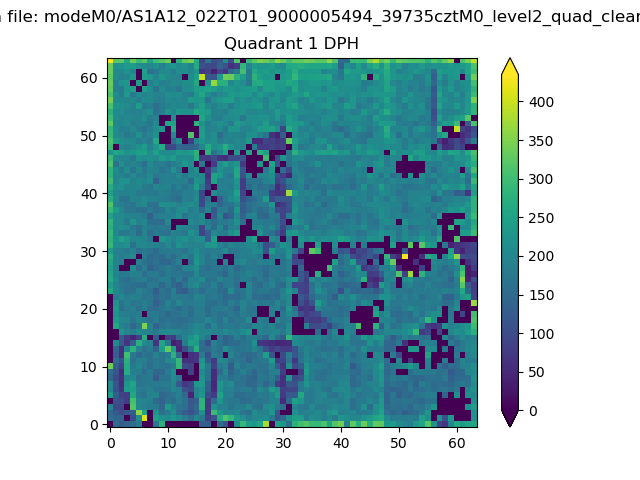 |
Quadrant B |
|---|---|---|---|
| Quadrant D | 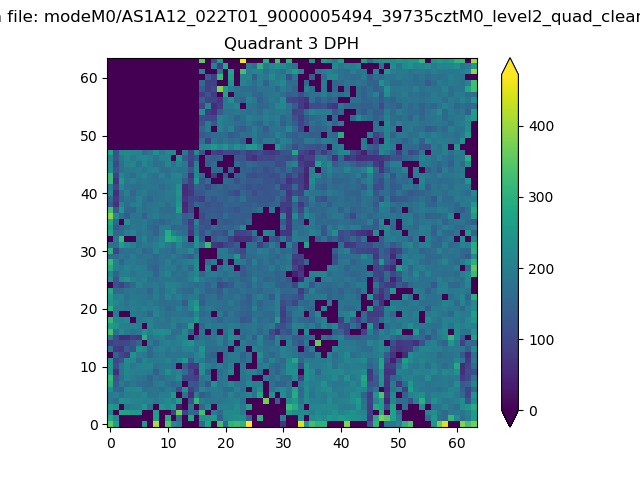 |
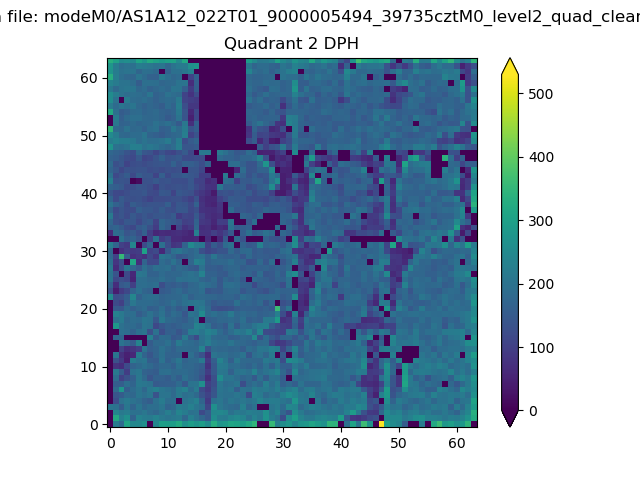 |
Quadrant C |
| Plot type | Count rate plots | Images |
|---|---|---|
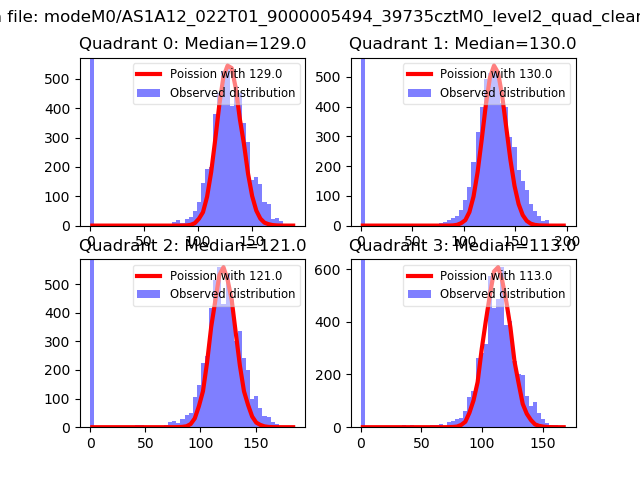
| Comparison with Poisson distribution Blue bars denote a histogram of data divided into 1 sec bins. Red curve is a Poisson curve with rate = median count rate of data. |
 |
 |
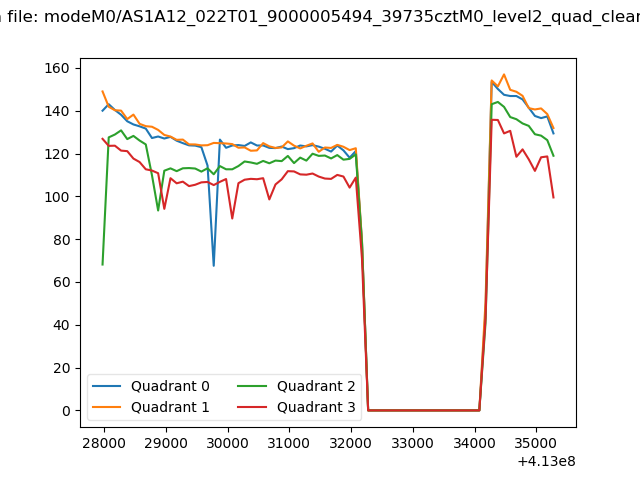
| Quadrant-wise count rates Data is divided into 100 sec bins |
 |
|
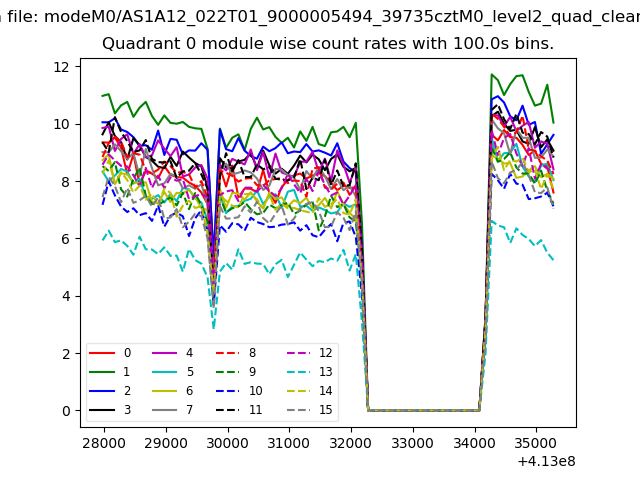
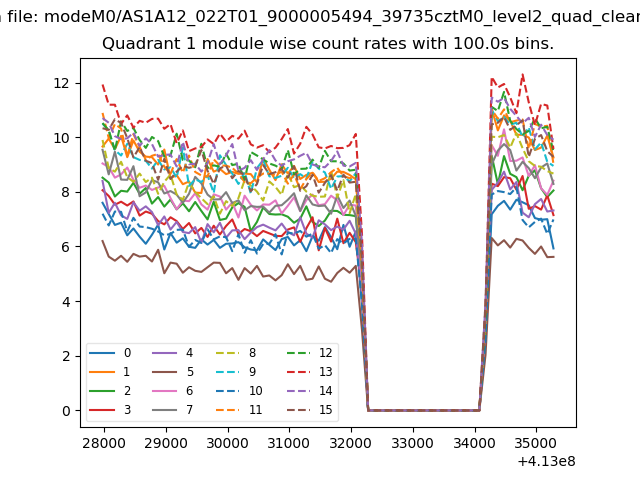
| Module-wise count rates for Quadrant A Data is divided into 100 sec bins |
 |
 |
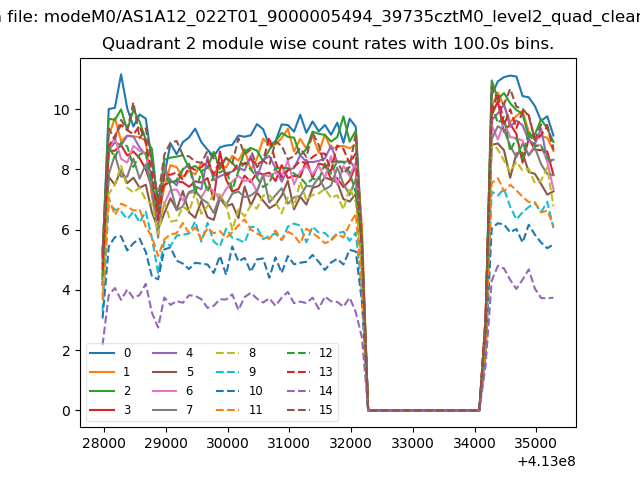
| Module-wise count rates for Quadrant B Data is divided into 100 sec bins |
 |
 |
| Module-wise count rates for Quadrant C Data is divided into 100 sec bins |
 |
 |
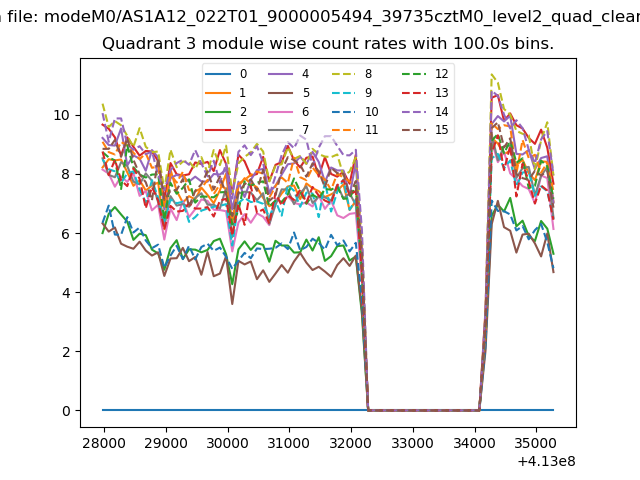
| Module-wise count rates for Quadrant D Data is divided into 100 sec bins |
 |
 |
| Parameter | Plot |
|---|---|
| CZT HV Monitor | 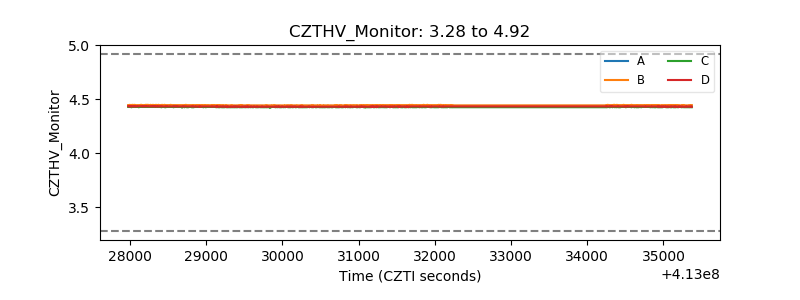 |
| D_VDD | 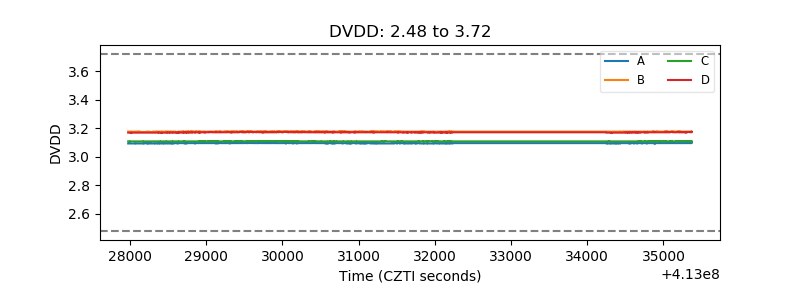 |
| Temperature 1 | 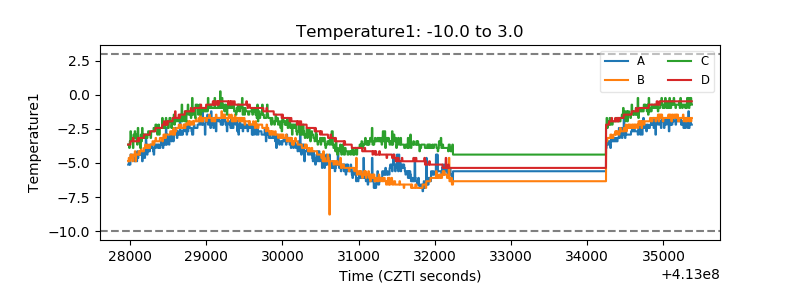 |
| Veto HV Monitor | 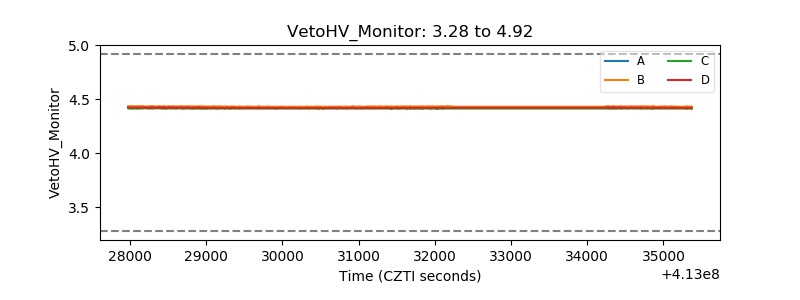 |
| Veto LLD | 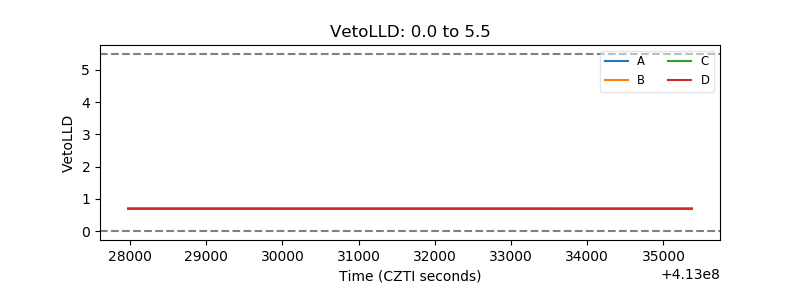 |
| Alpha Counter | 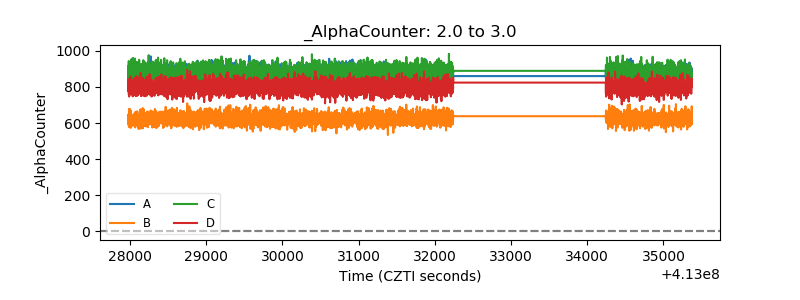 |
| _CPM_Rate | 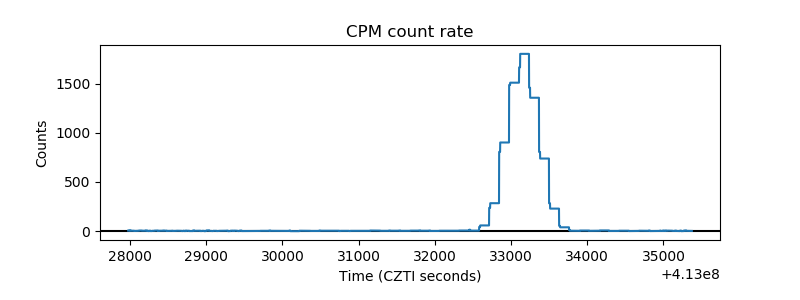 |
| CZT Counter | 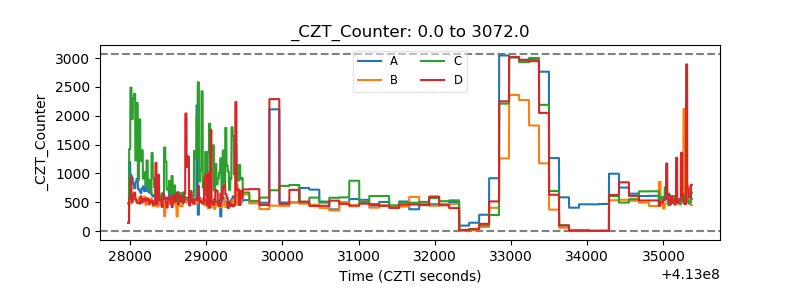 |
| +2.5 Volts monitor |  |
| +5 Volts monitor | 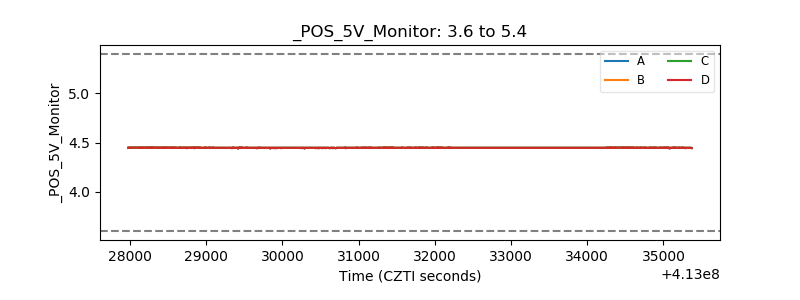 |
| _ROLL_ROT | 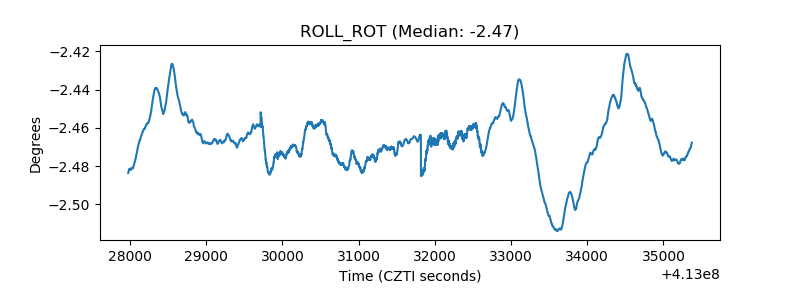 |
| _Roll_DEC | 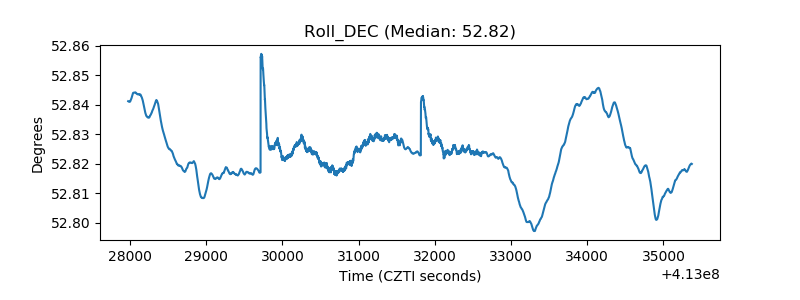 |
| _Roll_RA | 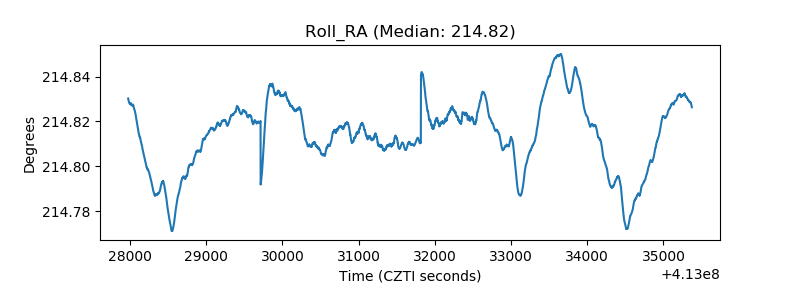 |
| Veto Counter | 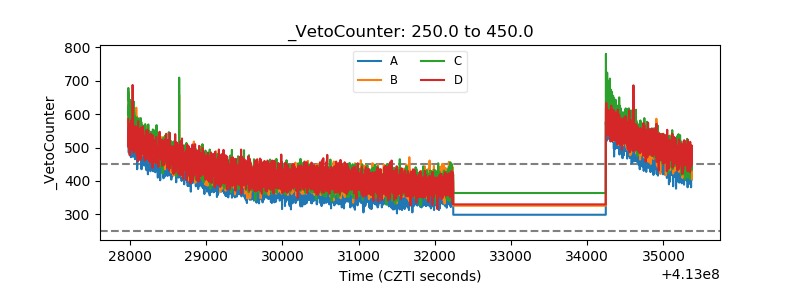 |