| Param | Original file | Final file |
|---|---|---|
| Filename | modeM0/AS1A12_022T01_9000005494_39736cztM0_level2.fits | modeM0/AS1A12_022T01_9000005494_39736cztM0_level2_quad_clean.evt |
| Size (bytes) | 388,031,040 | 98,631,360 |
| Size | 370.1 MB | 94.1 MB |
| Events in quadrant A | 3,394,405 | 685,112 |
| Events in quadrant B | 2,720,730 | 705,993 |
| Events in quadrant C | 3,360,921 | 653,525 |
| Events in quadrant D | 4,482,999 | 577,665 |
| Mode SS | |||
|---|---|---|---|
| Quadrant | BADHDUFLAG | Total packets | Discarded packets |
| A | 0 | 106 | 0 |
| B | 0 | 106 | 0 |
| C | 0 | 106 | 0 |
| D | 0 | 106 | 0 |
| Mode M0 | |||
|---|---|---|---|
| Quadrant | BADHDUFLAG | Total packets | Discarded packets |
| A | 0 | 13306 | 2 |
| B | 0 | 11190 | 1 |
| C | 0 | 13331 | 1 |
| D | 0 | 16666 | 1 |
| Mode M9 | |||
|---|---|---|---|
| Quadrant | BADHDUFLAG | Total packets | Discarded packets |
| A | 0 | 27 | 0 |
| B | 0 | 27 | 0 |
| C | 0 | 27 | 0 |
| D | 0 | 28 | 0 |
| Quadrant | Total seconds | Saturated seconds | Saturation percentage |
|---|---|---|---|
| A | 5202 | 141 | 2.710496% |
| B | 5202 | 34 | 0.653595% |
| C | 5202 | 70 | 1.345636% |
| D | 5202 | 449 | 8.631296% |
Noise dominated data is calculated using 1-second bins in cleaned event files. If a bin has >2000 counts, and if more than 50% of those come from <1% of pixels, then it is considered to be noise-dominated and hence unusable.
| Quadrant | # 1 sec bins | Bins with >0 counts | Bins with >2000 counts | High rate bins dominated by noise | Noise dominated (total time) | Noise dominated (detector-on time) | Marked lightcurve |
|---|---|---|---|---|---|---|---|
| A | 7295 | 5203 | 96 | 96 | 1.32% | 1.85% | 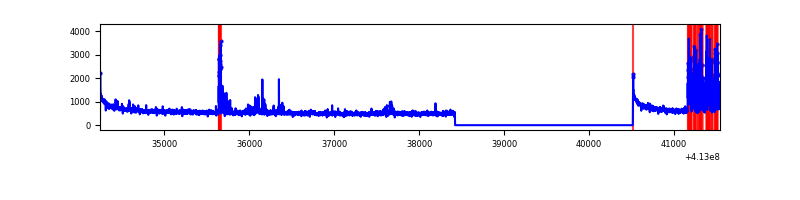 |
| B | 7295 | 5203 | 17 | 17 | 0.23% | 0.33% | 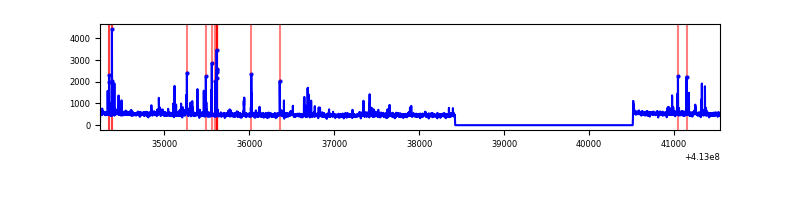 |
| C | 7295 | 5203 | 57 | 57 | 0.78% | 1.10% | 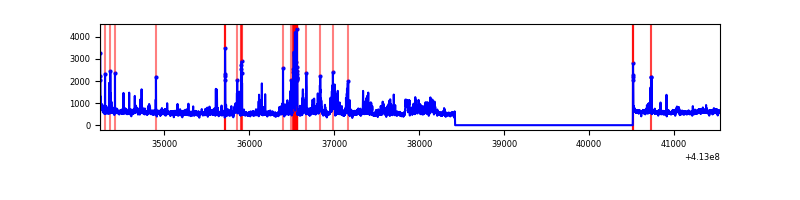 |
| D | 7295 | 5203 | 424 | 424 | 5.81% | 8.15% | 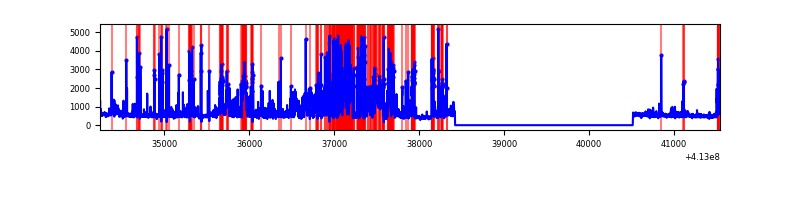 |
Top three noisy pixels from each quadrant. If the there are fewer than three noisy pixels in the level2.evt file, extra rows are filled as -1
| Pixel properties | Quadrant properties | ||||||
|---|---|---|---|---|---|---|---|
| Quadrant | DetID | PixID | Counts | Sigma | Mean | Median | Sigma |
| A | 10 | 83 | 462941 | 3607.69 | 636 | 627 | 128.1 |
| A | 13 | 248 | 400513 | 3120.53 | 636 | 627 | 128.1 |
| A | 15 | 174 | 32331 | 247.4 | 636 | 627 | 128.1 |
| B | 5 | 172 | 92082 | 765.85 | 630 | 614 | 119.4 |
| B | 5 | 255 | 55591 | 460.32 | 630 | 614 | 119.4 |
| B | 15 | 85 | 27815 | 227.75 | 630 | 614 | 119.4 |
| C | 9 | 187 | 416357 | 2945.69 | 616 | 621 | 141.1 |
| C | 15 | 214 | 229096 | 1618.86 | 616 | 621 | 141.1 |
| C | 15 | 208 | 217294 | 1535.23 | 616 | 621 | 141.1 |
| D | 12 | 227 | 1872315 | 12743.22 | 605 | 590 | 146.9 |
| D | 12 | 233 | 67158 | 453.21 | 605 | 590 | 146.9 |
| D | 2 | 250 | 63011 | 424.98 | 605 | 590 | 146.9 |
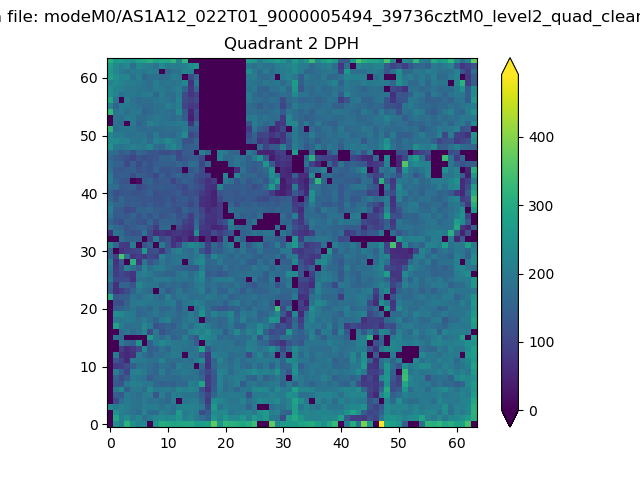
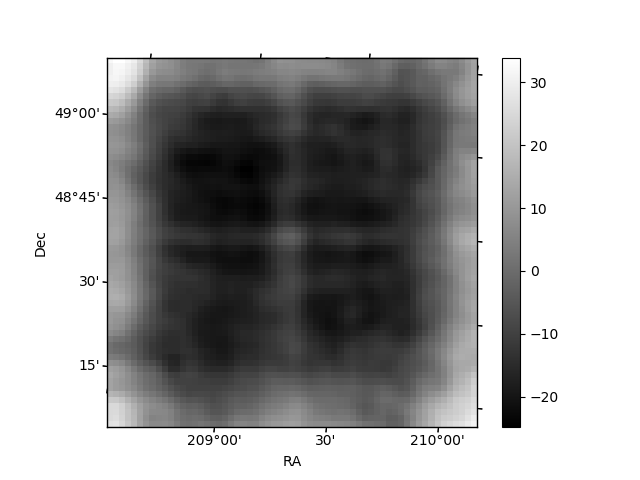
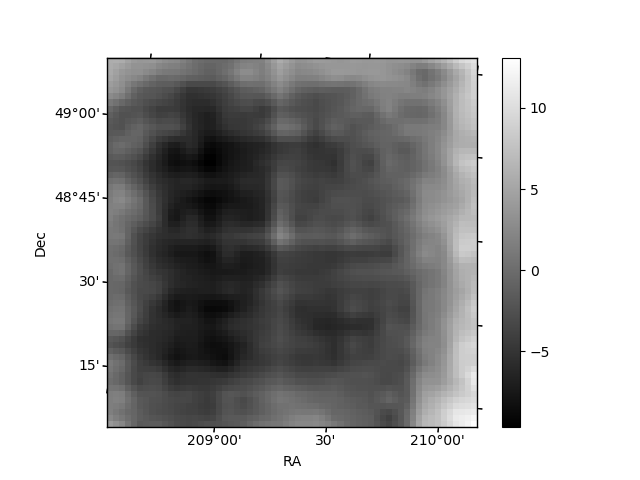
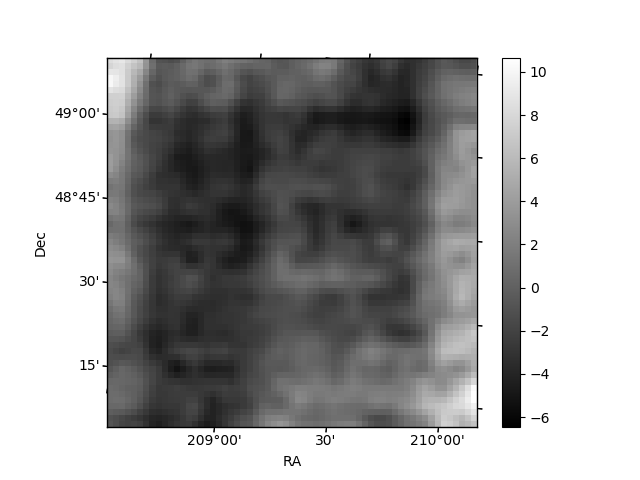
Histogram calculated using DETX and DETY for each event in the final _common_clean file
| Quadrant A | 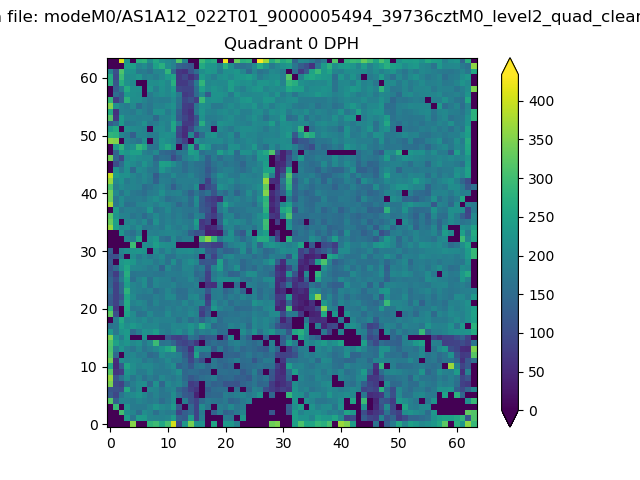 |
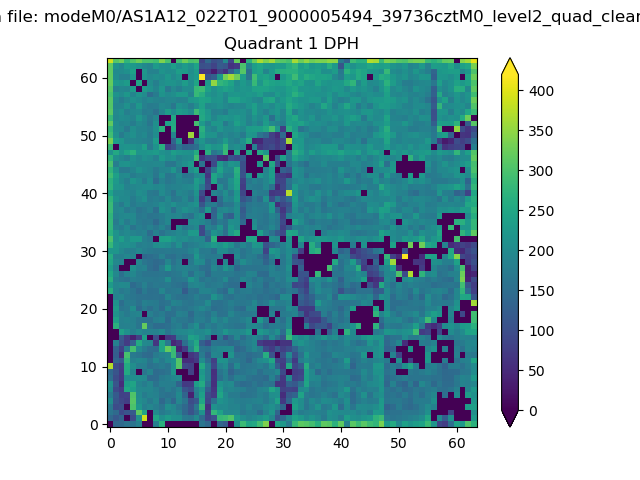 |
Quadrant B |
|---|---|---|---|
| Quadrant D | 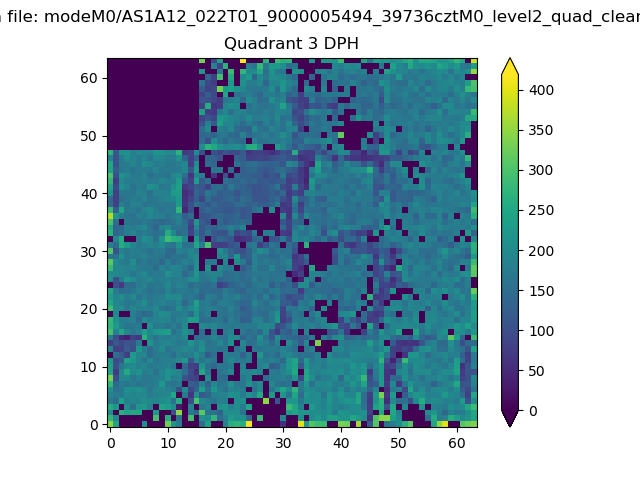 |
 |
Quadrant C |
| Plot type | Count rate plots | Images |
|---|---|---|
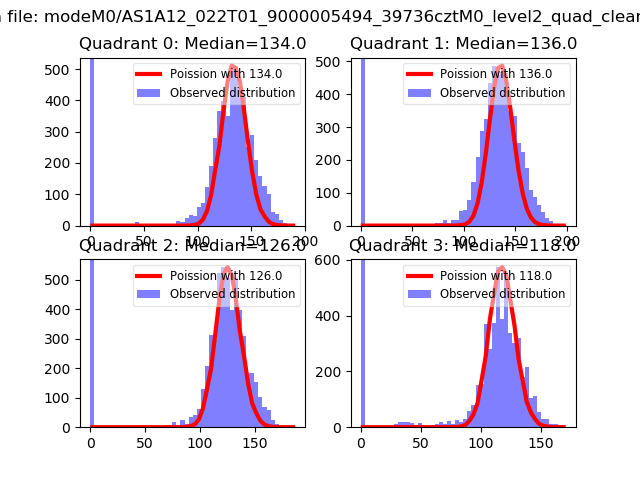
| Comparison with Poisson distribution Blue bars denote a histogram of data divided into 1 sec bins. Red curve is a Poisson curve with rate = median count rate of data. |
 |
 |
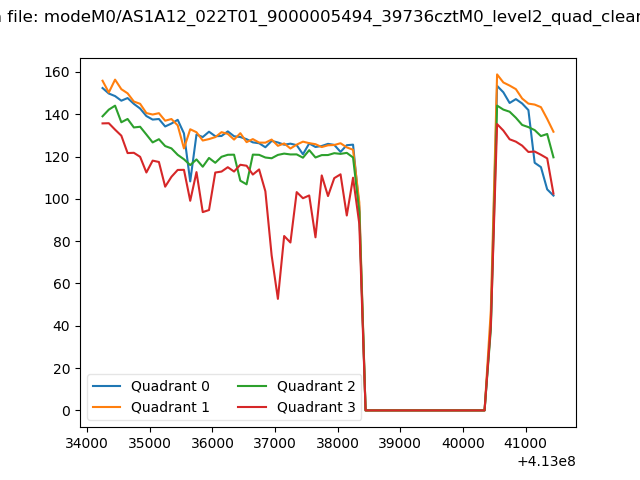
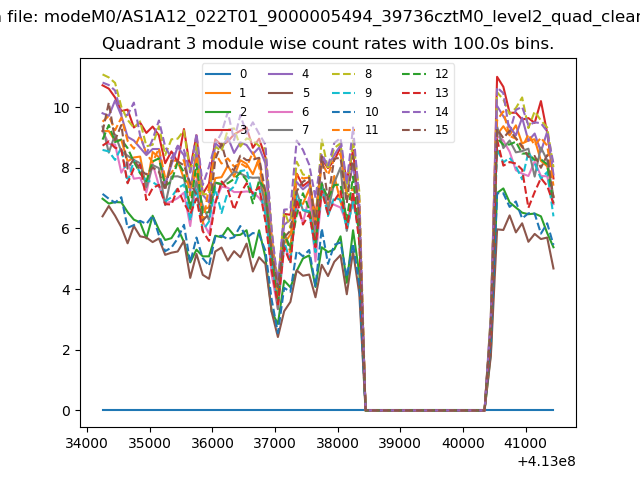
| Quadrant-wise count rates Data is divided into 100 sec bins |
 |
|
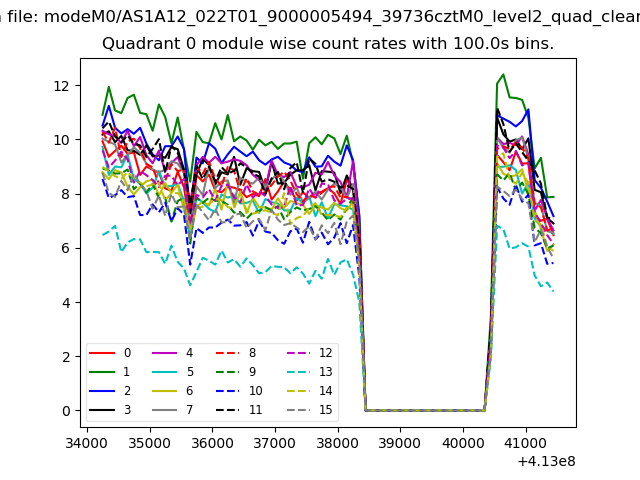
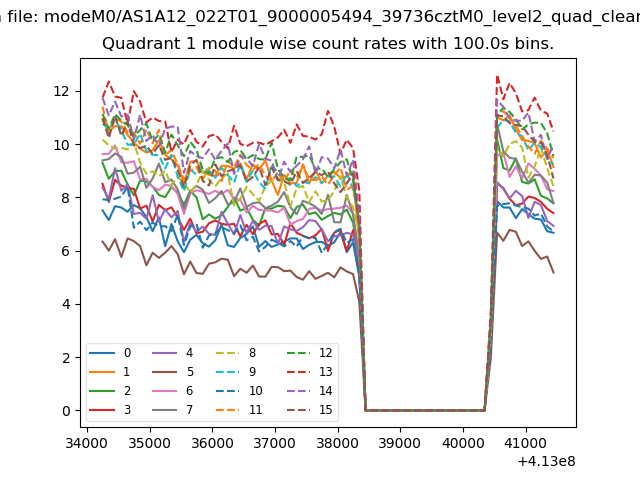
| Module-wise count rates for Quadrant A Data is divided into 100 sec bins |
 |
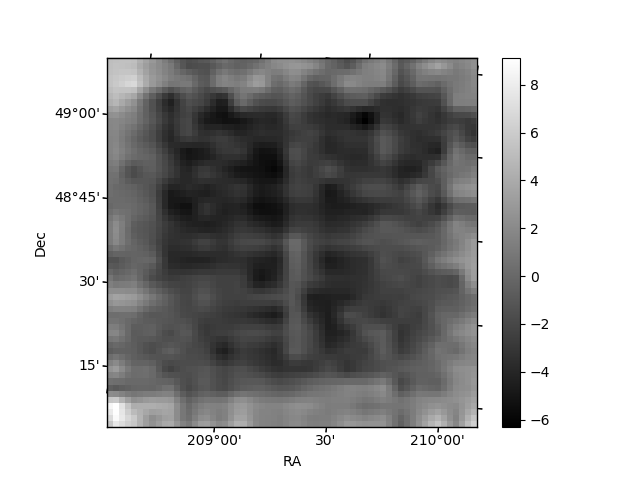 |
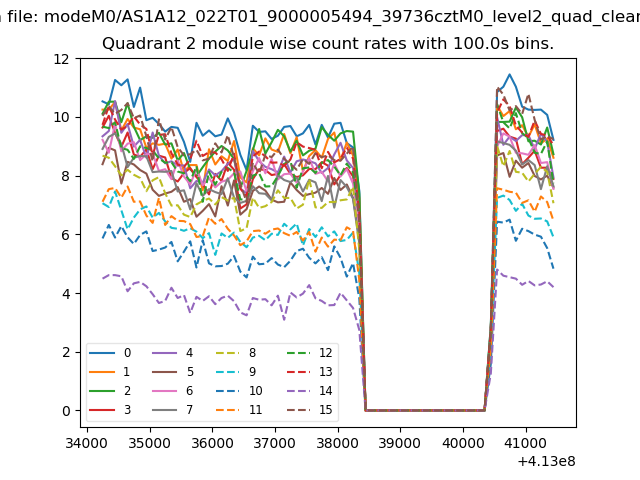
| Module-wise count rates for Quadrant B Data is divided into 100 sec bins |
 |
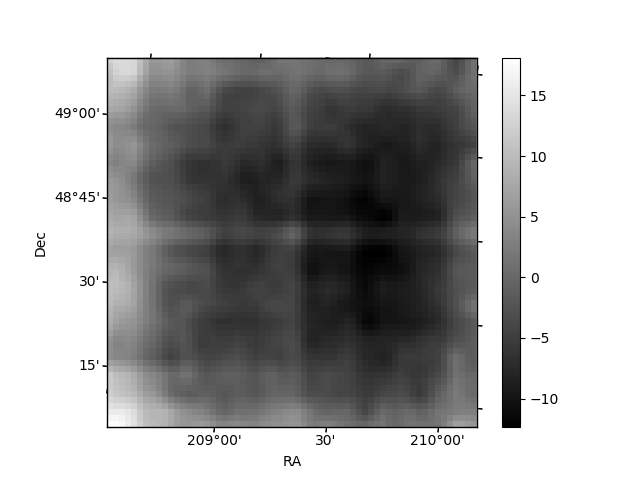 |
| Module-wise count rates for Quadrant C Data is divided into 100 sec bins |
 |
 |
| Module-wise count rates for Quadrant D Data is divided into 100 sec bins |
 |
 |
| Parameter | Plot |
|---|---|
| CZT HV Monitor |  |
| D_VDD | 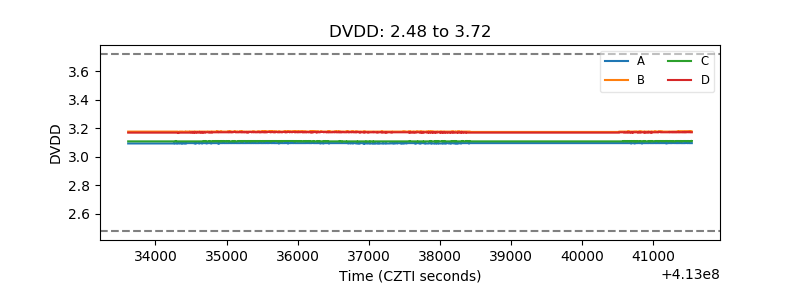 |
| Temperature 1 | 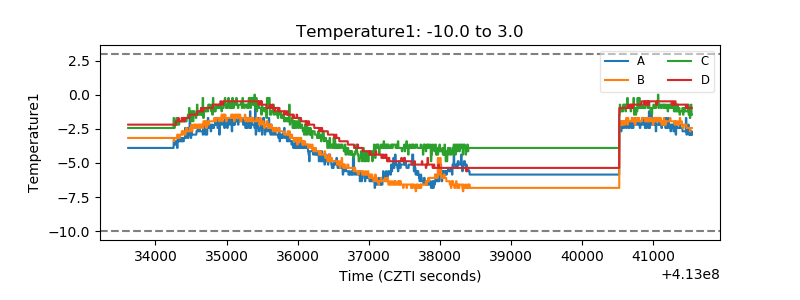 |
| Veto HV Monitor | 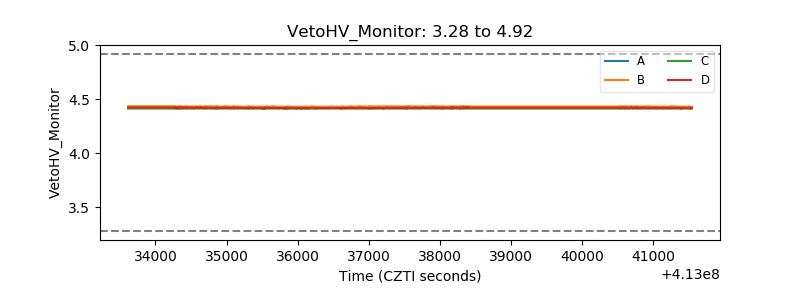 |
| Veto LLD | 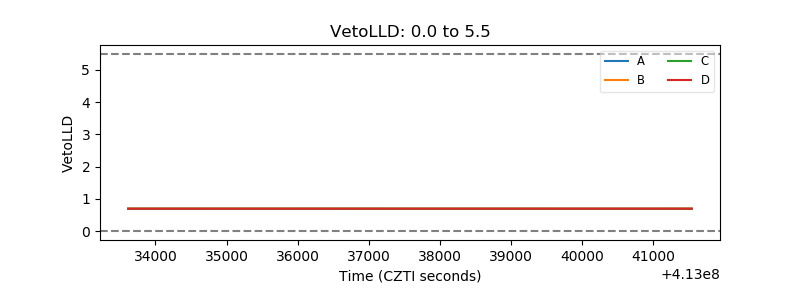 |
| Alpha Counter | 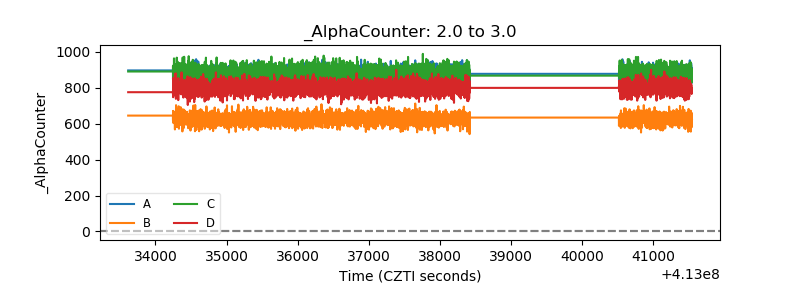 |
| _CPM_Rate | 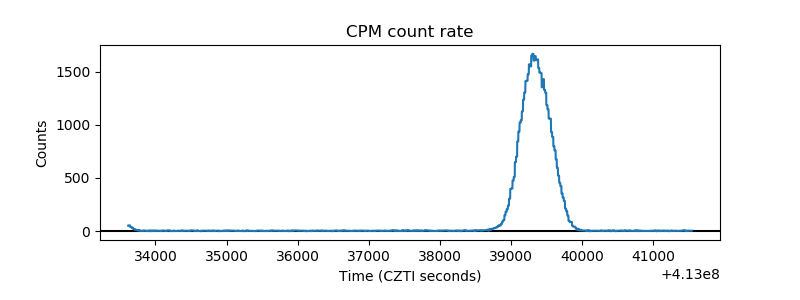 |
| CZT Counter | 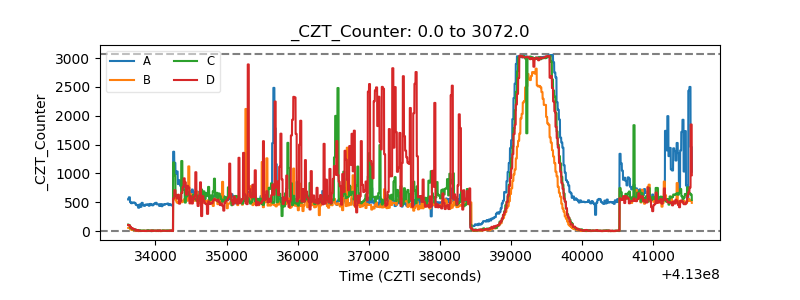 |
| +2.5 Volts monitor | 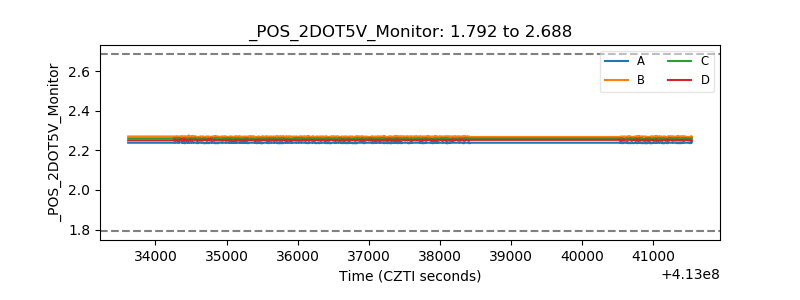 |
| +5 Volts monitor | 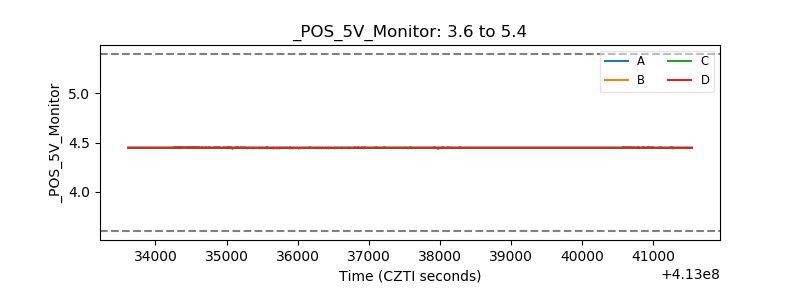 |
| _ROLL_ROT | 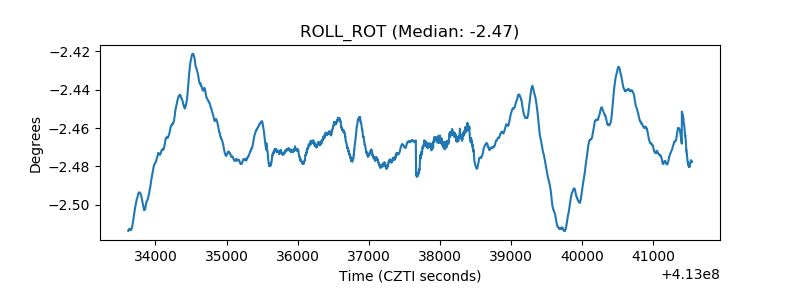 |
| _Roll_DEC | 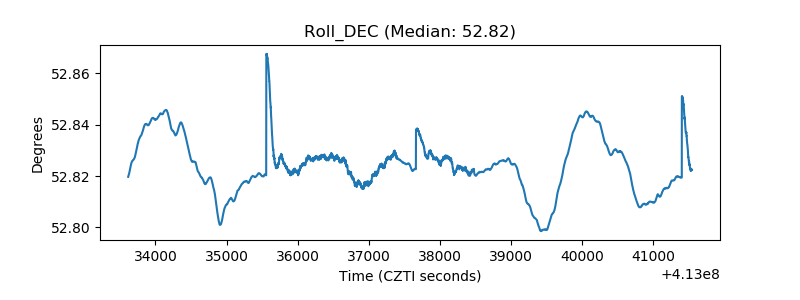 |
| _Roll_RA | 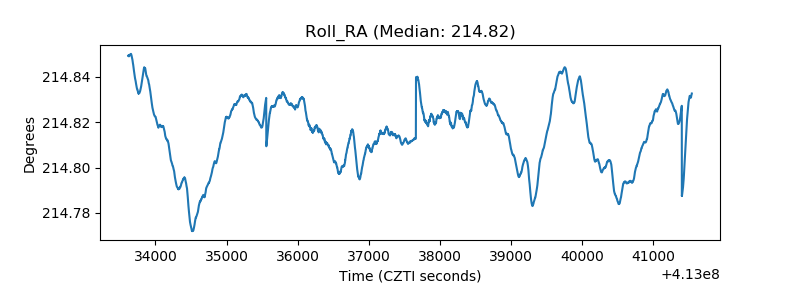 |
| Veto Counter | 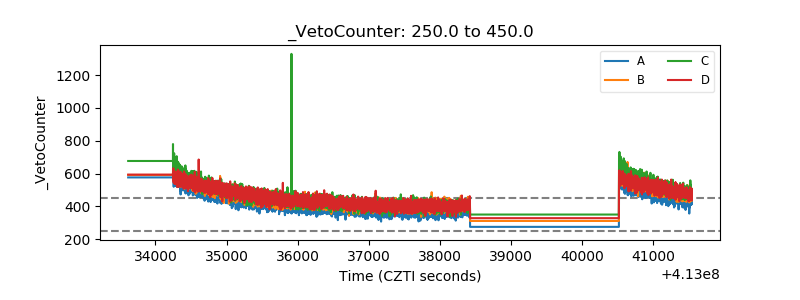 |