| Param | Original file | Final file |
|---|---|---|
| Filename | modeM0/AS1A12_022T01_9000005494_39737cztM0_level2.fits | modeM0/AS1A12_022T01_9000005494_39737cztM0_level2_quad_clean.evt |
| Size (bytes) | 348,050,880 | 96,226,560 |
| Size | 331.9 MB | 91.8 MB |
| Events in quadrant A | 3,573,329 | 650,788 |
| Events in quadrant B | 2,593,660 | 681,697 |
| Events in quadrant C | 3,502,257 | 634,987 |
| Events in quadrant D | 2,819,390 | 590,582 |
| Mode SS | |||
|---|---|---|---|
| Quadrant | BADHDUFLAG | Total packets | Discarded packets |
| A | 0 | 104 | 0 |
| B | 0 | 104 | 0 |
| C | 0 | 104 | 0 |
| D | 0 | 104 | 0 |
| Mode M0 | |||
|---|---|---|---|
| Quadrant | BADHDUFLAG | Total packets | Discarded packets |
| A | 0 | 13857 | 2 |
| B | 0 | 10777 | 1 |
| C | 0 | 13726 | 1 |
| D | 0 | 11646 | 1 |
| Mode M9 | |||
|---|---|---|---|
| Quadrant | BADHDUFLAG | Total packets | Discarded packets |
| A | 0 | 24 | 0 |
| B | 0 | 24 | 0 |
| C | 0 | 24 | 0 |
| D | 0 | 25 | 0 |
| Quadrant | Total seconds | Saturated seconds | Saturation percentage |
|---|---|---|---|
| A | 5077 | 195 | 3.840851% |
| B | 5077 | 34 | 0.669687% |
| C | 5077 | 61 | 1.201497% |
| D | 5077 | 59 | 1.162104% |
Noise dominated data is calculated using 1-second bins in cleaned event files. If a bin has >2000 counts, and if more than 50% of those come from <1% of pixels, then it is considered to be noise-dominated and hence unusable.
| Quadrant | # 1 sec bins | Bins with >0 counts | Bins with >2000 counts | High rate bins dominated by noise | Noise dominated (total time) | Noise dominated (detector-on time) | Marked lightcurve |
|---|---|---|---|---|---|---|---|
| A | 7229 | 5078 | 134 | 134 | 1.85% | 2.64% | 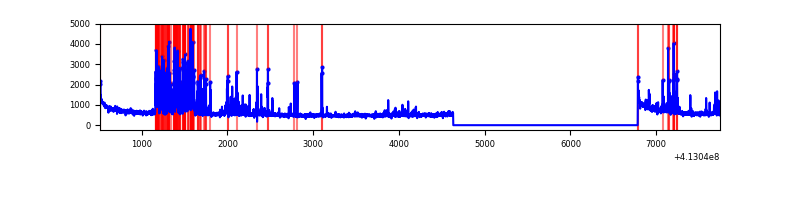 |
| B | 7229 | 5078 | 25 | 25 | 0.35% | 0.49% | 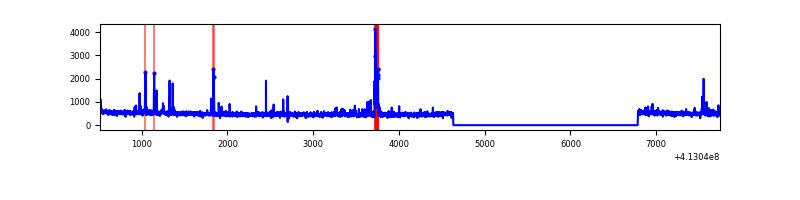 |
| C | 7229 | 5078 | 63 | 63 | 0.87% | 1.24% | 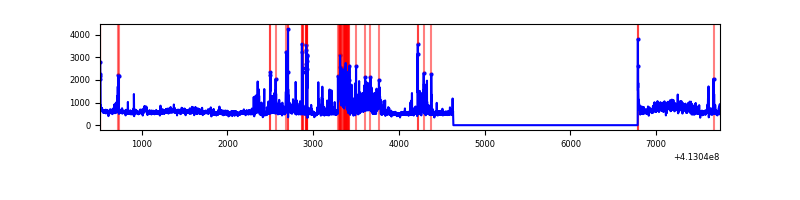 |
| D | 7229 | 5078 | 51 | 51 | 0.71% | 1.00% | 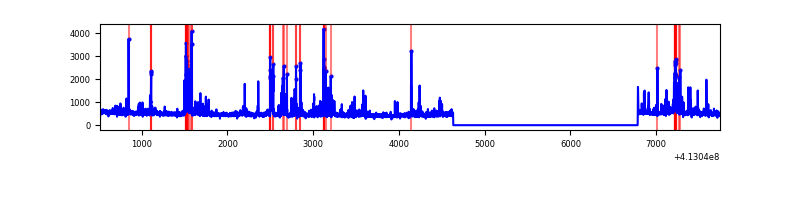 |
Top three noisy pixels from each quadrant. If the there are fewer than three noisy pixels in the level2.evt file, extra rows are filled as -1
| Pixel properties | Quadrant properties | ||||||
|---|---|---|---|---|---|---|---|
| Quadrant | DetID | PixID | Counts | Sigma | Mean | Median | Sigma |
| A | 13 | 248 | 552839 | 4481.63 | 607 | 596 | 123.2 |
| A | 10 | 83 | 459445 | 3723.71 | 607 | 596 | 123.2 |
| A | 15 | 174 | 89628 | 722.52 | 607 | 596 | 123.2 |
| B | 5 | 255 | 91952 | 801.63 | 609 | 596 | 114.0 |
| B | 15 | 85 | 37970 | 327.95 | 609 | 596 | 114.0 |
| B | 5 | 172 | 27637 | 237.28 | 609 | 596 | 114.0 |
| C | 9 | 187 | 636569 | 4635.13 | 597 | 601 | 137.2 |
| C | 15 | 208 | 243118 | 1767.54 | 597 | 601 | 137.2 |
| C | 15 | 214 | 224874 | 1634.57 | 597 | 601 | 137.2 |
| D | 12 | 233 | 166236 | 1128.51 | 600 | 584 | 146.8 |
| D | 2 | 250 | 122693 | 831.87 | 600 | 584 | 146.8 |
| D | 12 | 218 | 75867 | 512.87 | 600 | 584 | 146.8 |
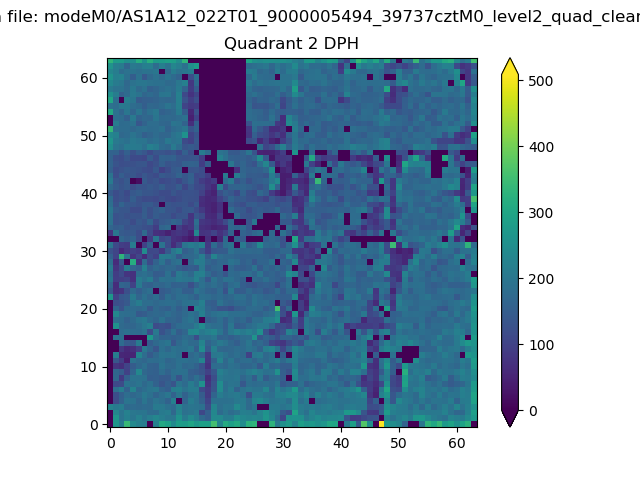
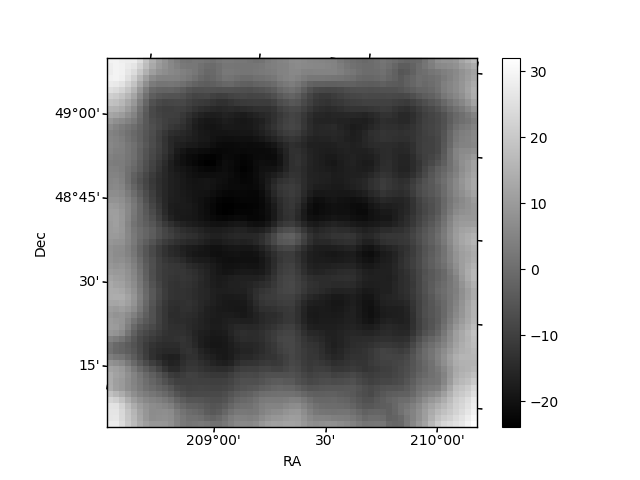
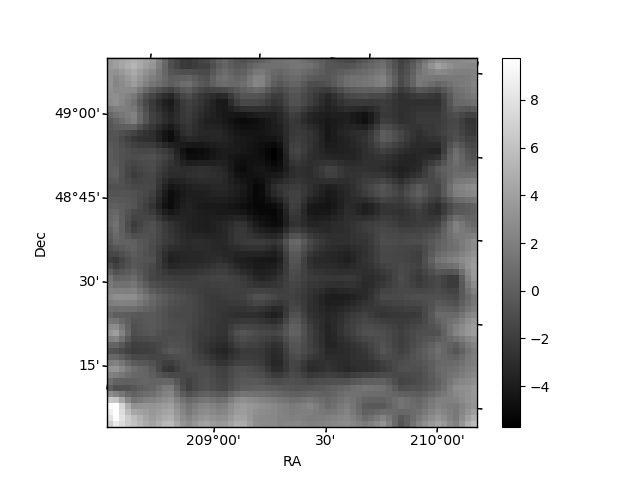
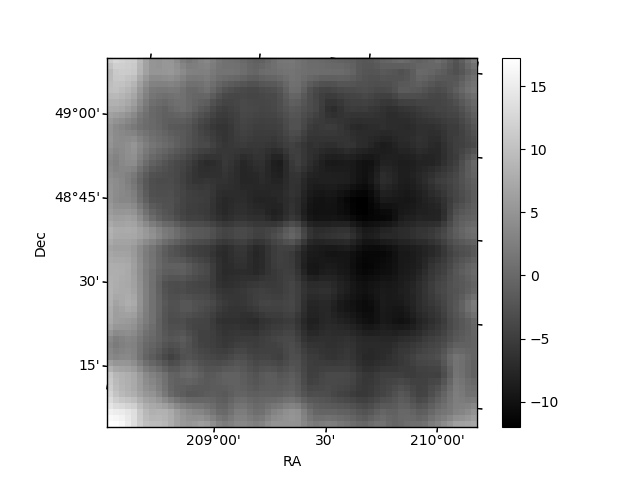
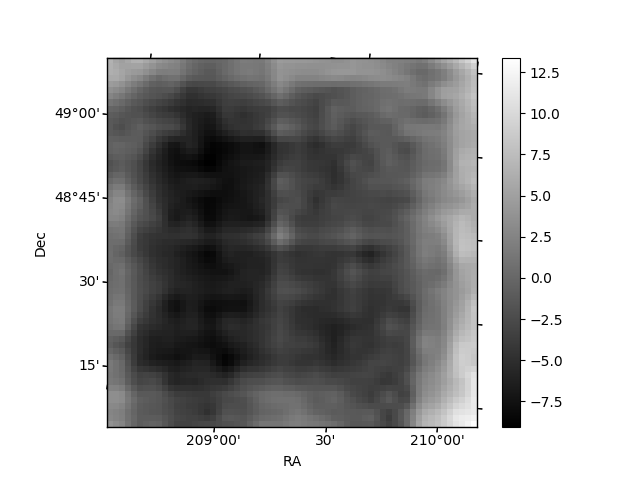
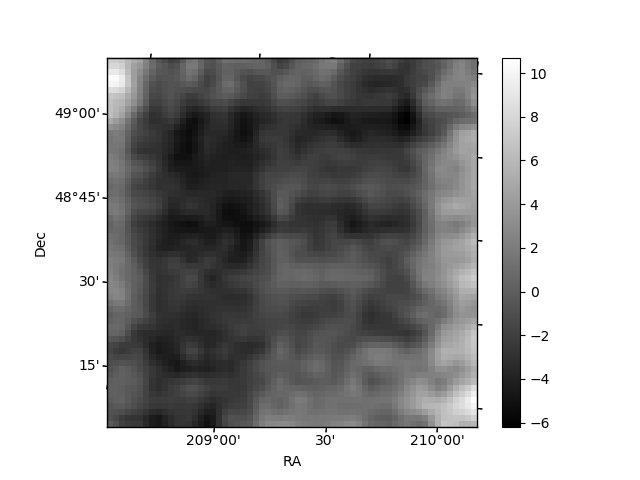
Histogram calculated using DETX and DETY for each event in the final _common_clean file
| Quadrant A | 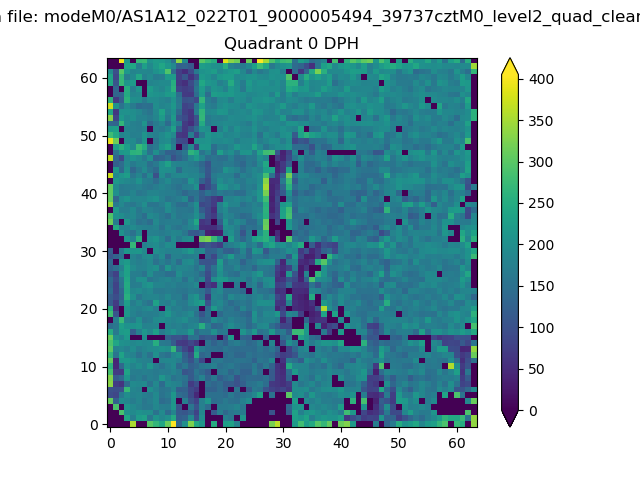 |
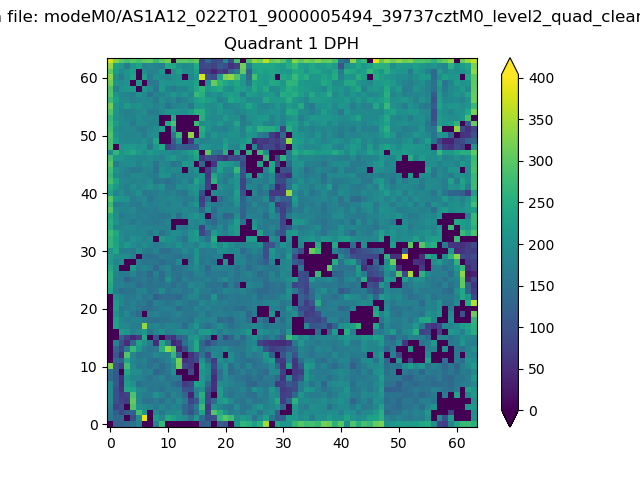 |
Quadrant B |
|---|---|---|---|
| Quadrant D | 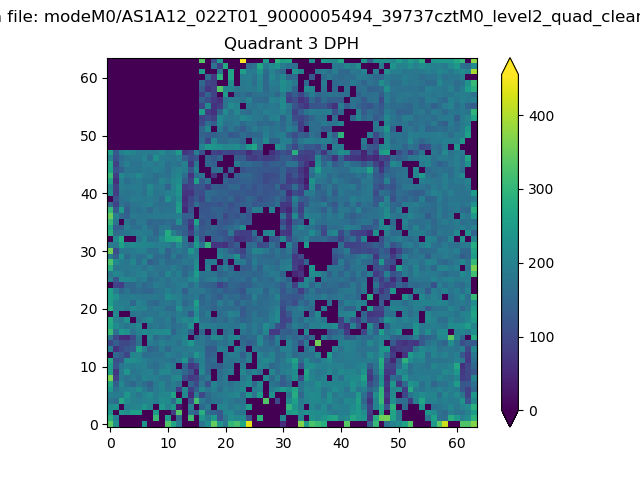 |
 |
Quadrant C |
| Plot type | Count rate plots | Images |
|---|---|---|
| Comparison with Poisson distribution Blue bars denote a histogram of data divided into 1 sec bins. Red curve is a Poisson curve with rate = median count rate of data. |
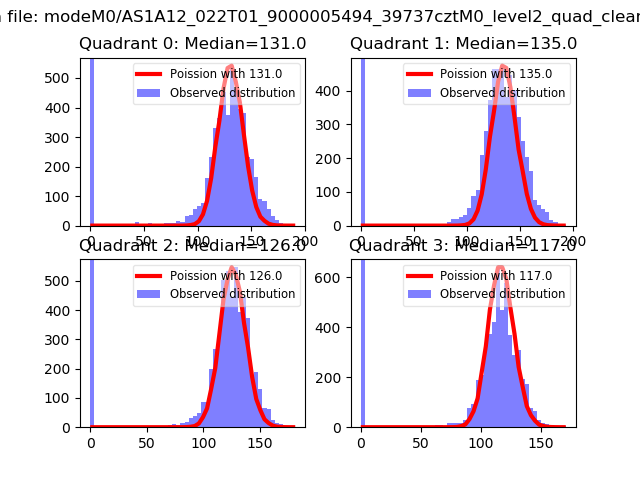 |
 |
| Quadrant-wise count rates Data is divided into 100 sec bins |
 |
|
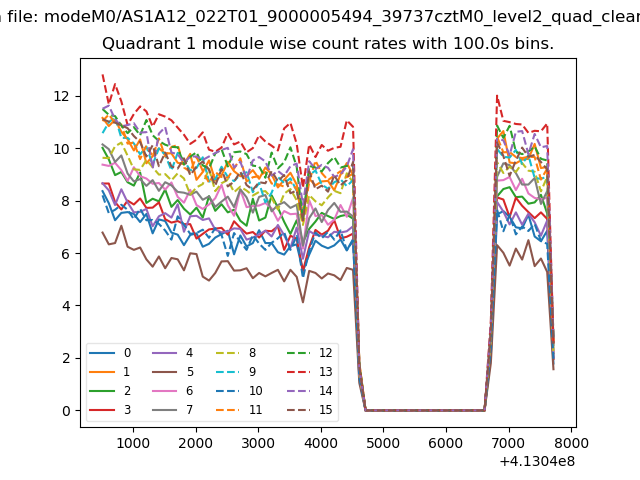
| Module-wise count rates for Quadrant A Data is divided into 100 sec bins |
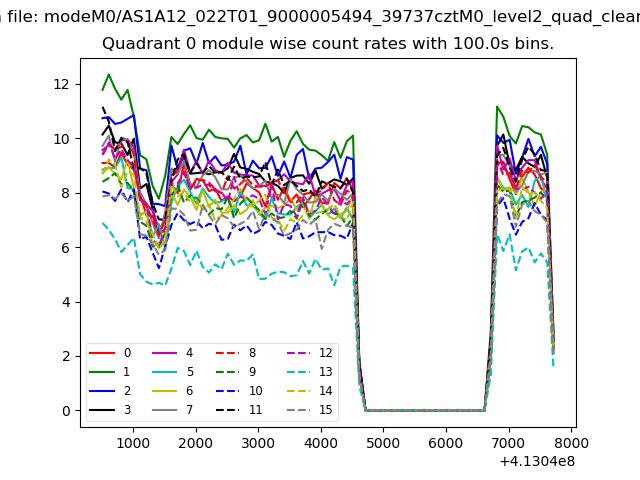 |
 |
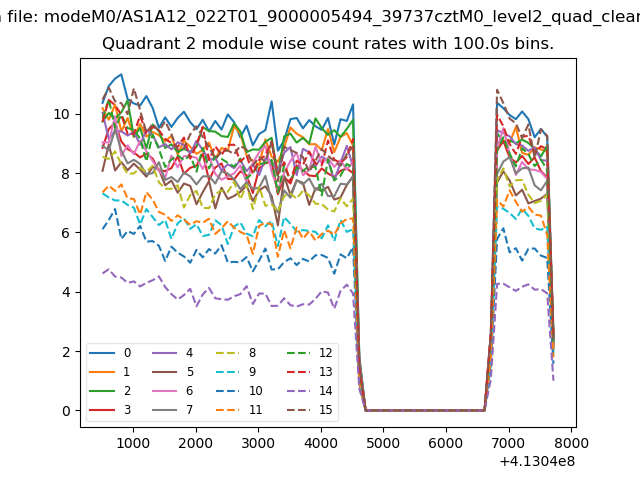
| Module-wise count rates for Quadrant B Data is divided into 100 sec bins |
 |
 |
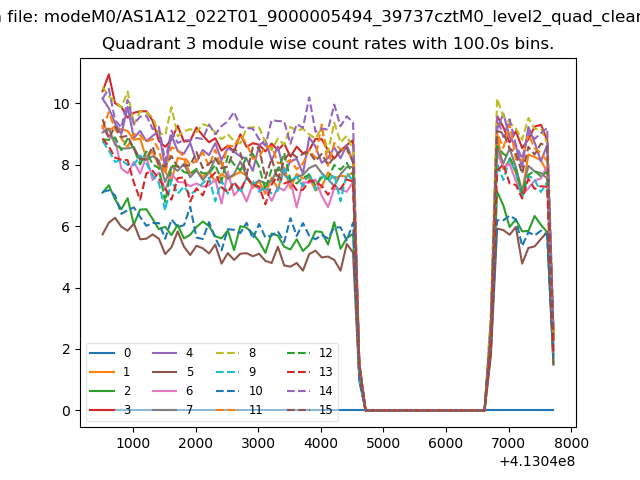
| Module-wise count rates for Quadrant C Data is divided into 100 sec bins |
 |
 |
| Module-wise count rates for Quadrant D Data is divided into 100 sec bins |
 |
 |
| Parameter | Plot |
|---|---|
| CZT HV Monitor | 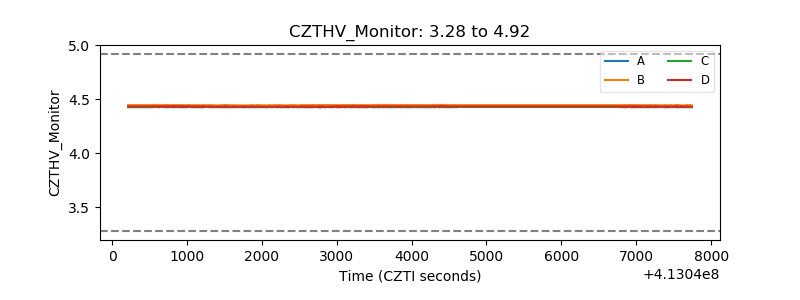 |
| D_VDD | 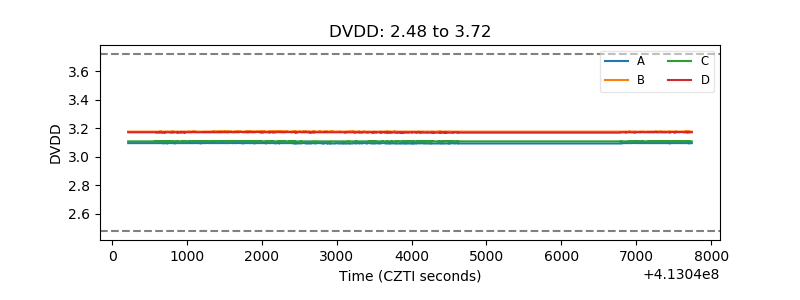 |
| Temperature 1 | 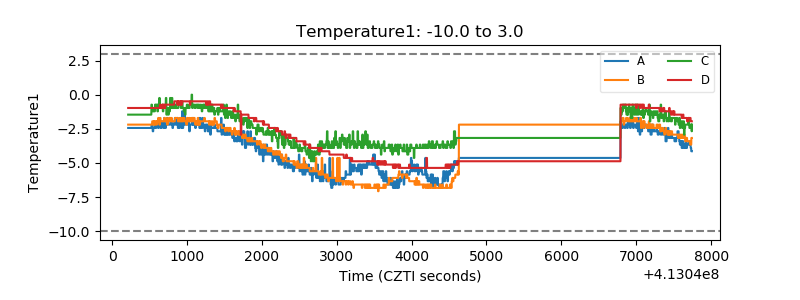 |
| Veto HV Monitor | 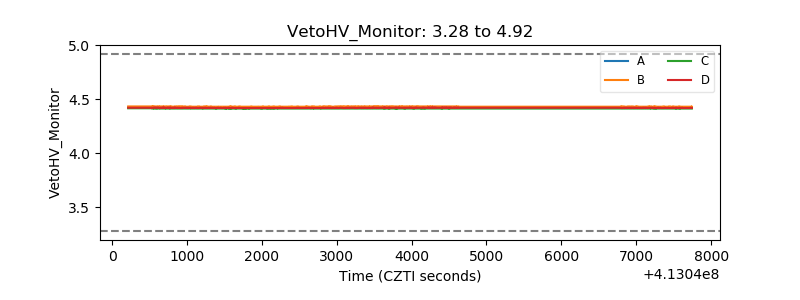 |
| Veto LLD | 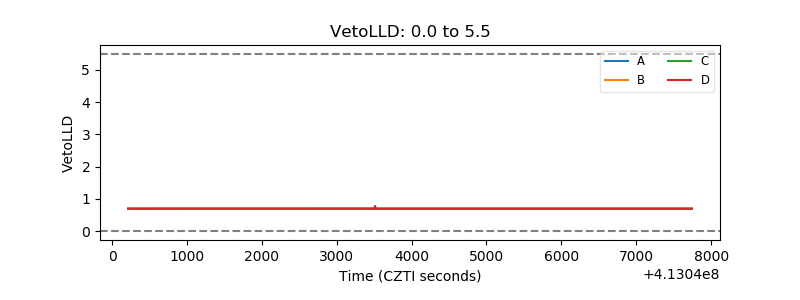 |
| Alpha Counter | 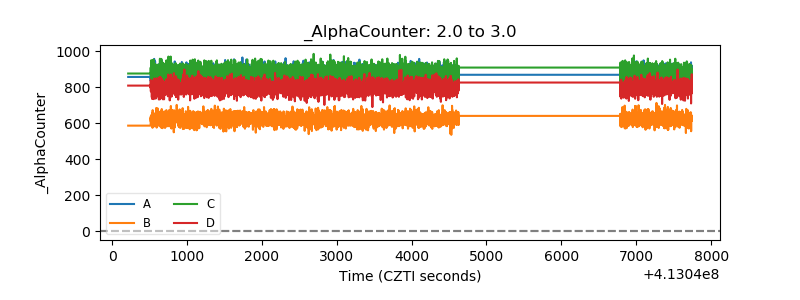 |
| _CPM_Rate | 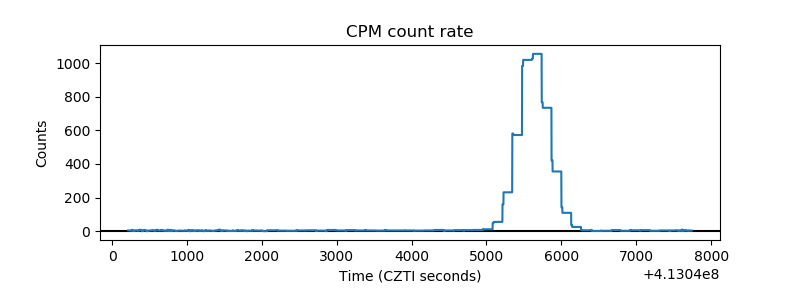 |
| CZT Counter | 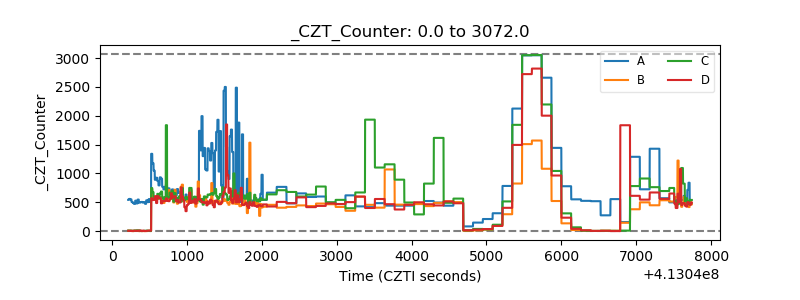 |
| +2.5 Volts monitor | 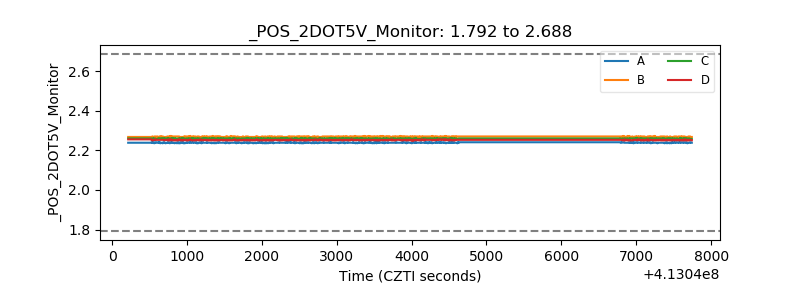 |
| +5 Volts monitor | 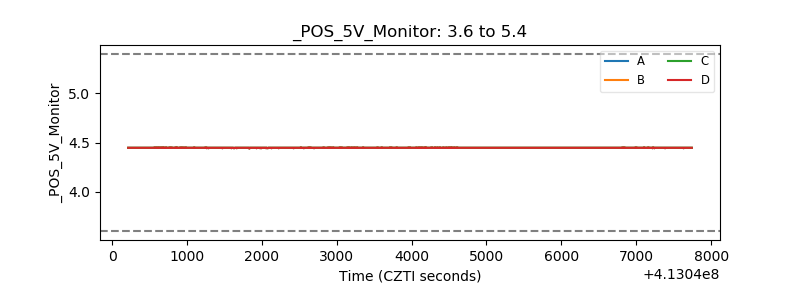 |
| _ROLL_ROT | 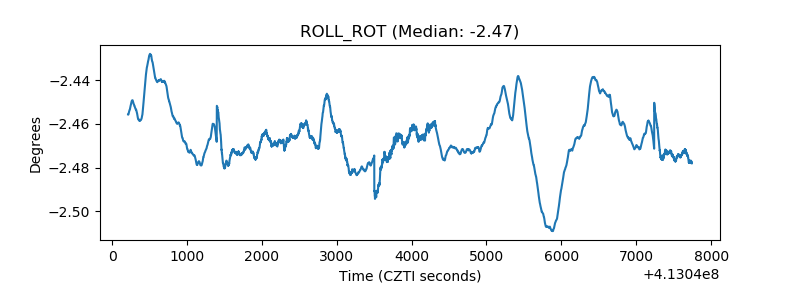 |
| _Roll_DEC | 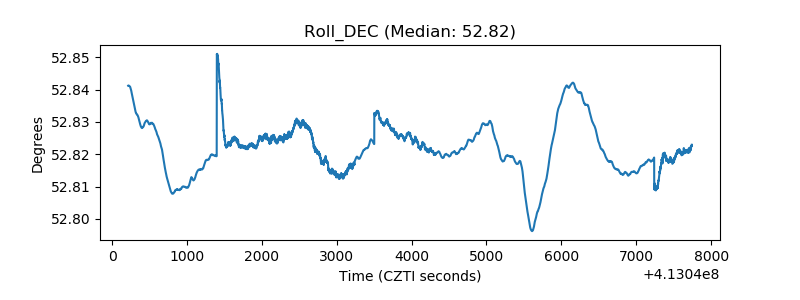 |
| _Roll_RA | 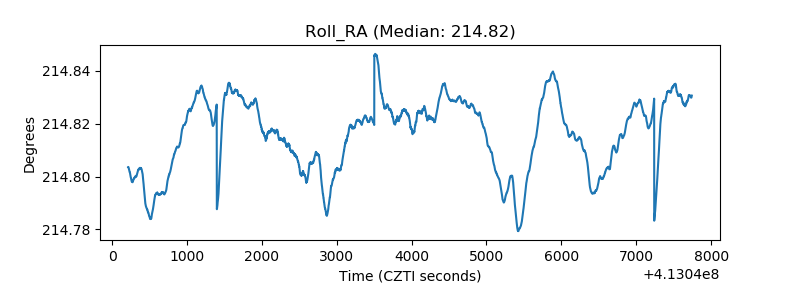 |
| Veto Counter | 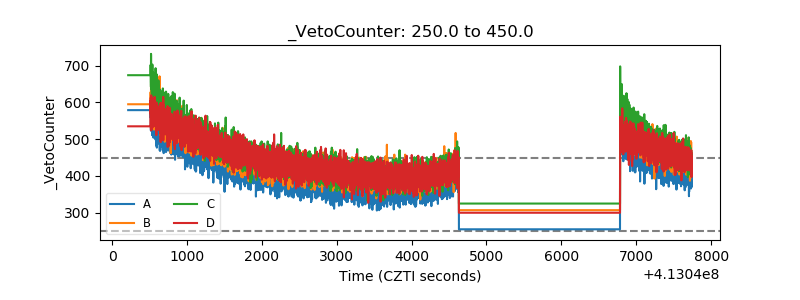 |