| Param | Original file | Final file |
|---|---|---|
| Filename | modeM0/AS1A12_022T01_9000005494_39738cztM0_level2.fits | modeM0/AS1A12_022T01_9000005494_39738cztM0_level2_quad_clean.evt |
| Size (bytes) | 328,121,280 | 91,203,840 |
| Size | 312.9 MB | 87.0 MB |
| Events in quadrant A | 2,962,267 | 623,242 |
| Events in quadrant B | 2,465,895 | 637,021 |
| Events in quadrant C | 3,495,555 | 594,652 |
| Events in quadrant D | 2,831,513 | 554,669 |
| Mode SS | |||
|---|---|---|---|
| Quadrant | BADHDUFLAG | Total packets | Discarded packets |
| A | 0 | 104 | 0 |
| B | 0 | 104 | 0 |
| C | 0 | 104 | 0 |
| D | 0 | 104 | 0 |
| Mode M0 | |||
|---|---|---|---|
| Quadrant | BADHDUFLAG | Total packets | Discarded packets |
| A | 0 | 11974 | 3 |
| B | 0 | 10583 | 2 |
| C | 0 | 13699 | 2 |
| D | 0 | 11844 | 2 |
| Mode M9 | |||
|---|---|---|---|
| Quadrant | BADHDUFLAG | Total packets | Discarded packets |
| A | 0 | 29 | 0 |
| B | 0 | 29 | 0 |
| C | 0 | 29 | 0 |
| D | 0 | 30 | 0 |
| Quadrant | Total seconds | Saturated seconds | Saturation percentage |
|---|---|---|---|
| A | 5019 | 59 | 1.175533% |
| B | 5019 | 26 | 0.518031% |
| C | 5019 | 78 | 1.554094% |
| D | 5019 | 83 | 1.653716% |
Noise dominated data is calculated using 1-second bins in cleaned event files. If a bin has >2000 counts, and if more than 50% of those come from <1% of pixels, then it is considered to be noise-dominated and hence unusable.
| Quadrant | # 1 sec bins | Bins with >0 counts | Bins with >2000 counts | High rate bins dominated by noise | Noise dominated (total time) | Noise dominated (detector-on time) | Marked lightcurve |
|---|---|---|---|---|---|---|---|
| A | 7140 | 5020 | 34 | 34 | 0.48% | 0.68% | 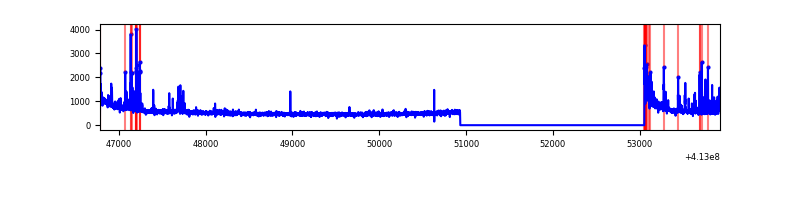 |
| B | 7140 | 5020 | 12 | 12 | 0.17% | 0.24% | 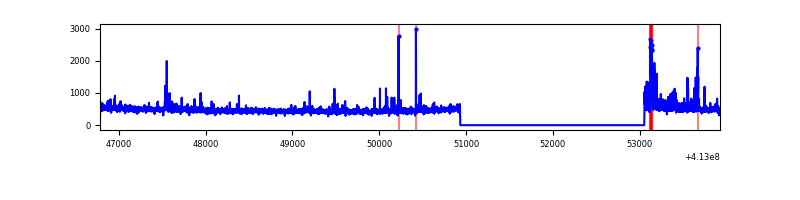 |
| C | 7140 | 5020 | 79 | 79 | 1.11% | 1.57% | 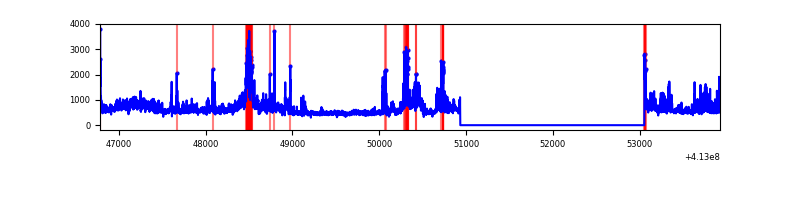 |
| D | 7140 | 5020 | 60 | 60 | 0.84% | 1.20% | 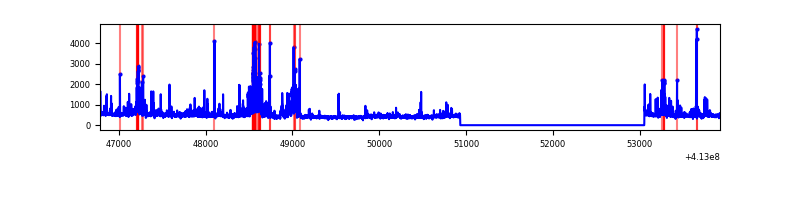 |
Top three noisy pixels from each quadrant. If the there are fewer than three noisy pixels in the level2.evt file, extra rows are filled as -1
| Pixel properties | Quadrant properties | ||||||
|---|---|---|---|---|---|---|---|
| Quadrant | DetID | PixID | Counts | Sigma | Mean | Median | Sigma |
| A | 10 | 83 | 449558 | 3798.87 | 579 | 569 | 118.2 |
| A | 13 | 248 | 178593 | 1506.25 | 579 | 569 | 118.2 |
| A | 9 | 143 | 48327 | 404.08 | 579 | 569 | 118.2 |
| B | 5 | 255 | 67295 | 607.46 | 579 | 565 | 109.9 |
| B | 0 | 190 | 31125 | 278.19 | 579 | 565 | 109.9 |
| B | 10 | 246 | 24448 | 217.41 | 579 | 565 | 109.9 |
| C | 9 | 187 | 540370 | 4116.62 | 567 | 572 | 131.1 |
| C | 15 | 208 | 465570 | 3546.18 | 567 | 572 | 131.1 |
| C | 15 | 214 | 220285 | 1675.58 | 567 | 572 | 131.1 |
| D | 2 | 250 | 277185 | 2005.4 | 568 | 552 | 137.9 |
| D | 12 | 227 | 126856 | 915.62 | 568 | 552 | 137.9 |
| D | 13 | 249 | 86874 | 625.78 | 568 | 552 | 137.9 |
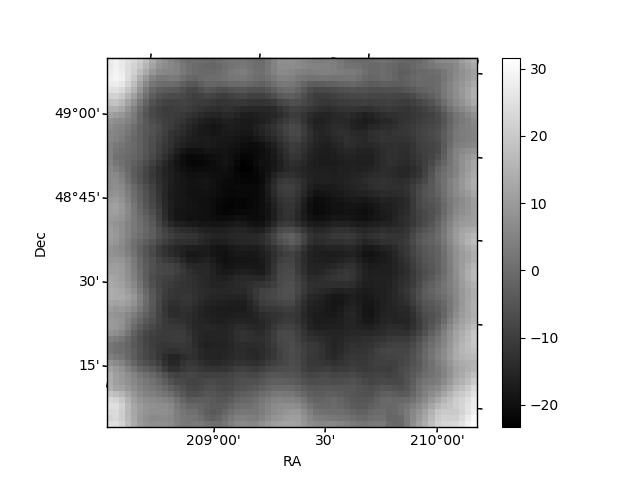
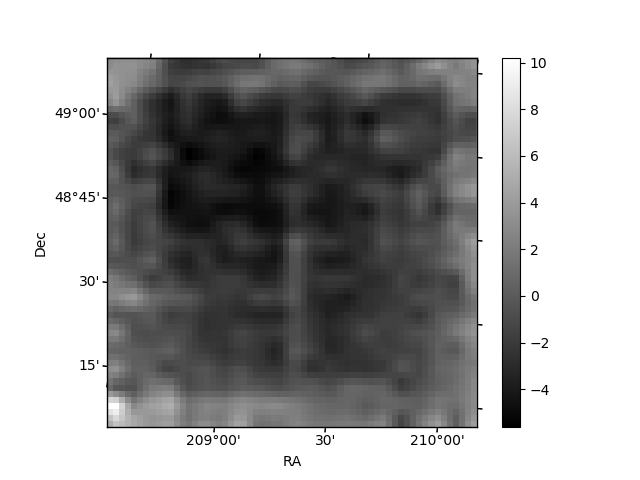
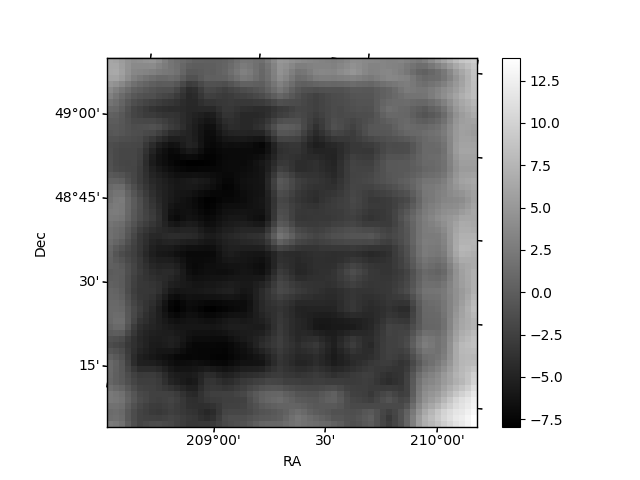
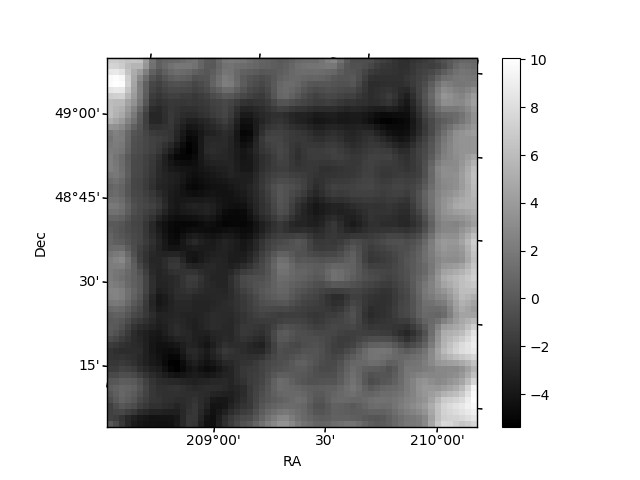
Histogram calculated using DETX and DETY for each event in the final _common_clean file
| Quadrant A | 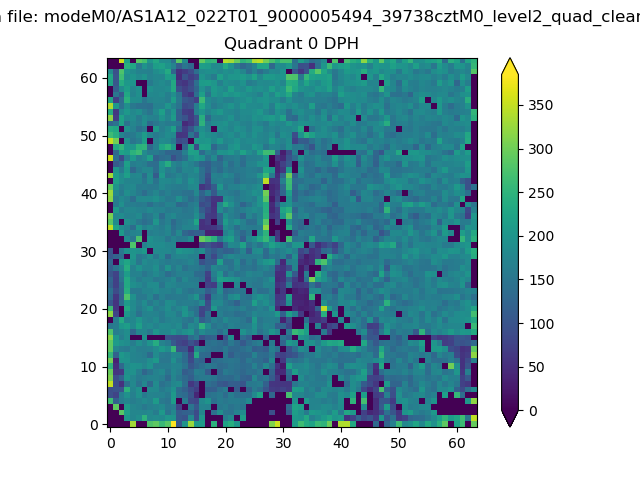 |
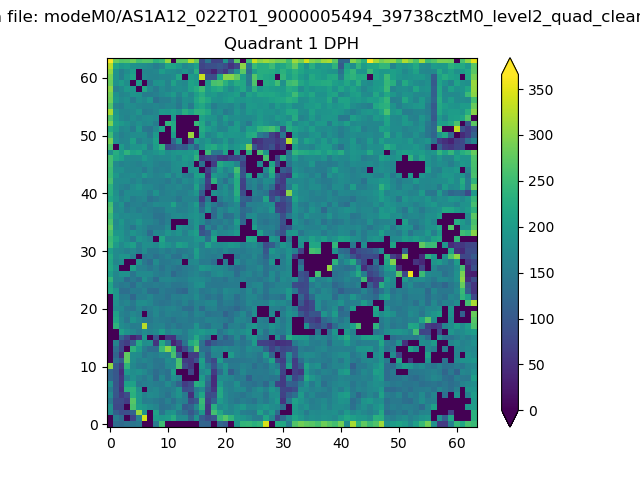 |
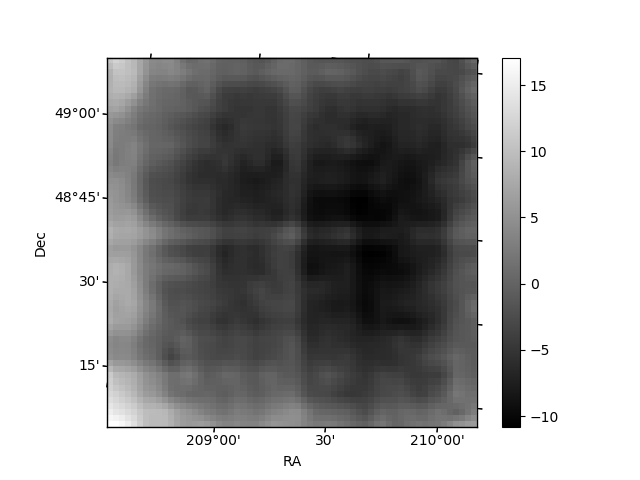
Quadrant B |
|---|---|---|---|
| Quadrant D | 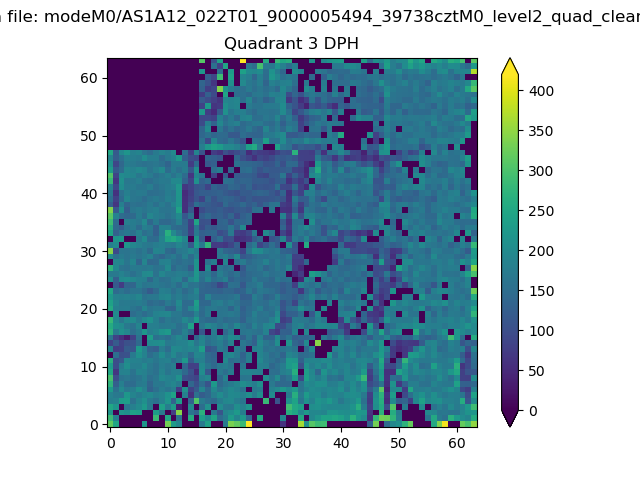 |
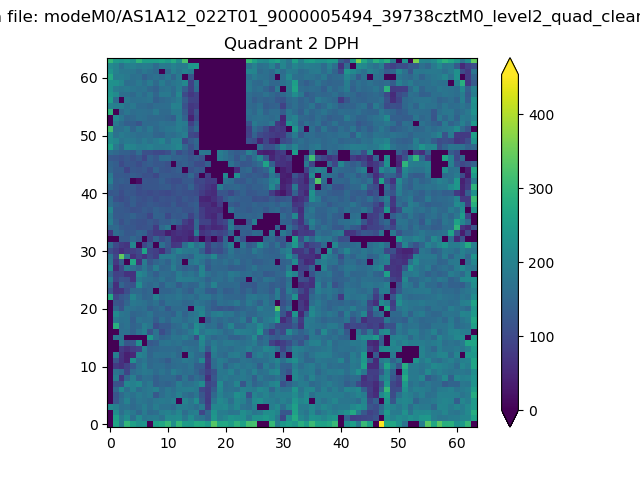 |
Quadrant C |
| Plot type | Count rate plots | Images |
|---|---|---|
| Comparison with Poisson distribution Blue bars denote a histogram of data divided into 1 sec bins. Red curve is a Poisson curve with rate = median count rate of data. |
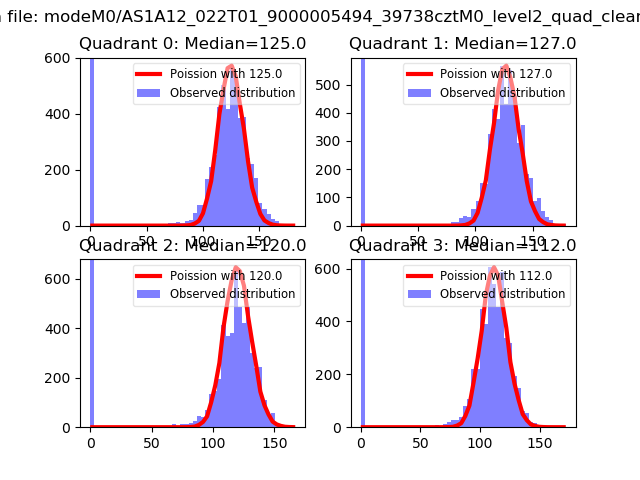 |
 |
| Quadrant-wise count rates Data is divided into 100 sec bins |
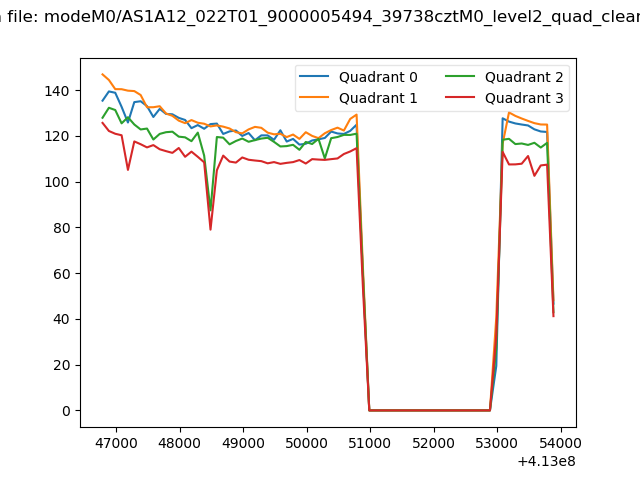 |
|
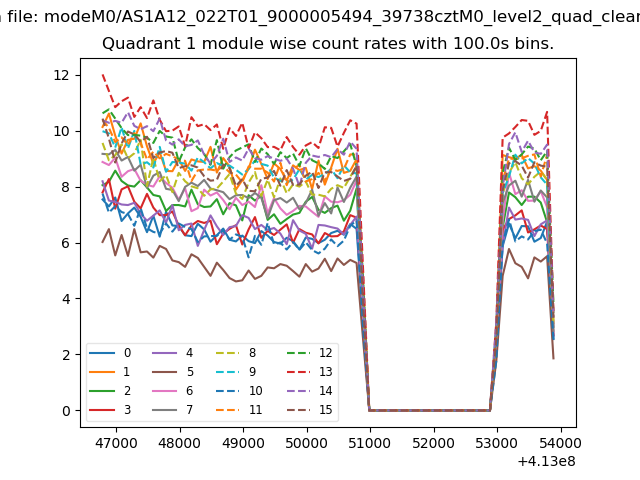
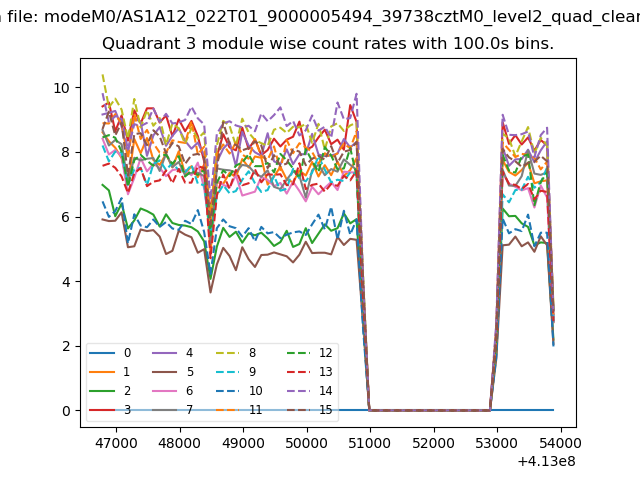
| Module-wise count rates for Quadrant A Data is divided into 100 sec bins |
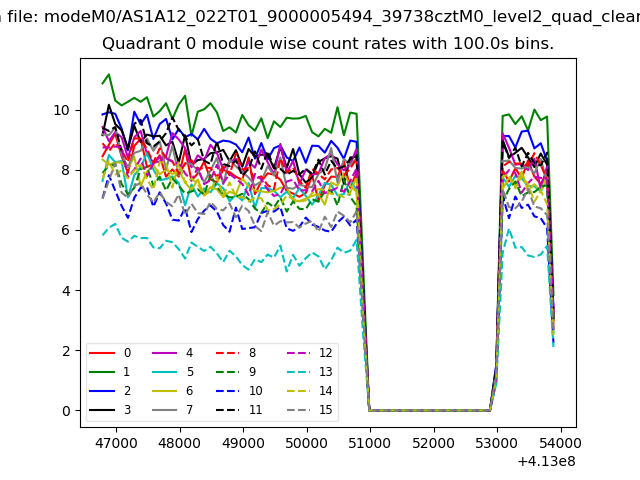 |
 |
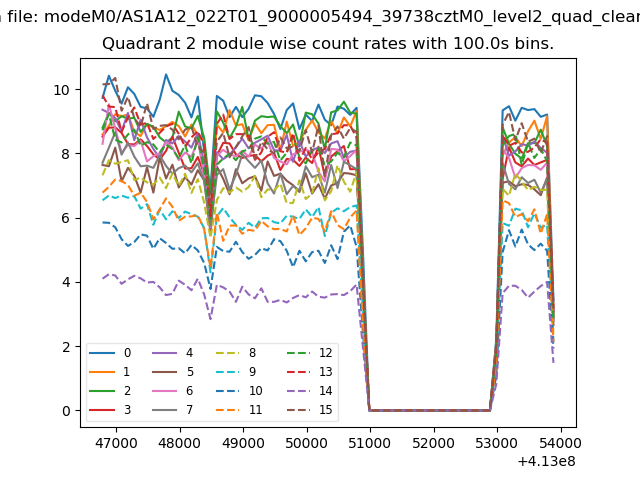
| Module-wise count rates for Quadrant B Data is divided into 100 sec bins |
 |
 |
| Module-wise count rates for Quadrant C Data is divided into 100 sec bins |
 |
 |
| Module-wise count rates for Quadrant D Data is divided into 100 sec bins |
 |
 |
| Parameter | Plot |
|---|---|
| CZT HV Monitor | 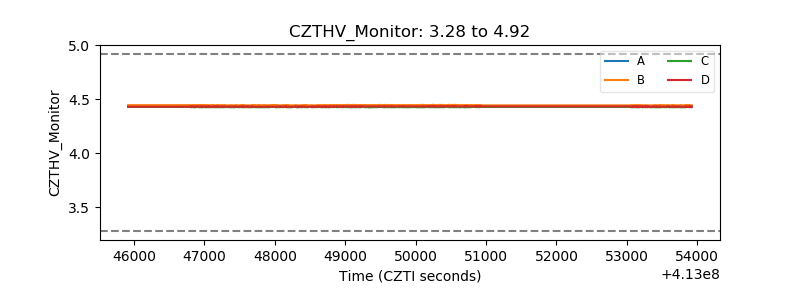 |
| D_VDD | 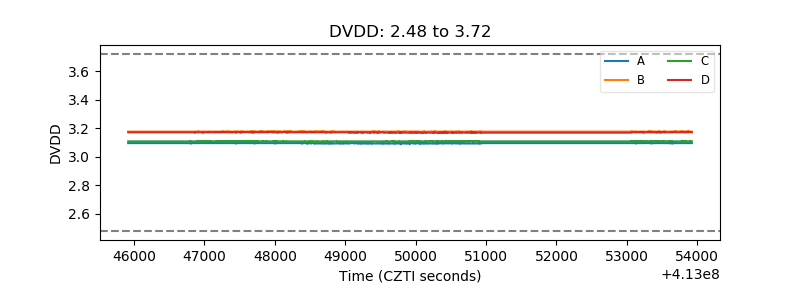 |
| Temperature 1 | 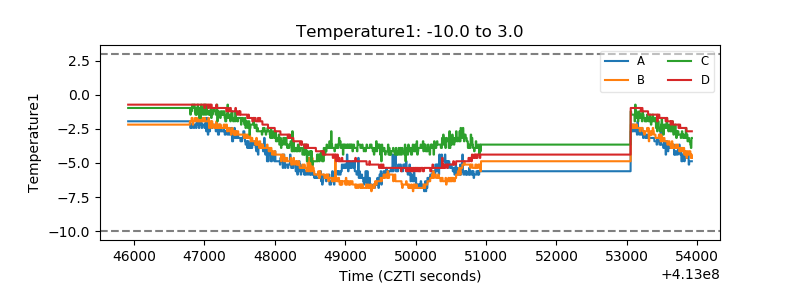 |
| Veto HV Monitor | 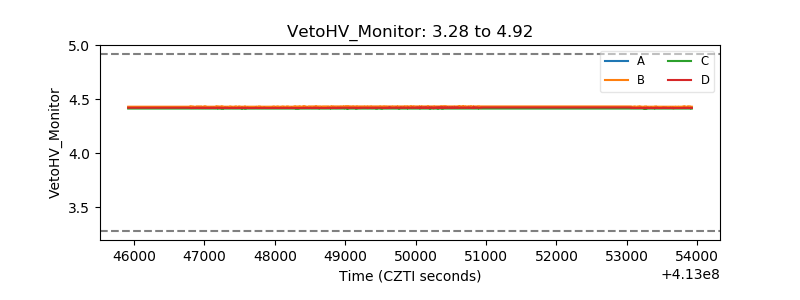 |
| Veto LLD | 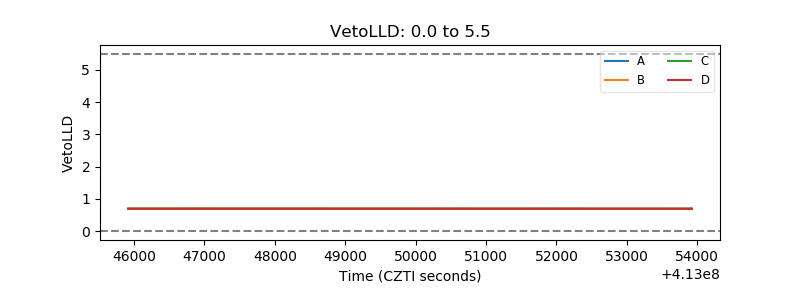 |
| Alpha Counter | 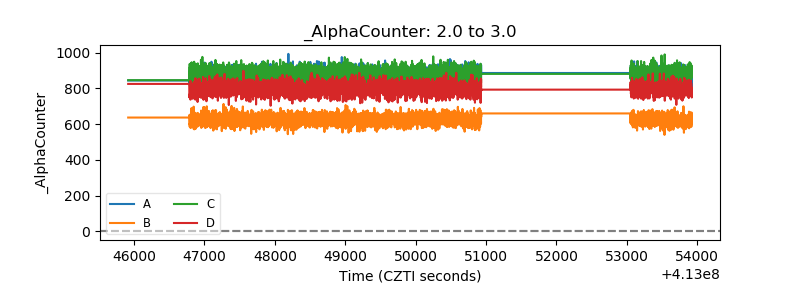 |
| _CPM_Rate | 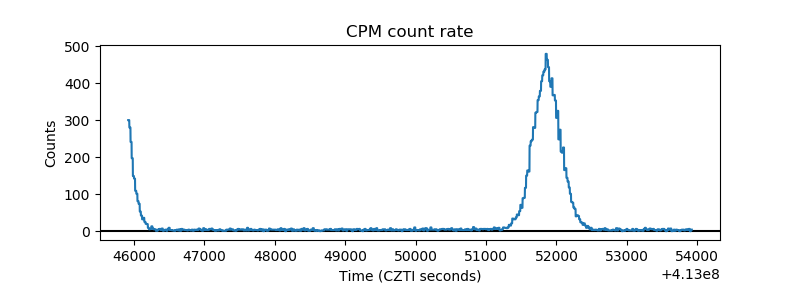 |
| CZT Counter | 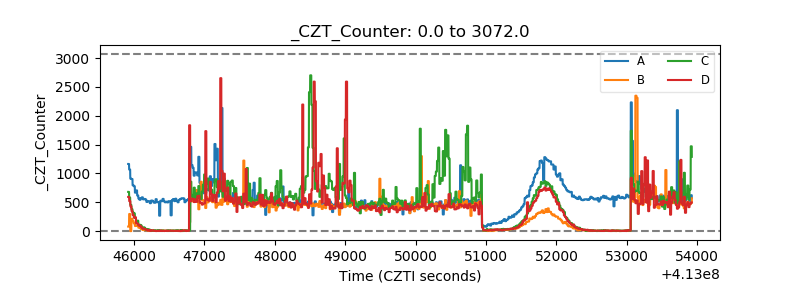 |
| +2.5 Volts monitor | 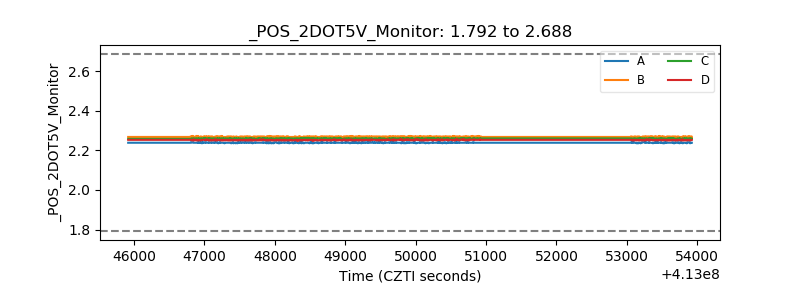 |
| +5 Volts monitor | 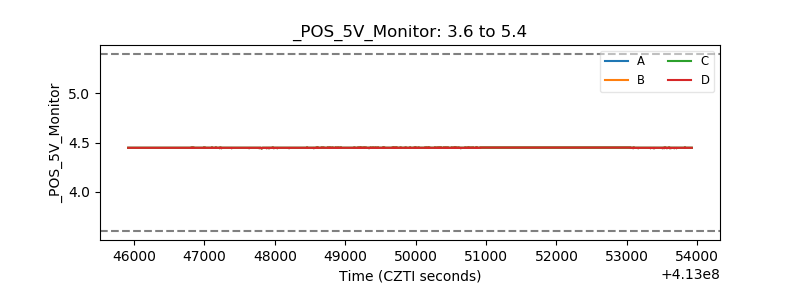 |
| _ROLL_ROT | 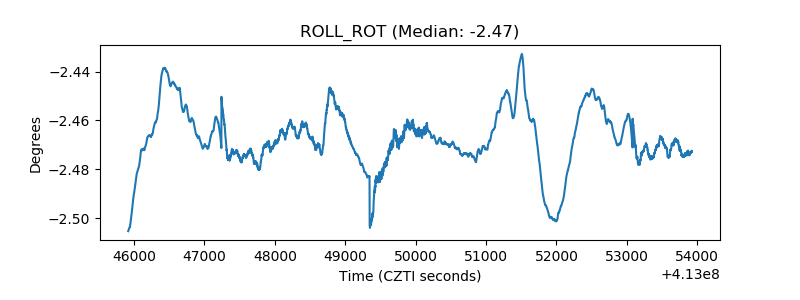 |
| _Roll_DEC | 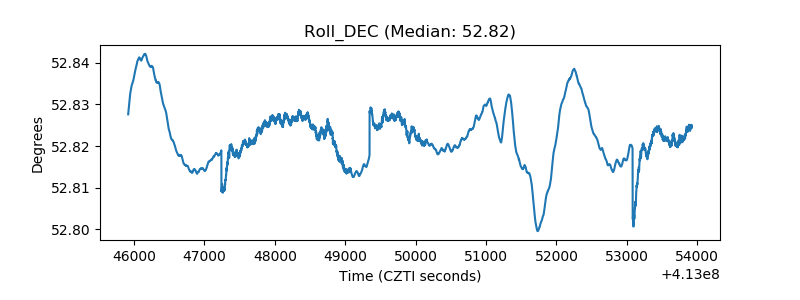 |
| _Roll_RA | 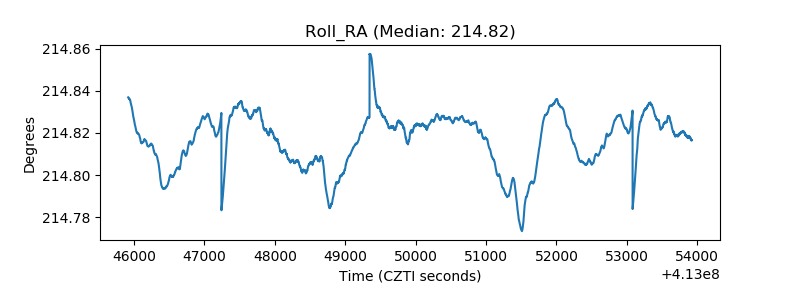 |
| Veto Counter | 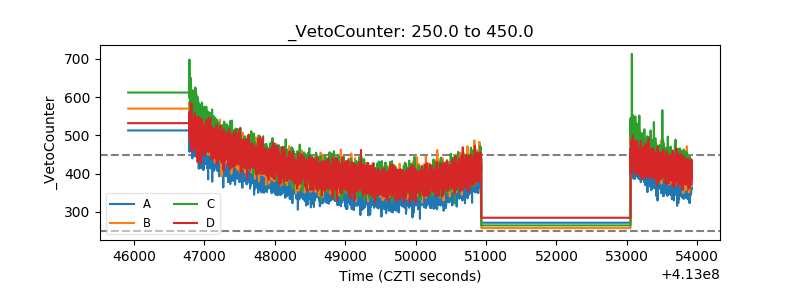 |