| Param | Original file | Final file |
|---|---|---|
| Filename | modeM0/AS1A12_022T01_9000005494_39739cztM0_level2.fits | modeM0/AS1A12_022T01_9000005494_39739cztM0_level2_quad_clean.evt |
| Size (bytes) | 353,424,960 | 87,036,480 |
| Size | 337.1 MB | 83.0 MB |
| Events in quadrant A | 3,046,461 | 592,782 |
| Events in quadrant B | 2,549,172 | 606,492 |
| Events in quadrant C | 3,833,513 | 555,178 |
| Events in quadrant D | 3,256,123 | 523,443 |
| Mode SS | |||
|---|---|---|---|
| Quadrant | BADHDUFLAG | Total packets | Discarded packets |
| A | 0 | 104 | 0 |
| B | 0 | 104 | 0 |
| C | 0 | 104 | 0 |
| D | 0 | 104 | 0 |
| Mode M0 | |||
|---|---|---|---|
| Quadrant | BADHDUFLAG | Total packets | Discarded packets |
| A | 0 | 12355 | 3 |
| B | 0 | 11056 | 2 |
| C | 0 | 14792 | 2 |
| D | 0 | 13299 | 2 |
| Mode M9 | |||
|---|---|---|---|
| Quadrant | BADHDUFLAG | Total packets | Discarded packets |
| A | 0 | 33 | 0 |
| B | 0 | 33 | 0 |
| C | 0 | 33 | 0 |
| D | 0 | 34 | 0 |
| Quadrant | Total seconds | Saturated seconds | Saturation percentage |
|---|---|---|---|
| A | 5103 | 102 | 1.998824% |
| B | 5103 | 41 | 0.803449% |
| C | 5103 | 260 | 5.095042% |
| D | 5103 | 226 | 4.428767% |
Noise dominated data is calculated using 1-second bins in cleaned event files. If a bin has >2000 counts, and if more than 50% of those come from <1% of pixels, then it is considered to be noise-dominated and hence unusable.
| Quadrant | # 1 sec bins | Bins with >0 counts | Bins with >2000 counts | High rate bins dominated by noise | Noise dominated (total time) | Noise dominated (detector-on time) | Marked lightcurve |
|---|---|---|---|---|---|---|---|
| A | 7017 | 5104 | 73 | 73 | 1.04% | 1.43% | 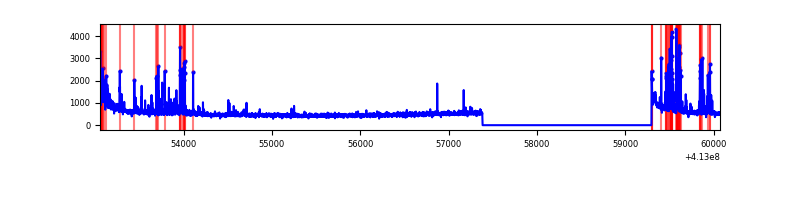 |
| B | 7017 | 5104 | 25 | 25 | 0.36% | 0.49% | 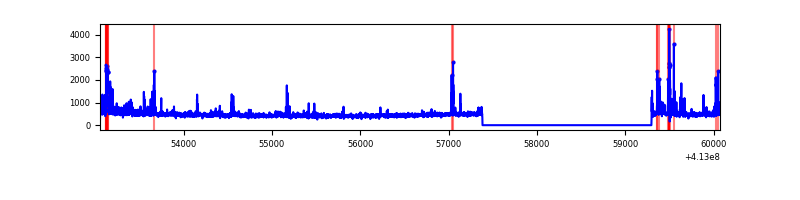 |
| C | 7017 | 5104 | 212 | 212 | 3.02% | 4.15% | 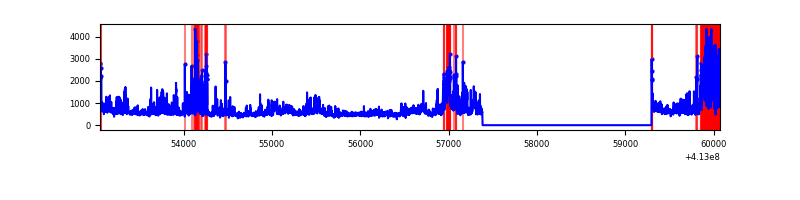 |
| D | 7017 | 5103 | 192 | 192 | 2.74% | 3.76% | 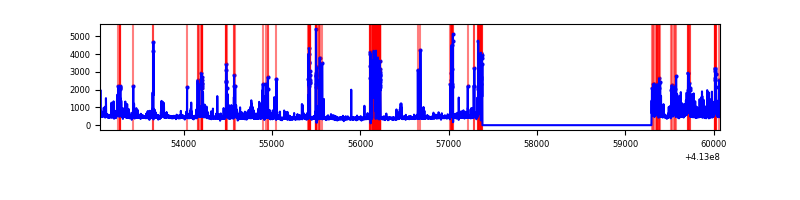 |
Top three noisy pixels from each quadrant. If the there are fewer than three noisy pixels in the level2.evt file, extra rows are filled as -1
| Pixel properties | Quadrant properties | ||||||
|---|---|---|---|---|---|---|---|
| Quadrant | DetID | PixID | Counts | Sigma | Mean | Median | Sigma |
| A | 10 | 83 | 449622 | 3870.82 | 564 | 552 | 116.0 |
| A | 13 | 248 | 265696 | 2285.44 | 564 | 552 | 116.0 |
| A | 9 | 143 | 104366 | 894.84 | 564 | 552 | 116.0 |
| B | 5 | 255 | 96079 | 874.33 | 564 | 549 | 109.3 |
| B | 5 | 172 | 94904 | 863.58 | 564 | 549 | 109.3 |
| B | 10 | 246 | 55357 | 501.63 | 564 | 549 | 109.3 |
| C | 9 | 187 | 1121546 | 8811.58 | 545 | 549 | 127.2 |
| C | 15 | 208 | 308365 | 2419.58 | 545 | 549 | 127.2 |
| C | 15 | 214 | 222077 | 1741.32 | 545 | 549 | 127.2 |
| D | 12 | 227 | 607531 | 4577.51 | 545 | 531 | 132.6 |
| D | 13 | 171 | 156980 | 1179.81 | 545 | 531 | 132.6 |
| D | 2 | 250 | 122205 | 917.57 | 545 | 531 | 132.6 |
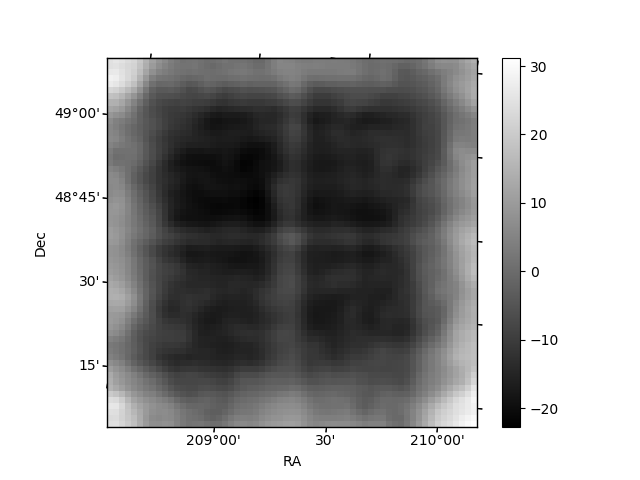
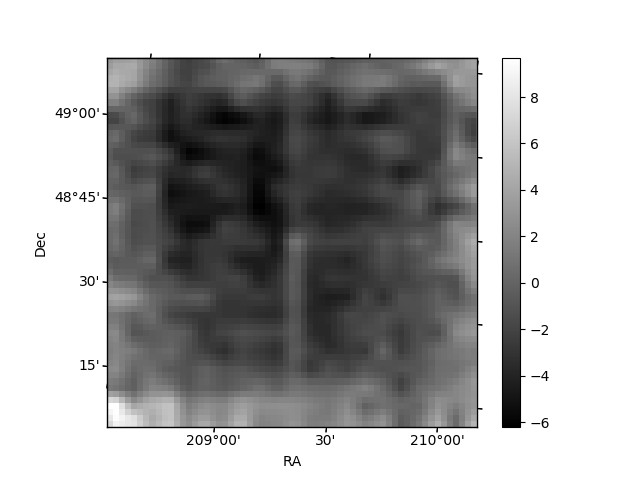
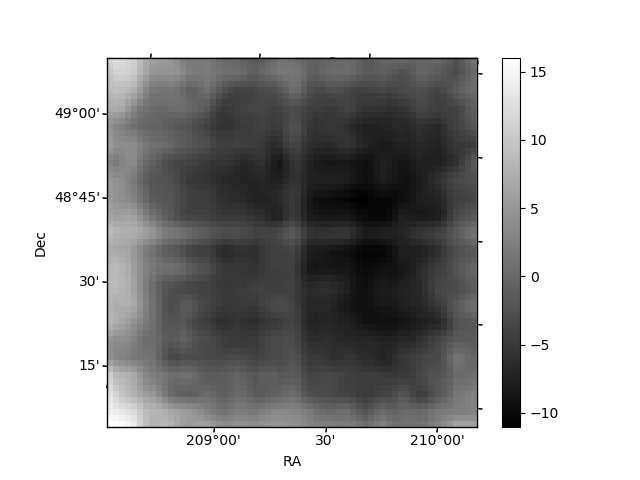
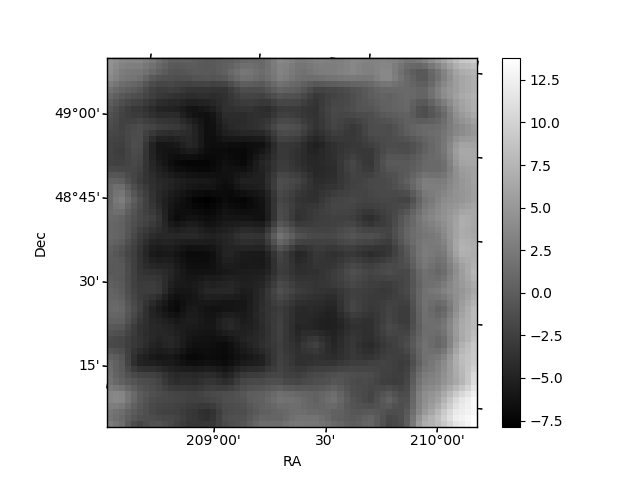
Histogram calculated using DETX and DETY for each event in the final _common_clean file
| Quadrant A | 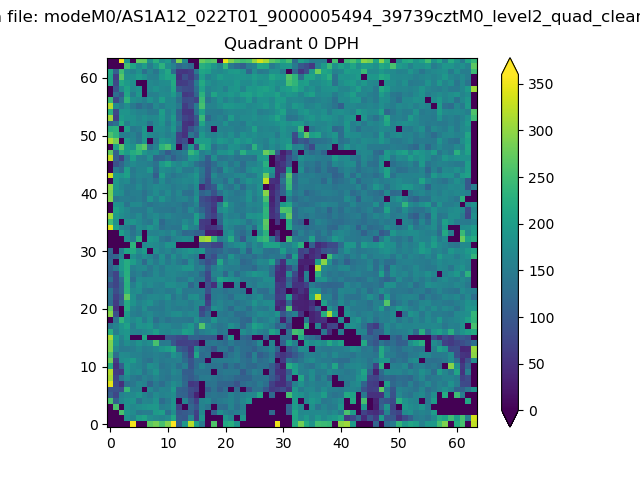 |
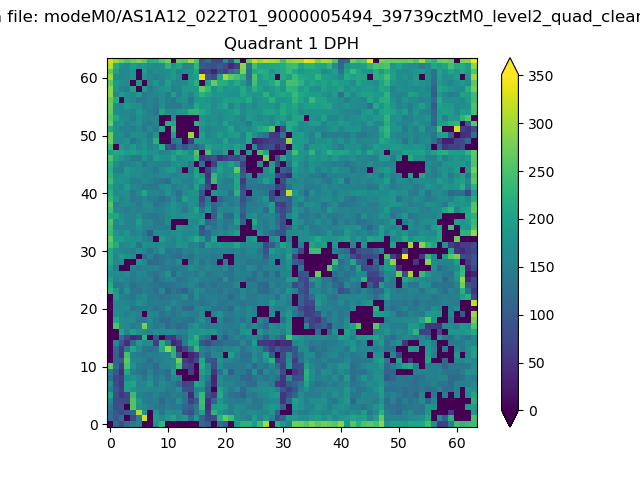 |
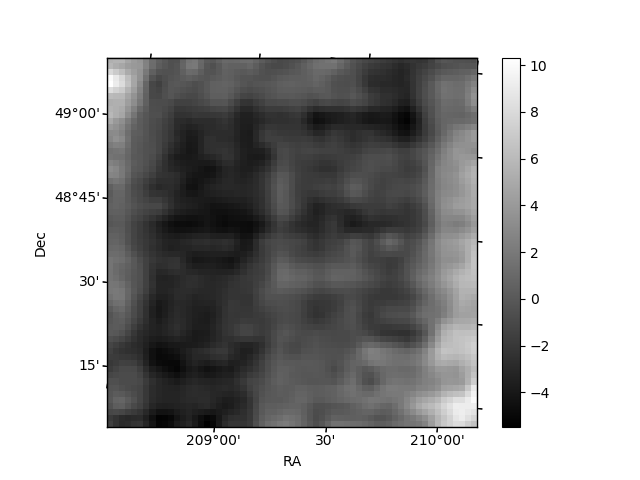
Quadrant B |
|---|---|---|---|
| Quadrant D | 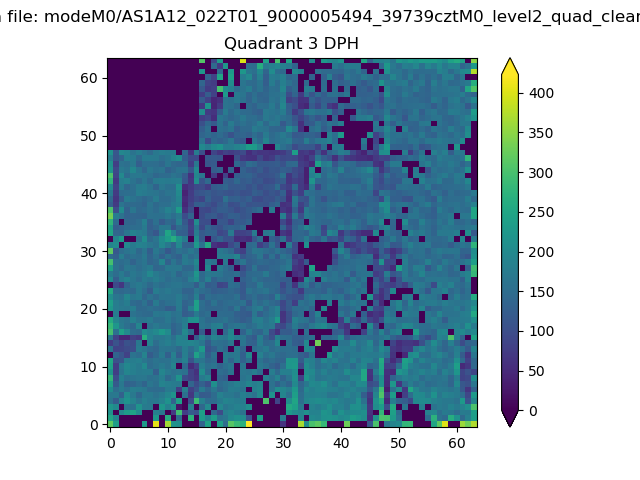 |
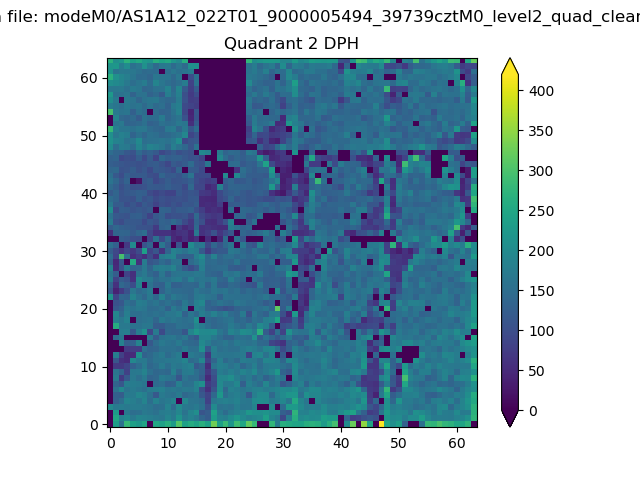 |
Quadrant C |
| Plot type | Count rate plots | Images |
|---|---|---|
| Comparison with Poisson distribution Blue bars denote a histogram of data divided into 1 sec bins. Red curve is a Poisson curve with rate = median count rate of data. |
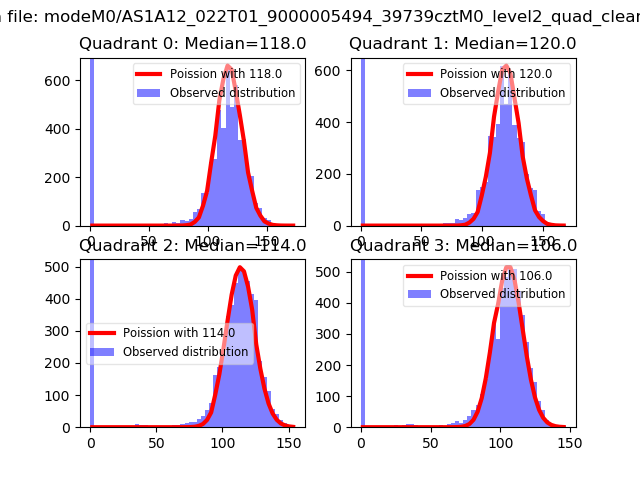 |
 |
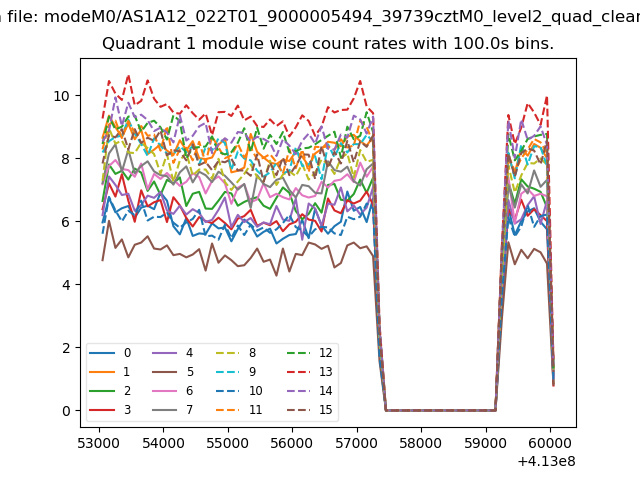
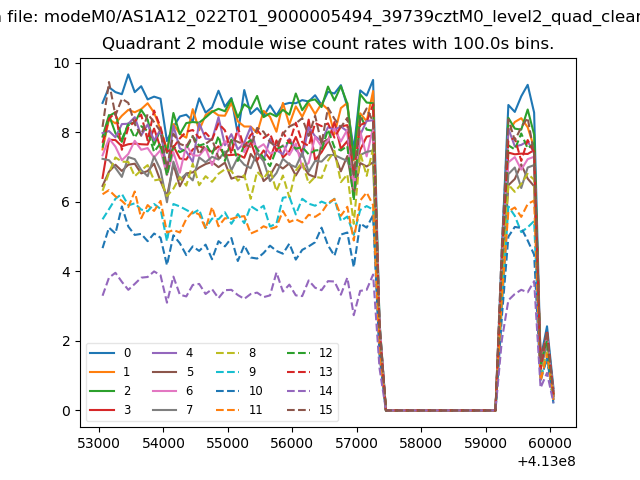
| Quadrant-wise count rates Data is divided into 100 sec bins |
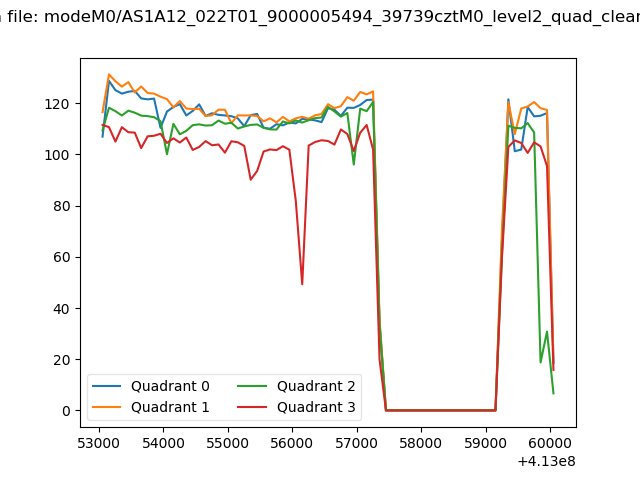 |
|
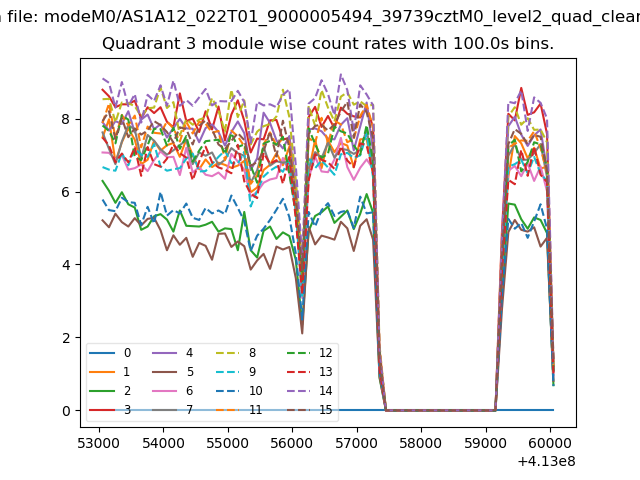
| Module-wise count rates for Quadrant A Data is divided into 100 sec bins |
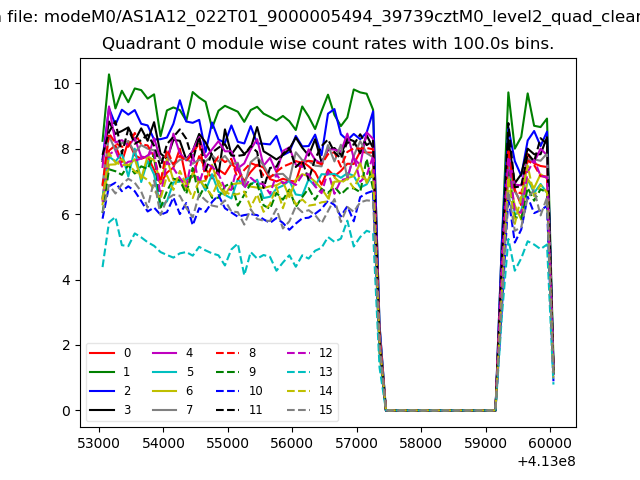 |
 |
| Module-wise count rates for Quadrant B Data is divided into 100 sec bins |
 |
 |
| Module-wise count rates for Quadrant C Data is divided into 100 sec bins |
 |
 |
| Module-wise count rates for Quadrant D Data is divided into 100 sec bins |
 |
 |
| Parameter | Plot |
|---|---|
| CZT HV Monitor | 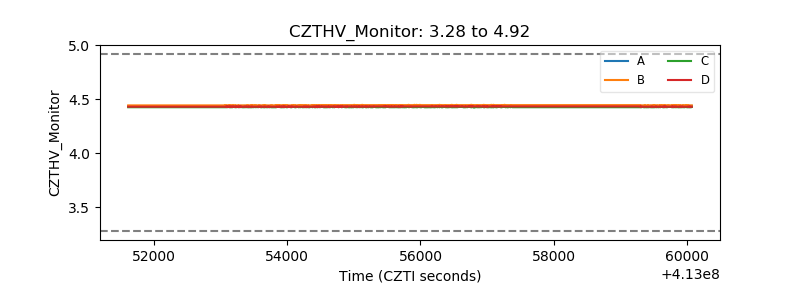 |
| D_VDD | 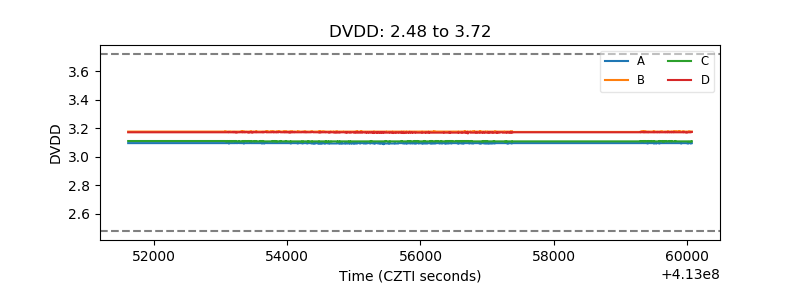 |
| Temperature 1 | 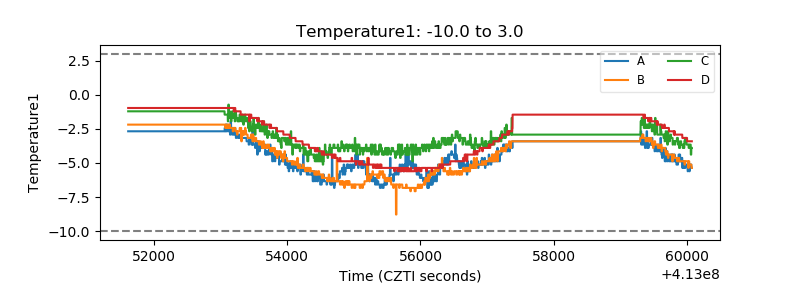 |
| Veto HV Monitor | 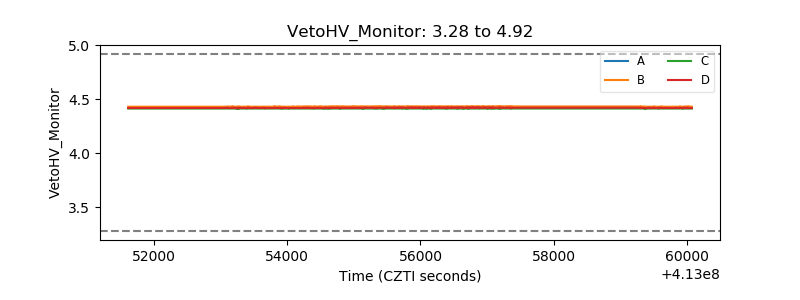 |
| Veto LLD | 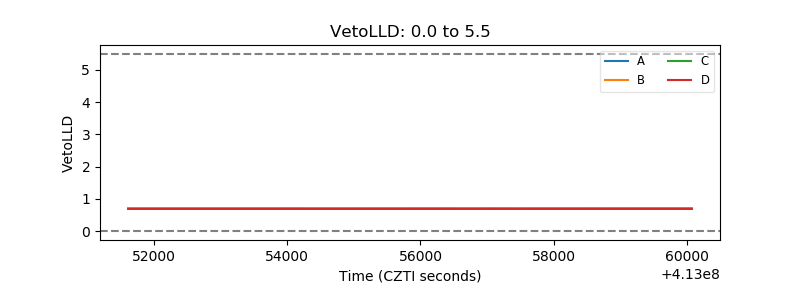 |
| Alpha Counter | 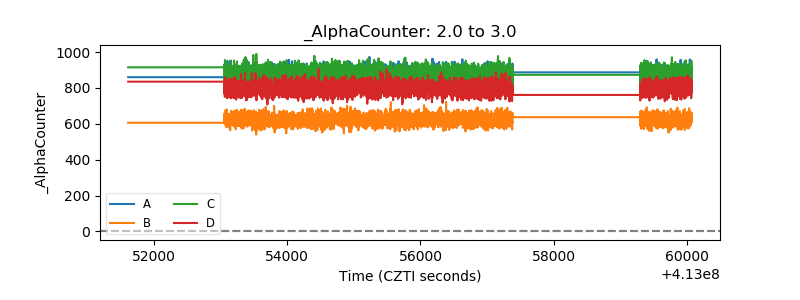 |
| _CPM_Rate | 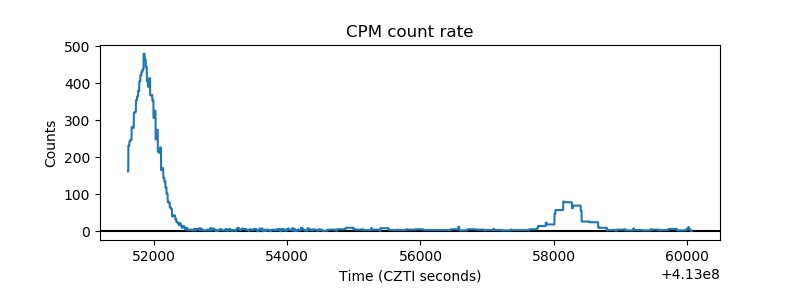 |
| CZT Counter | 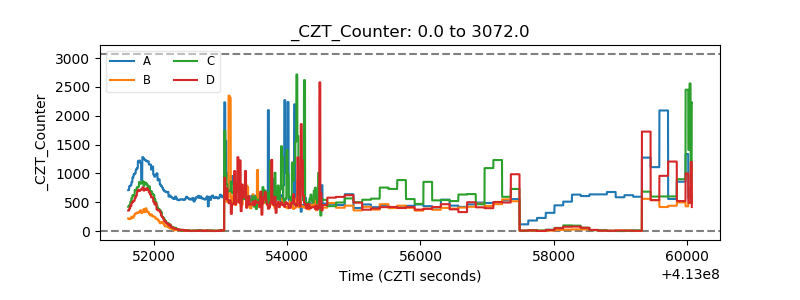 |
| +2.5 Volts monitor | 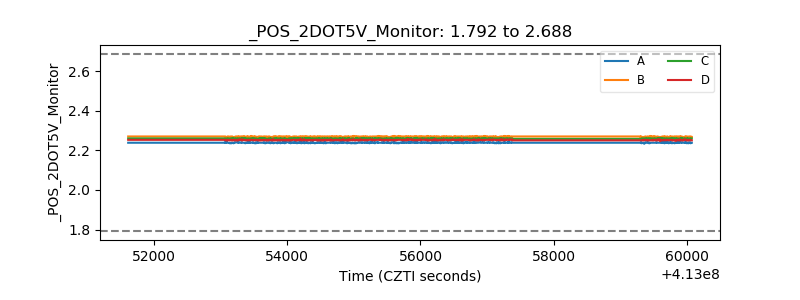 |
| +5 Volts monitor | 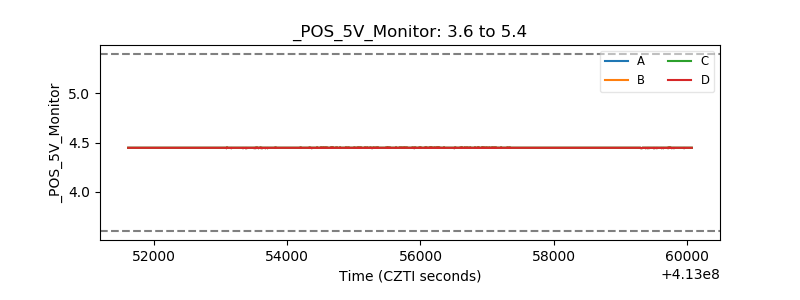 |
| _ROLL_ROT | 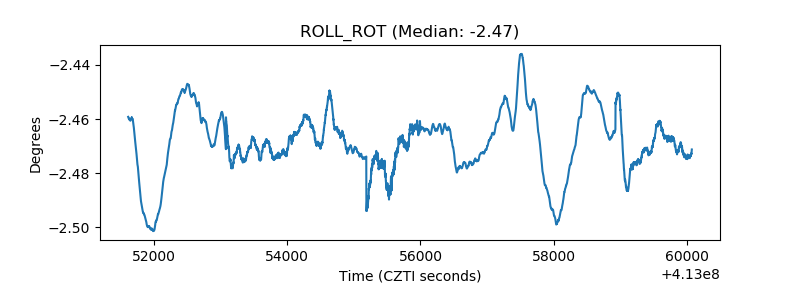 |
| _Roll_DEC | 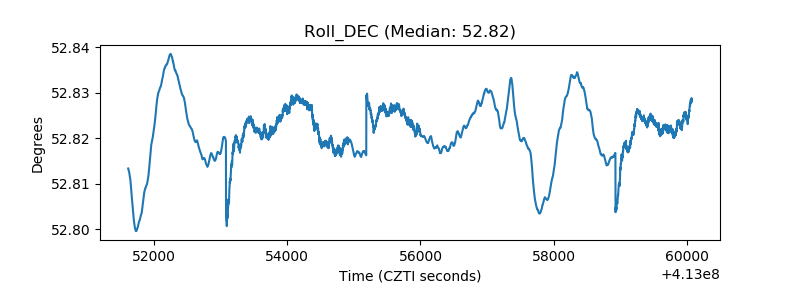 |
| _Roll_RA | 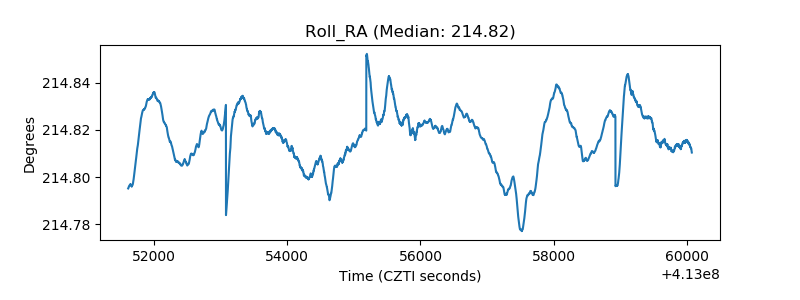 |
| Veto Counter | 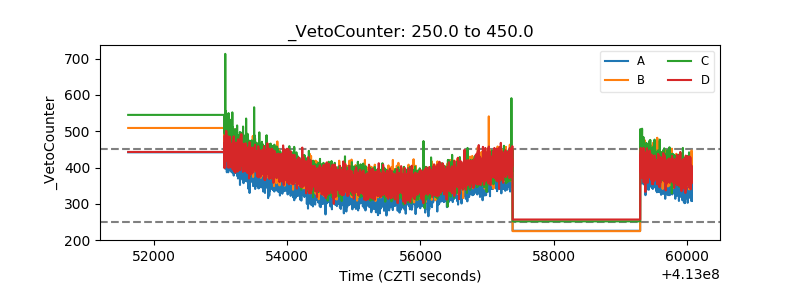 |