| Param | Original file | Final file |
|---|---|---|
| Filename | modeM0/AS1A12_022T01_9000005494_39740cztM0_level2.fits | modeM0/AS1A12_022T01_9000005494_39740cztM0_level2_quad_clean.evt |
| Size (bytes) | 378,178,560 | 90,768,960 |
| Size | 360.7 MB | 86.6 MB |
| Events in quadrant A | 3,225,670 | 618,975 |
| Events in quadrant B | 2,834,391 | 630,629 |
| Events in quadrant C | 3,712,429 | 573,405 |
| Events in quadrant D | 3,798,770 | 540,977 |
| Mode SS | |||
|---|---|---|---|
| Quadrant | BADHDUFLAG | Total packets | Discarded packets |
| A | 0 | 112 | 0 |
| B | 0 | 112 | 0 |
| C | 0 | 112 | 0 |
| D | 0 | 112 | 0 |
| Mode M0 | |||
|---|---|---|---|
| Quadrant | BADHDUFLAG | Total packets | Discarded packets |
| A | 0 | 13170 | 3 |
| B | 0 | 12153 | 2 |
| C | 0 | 14500 | 2 |
| D | 0 | 15148 | 2 |
| Mode M9 | |||
|---|---|---|---|
| Quadrant | BADHDUFLAG | Total packets | Discarded packets |
| A | 0 | 22 | 0 |
| B | 0 | 22 | 0 |
| C | 0 | 22 | 0 |
| D | 0 | 23 | 0 |
| Quadrant | Total seconds | Saturated seconds | Saturation percentage |
|---|---|---|---|
| A | 5494 | 94 | 1.710957% |
| B | 5494 | 67 | 1.219512% |
| C | 5494 | 338 | 6.152166% |
| D | 5494 | 308 | 5.606116% |
Noise dominated data is calculated using 1-second bins in cleaned event files. If a bin has >2000 counts, and if more than 50% of those come from <1% of pixels, then it is considered to be noise-dominated and hence unusable.
| Quadrant | # 1 sec bins | Bins with >0 counts | Bins with >2000 counts | High rate bins dominated by noise | Noise dominated (total time) | Noise dominated (detector-on time) | Marked lightcurve |
|---|---|---|---|---|---|---|---|
| A | 7076 | 5495 | 76 | 76 | 1.07% | 1.38% | 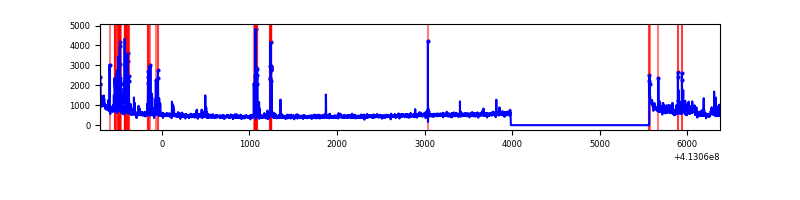 |
| B | 7076 | 5495 | 39 | 39 | 0.55% | 0.71% | 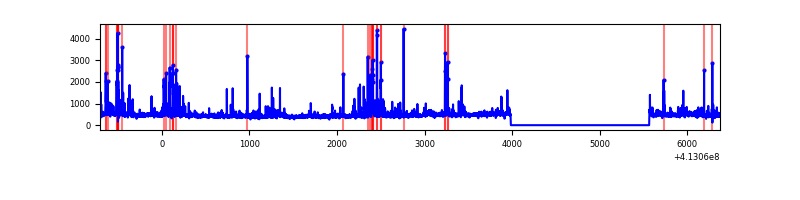 |
| C | 7076 | 5495 | 255 | 255 | 3.60% | 4.64% | 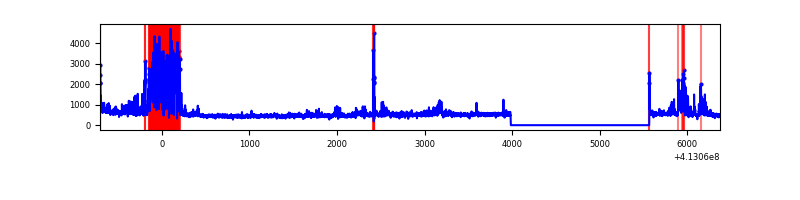 |
| D | 7076 | 5495 | 238 | 238 | 3.36% | 4.33% | 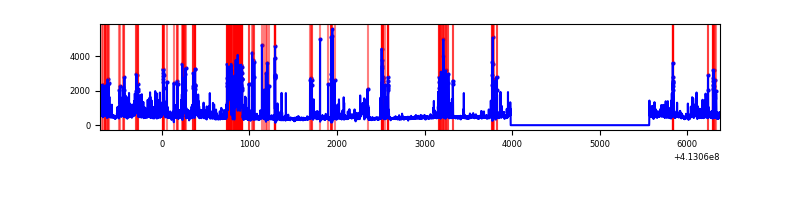 |
Top three noisy pixels from each quadrant. If the there are fewer than three noisy pixels in the level2.evt file, extra rows are filled as -1
| Pixel properties | Quadrant properties | ||||||
|---|---|---|---|---|---|---|---|
| Quadrant | DetID | PixID | Counts | Sigma | Mean | Median | Sigma |
| A | 10 | 83 | 461303 | 3742.14 | 598 | 585 | 123.1 |
| A | 13 | 248 | 160119 | 1295.8 | 598 | 585 | 123.1 |
| A | 9 | 143 | 140212 | 1134.1 | 598 | 585 | 123.1 |
| B | 5 | 255 | 188006 | 1612.58 | 596 | 579 | 116.2 |
| B | 5 | 172 | 170742 | 1464.04 | 596 | 579 | 116.2 |
| B | 0 | 190 | 37216 | 315.22 | 596 | 579 | 116.2 |
| C | 9 | 187 | 1032942 | 7747.11 | 572 | 574 | 133.3 |
| C | 15 | 214 | 235665 | 1764.17 | 572 | 574 | 133.3 |
| C | 15 | 208 | 160003 | 1196.39 | 572 | 574 | 133.3 |
| D | 12 | 227 | 725403 | 5077.71 | 574 | 557 | 142.8 |
| D | 13 | 171 | 222031 | 1551.47 | 574 | 557 | 142.8 |
| D | 12 | 218 | 160262 | 1118.77 | 574 | 557 | 142.8 |
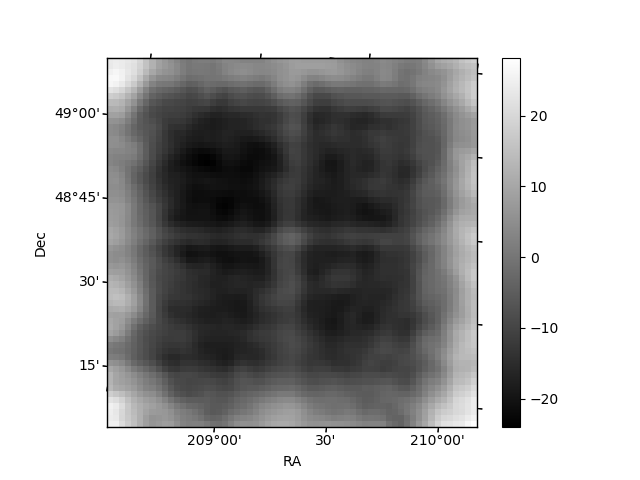
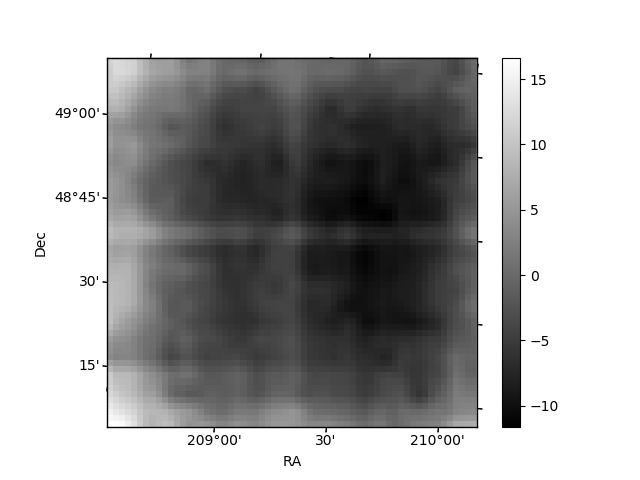
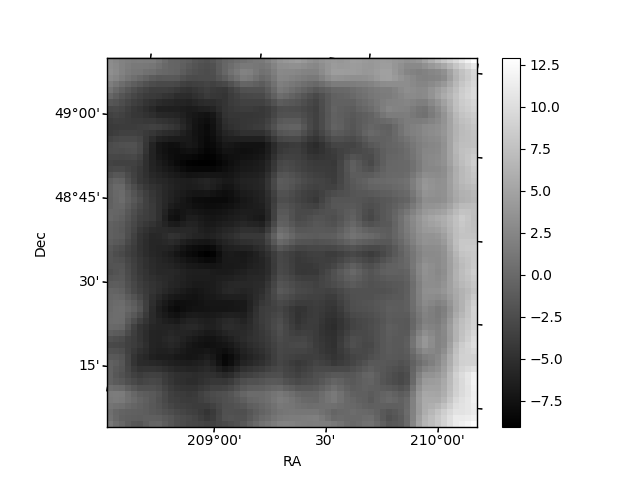
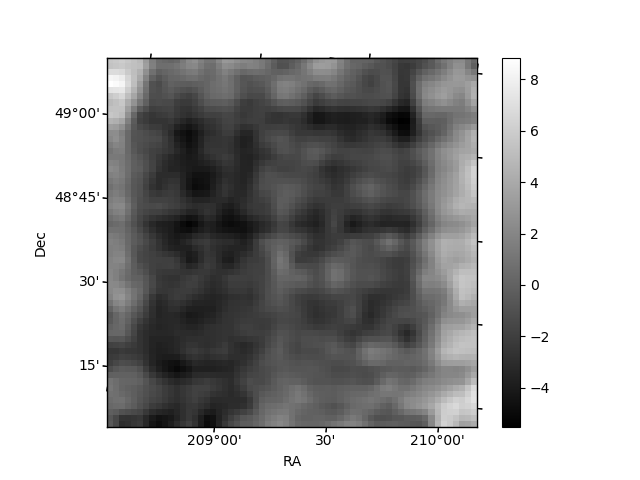
Histogram calculated using DETX and DETY for each event in the final _common_clean file
| Quadrant A | 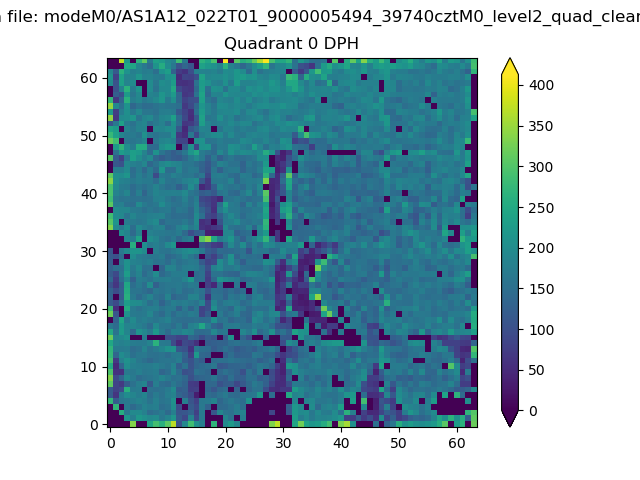 |
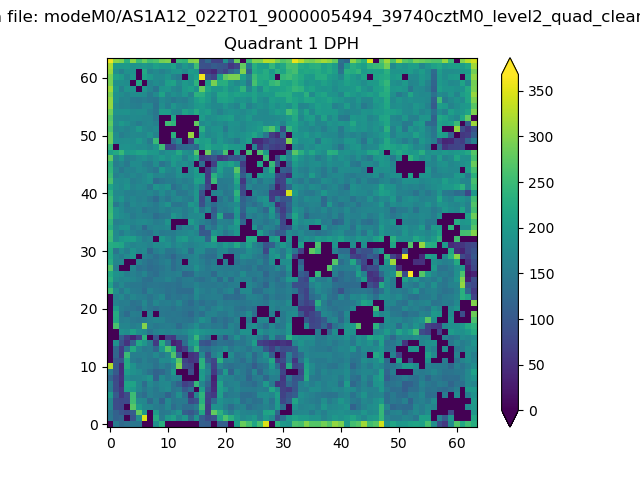 |
Quadrant B |
|---|---|---|---|
| Quadrant D | 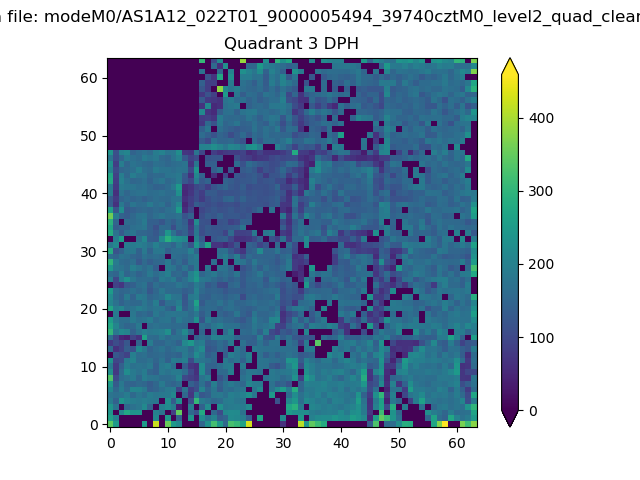 |
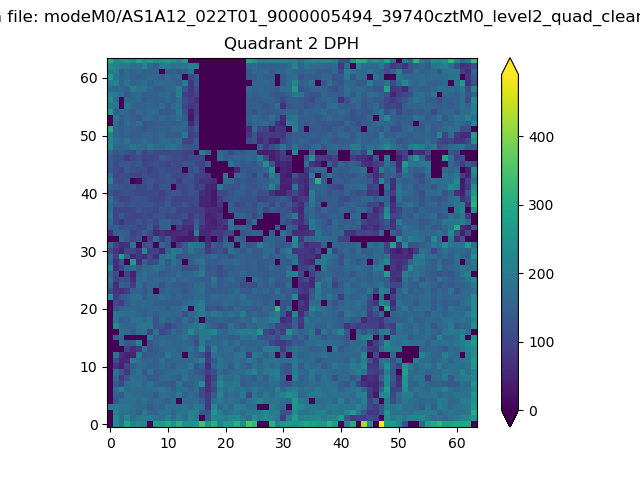 |
Quadrant C |
| Plot type | Count rate plots | Images |
|---|---|---|
| Comparison with Poisson distribution Blue bars denote a histogram of data divided into 1 sec bins. Red curve is a Poisson curve with rate = median count rate of data. |
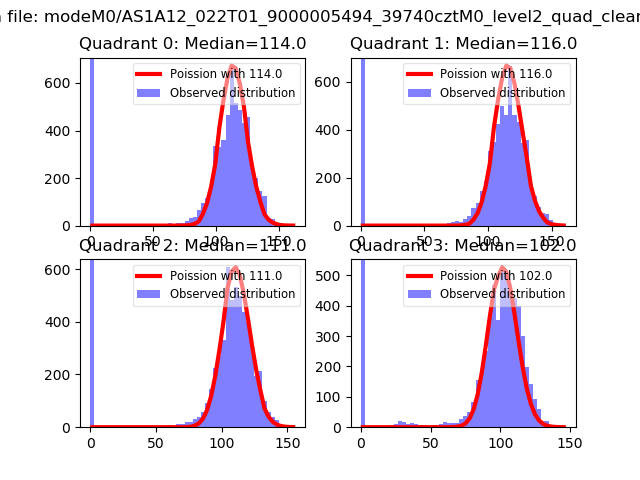 |
 |
| Quadrant-wise count rates Data is divided into 100 sec bins |
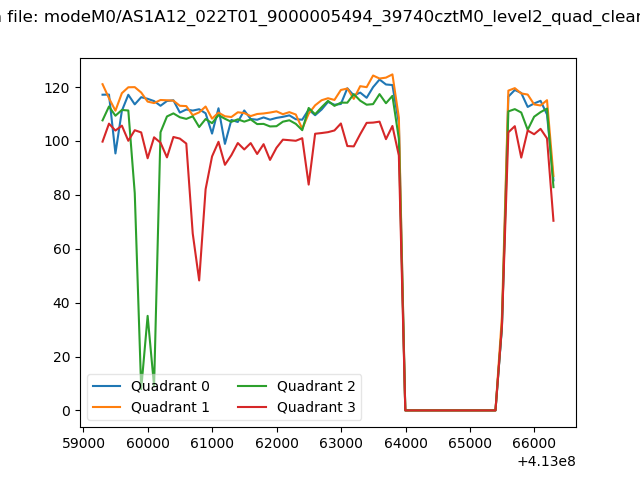 |
|
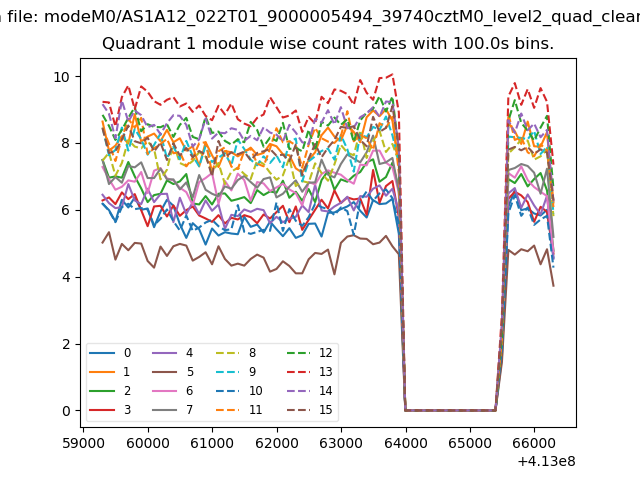
| Module-wise count rates for Quadrant A Data is divided into 100 sec bins |
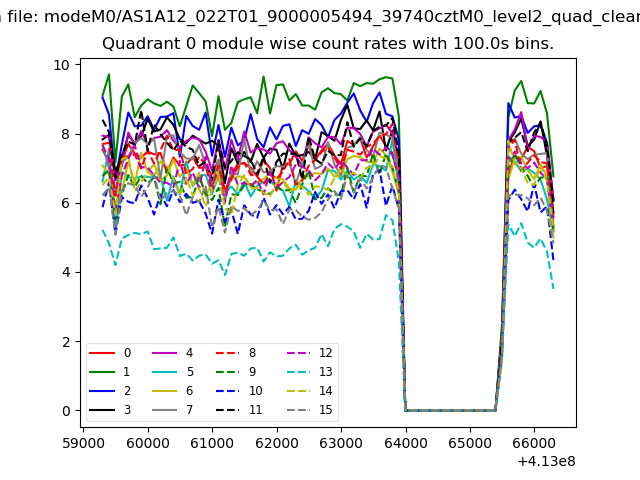 |
 |
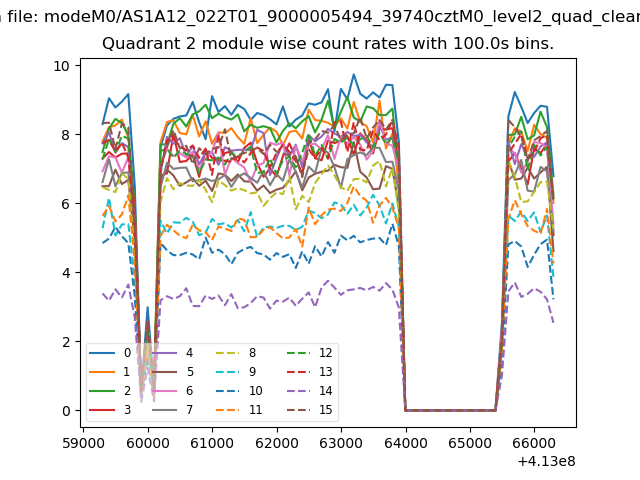
| Module-wise count rates for Quadrant B Data is divided into 100 sec bins |
 |
 |
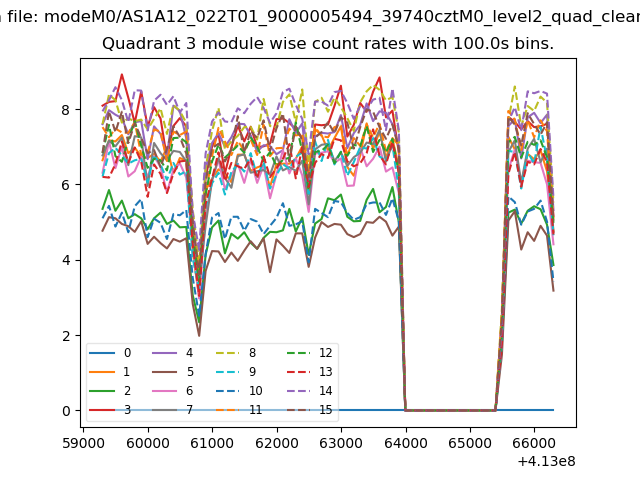
| Module-wise count rates for Quadrant C Data is divided into 100 sec bins |
 |
 |
| Module-wise count rates for Quadrant D Data is divided into 100 sec bins |
 |
 |
| Parameter | Plot |
|---|---|
| CZT HV Monitor | 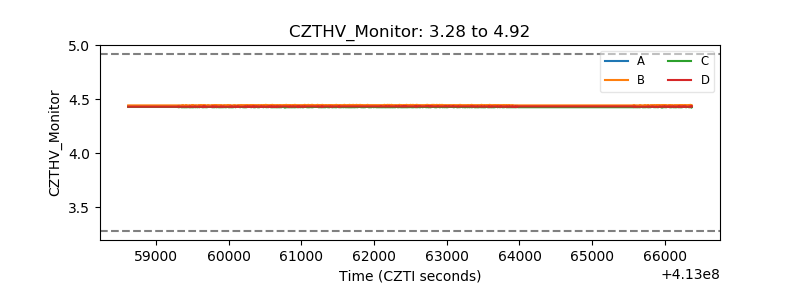 |
| D_VDD | 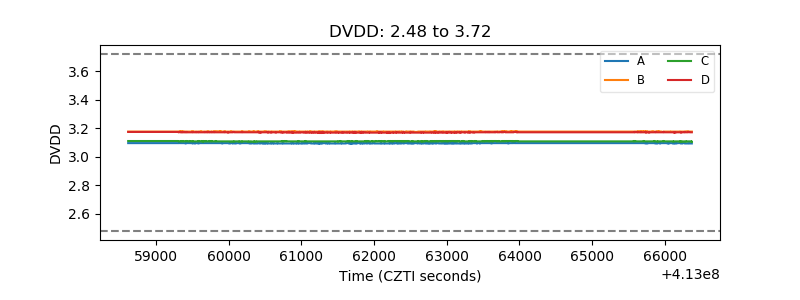 |
| Temperature 1 | 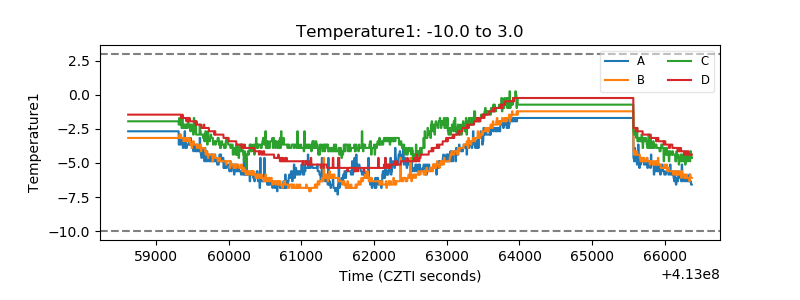 |
| Veto HV Monitor | 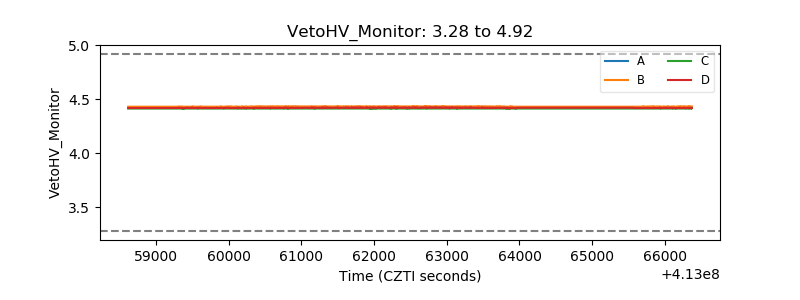 |
| Veto LLD | 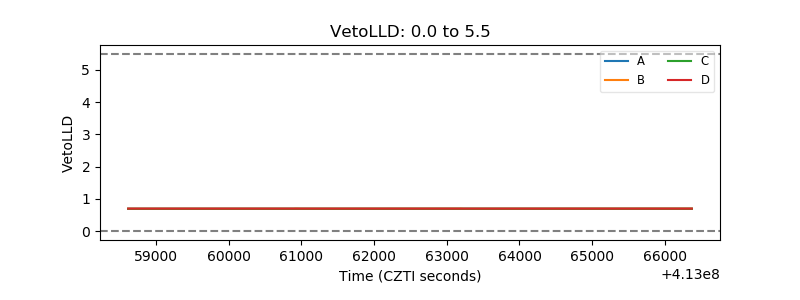 |
| Alpha Counter | 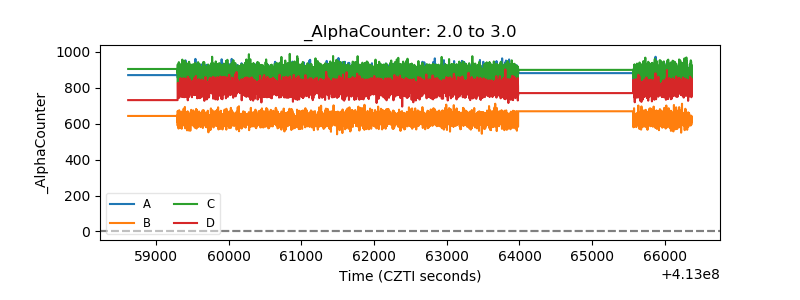 |
| _CPM_Rate | 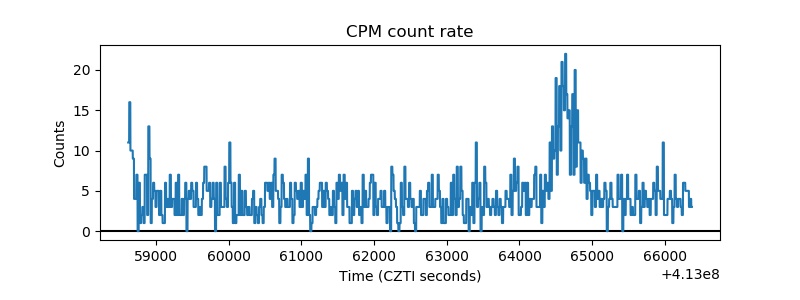 |
| CZT Counter | 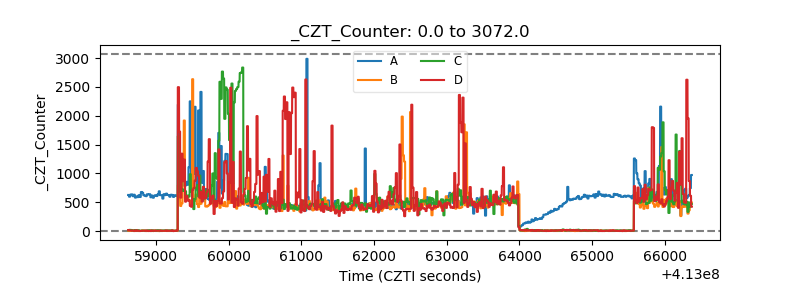 |
| +2.5 Volts monitor | 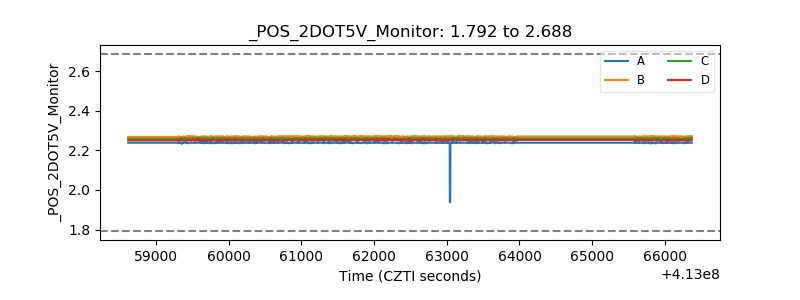 |
| +5 Volts monitor | 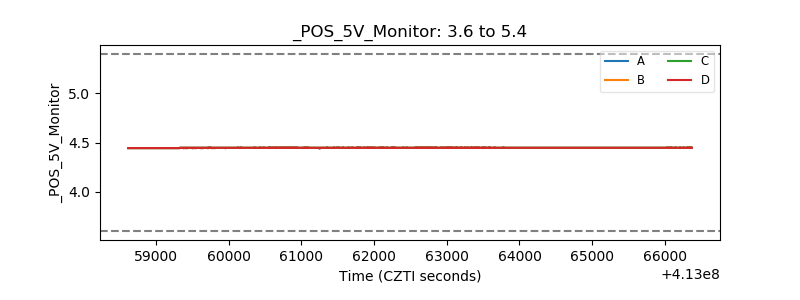 |
| _ROLL_ROT | 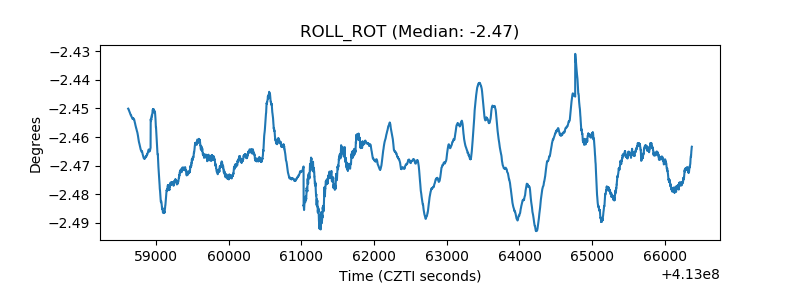 |
| _Roll_DEC | 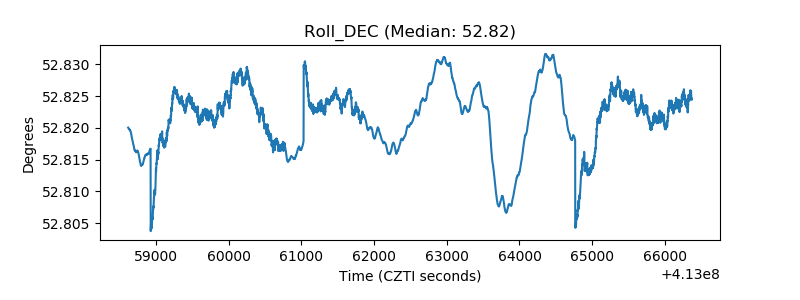 |
| _Roll_RA | 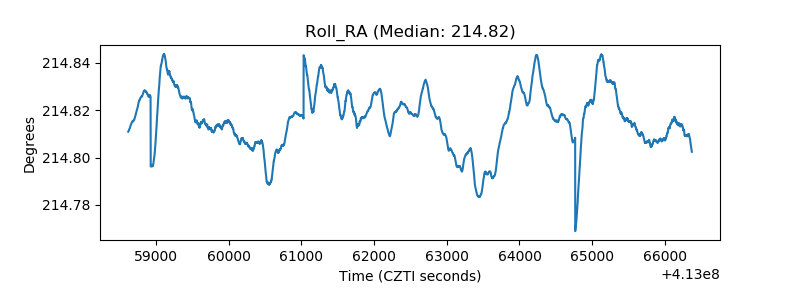 |
| Veto Counter | 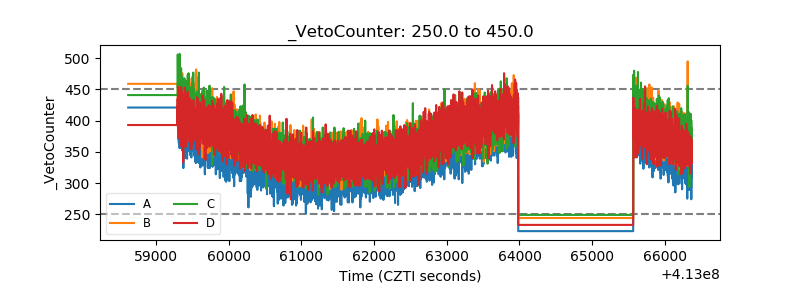 |