| Param | Original file | Final file |
|---|---|---|
| Filename | modeM0/AS1A12_022T01_9000005494_39742cztM0_level2.fits | modeM0/AS1A12_022T01_9000005494_39742cztM0_level2_quad_clean.evt |
| Size (bytes) | 411,442,560 | 96,384,960 |
| Size | 392.4 MB | 91.9 MB |
| Events in quadrant A | 3,320,088 | 657,689 |
| Events in quadrant B | 2,715,858 | 672,086 |
| Events in quadrant C | 3,023,274 | 643,815 |
| Events in quadrant D | 5,707,562 | 528,288 |
| Mode SS | |||
|---|---|---|---|
| Quadrant | BADHDUFLAG | Total packets | Discarded packets |
| A | 0 | 122 | 0 |
| B | 0 | 122 | 0 |
| C | 0 | 122 | 0 |
| D | 0 | 122 | 0 |
| Mode M0 | |||
|---|---|---|---|
| Quadrant | BADHDUFLAG | Total packets | Discarded packets |
| A | 0 | 13837 | 3 |
| B | 0 | 12276 | 2 |
| C | 0 | 12809 | 2 |
| D | 0 | 21117 | 2 |
| Mode M9 | |||
|---|---|---|---|
| Quadrant | BADHDUFLAG | Total packets | Discarded packets |
| A | 0 | 22 | 0 |
| B | 0 | 22 | 0 |
| C | 0 | 22 | 0 |
| D | 0 | 23 | 0 |
| Quadrant | Total seconds | Saturated seconds | Saturation percentage |
|---|---|---|---|
| A | 5957 | 52 | 0.872923% |
| B | 5957 | 12 | 0.201444% |
| C | 5957 | 17 | 0.285379% |
| D | 5957 | 829 | 13.916401% |
Noise dominated data is calculated using 1-second bins in cleaned event files. If a bin has >2000 counts, and if more than 50% of those come from <1% of pixels, then it is considered to be noise-dominated and hence unusable.
| Quadrant | # 1 sec bins | Bins with >0 counts | Bins with >2000 counts | High rate bins dominated by noise | Noise dominated (total time) | Noise dominated (detector-on time) | Marked lightcurve |
|---|---|---|---|---|---|---|---|
| A | 7240 | 5958 | 33 | 33 | 0.46% | 0.55% | 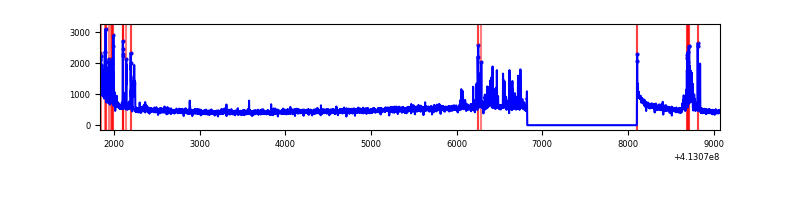 |
| B | 7240 | 5958 | 1 | 1 | 0.01% | 0.02% | 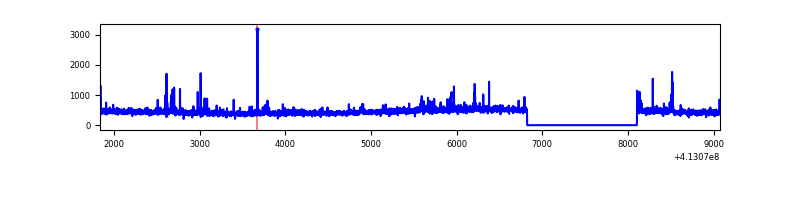 |
| C | 7240 | 5958 | 7 | 7 | 0.10% | 0.12% | 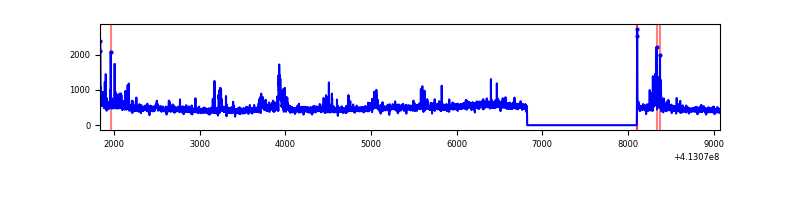 |
| D | 7240 | 5958 | 745 | 745 | 10.29% | 12.50% | 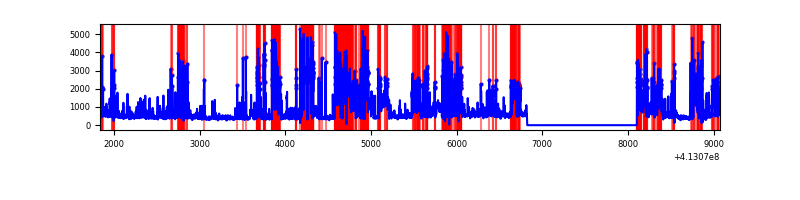 |
Top three noisy pixels from each quadrant. If the there are fewer than three noisy pixels in the level2.evt file, extra rows are filled as -1
| Pixel properties | Quadrant properties | ||||||
|---|---|---|---|---|---|---|---|
| Quadrant | DetID | PixID | Counts | Sigma | Mean | Median | Sigma |
| A | 10 | 83 | 476566 | 3608.78 | 644 | 630 | 131.9 |
| A | 15 | 174 | 158466 | 1196.79 | 644 | 630 | 131.9 |
| A | 13 | 248 | 118520 | 893.9 | 644 | 630 | 131.9 |
| B | 4 | 170 | 73127 | 577.19 | 645 | 626 | 125.6 |
| B | 5 | 255 | 31287 | 244.09 | 645 | 626 | 125.6 |
| B | 0 | 190 | 29108 | 226.75 | 645 | 626 | 125.6 |
| C | 15 | 214 | 259934 | 1765.67 | 630 | 632 | 146.9 |
| C | 15 | 208 | 143934 | 975.79 | 630 | 632 | 146.9 |
| C | 9 | 187 | 142324 | 964.83 | 630 | 632 | 146.9 |
| D | 12 | 227 | 2459467 | 16850.44 | 591 | 575 | 145.9 |
| D | 12 | 233 | 344933 | 2359.84 | 591 | 575 | 145.9 |
| D | 13 | 249 | 208010 | 1421.52 | 591 | 575 | 145.9 |
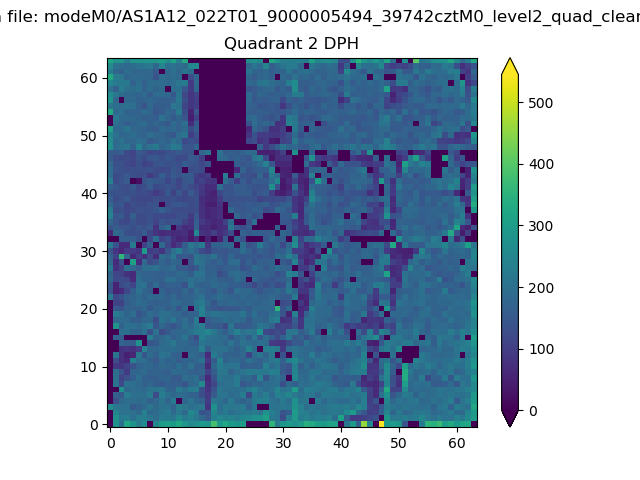
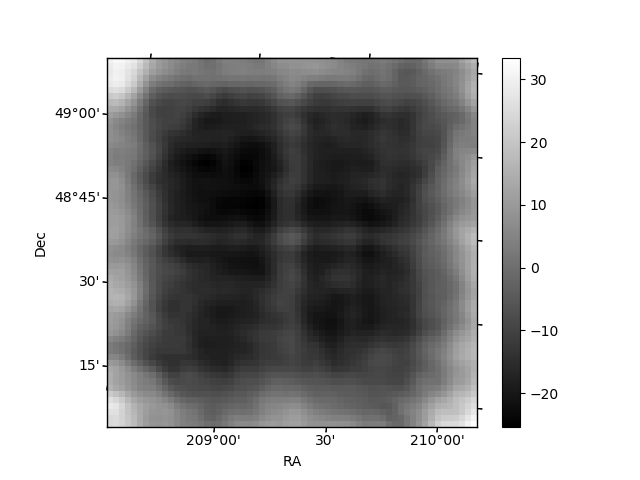
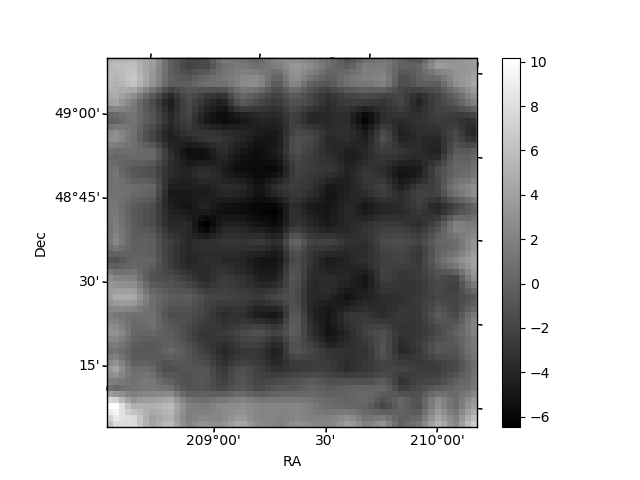
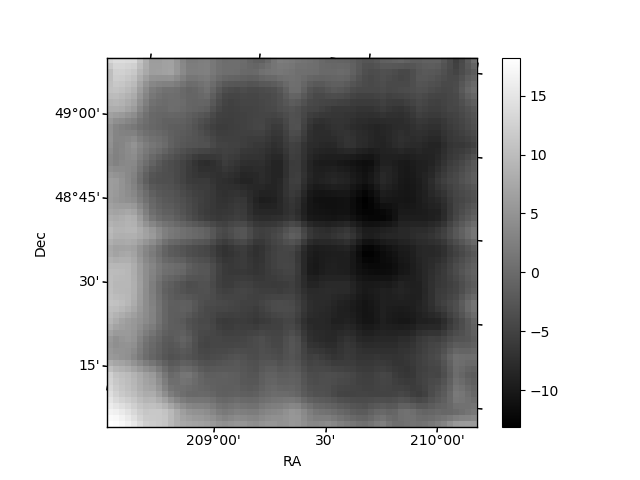
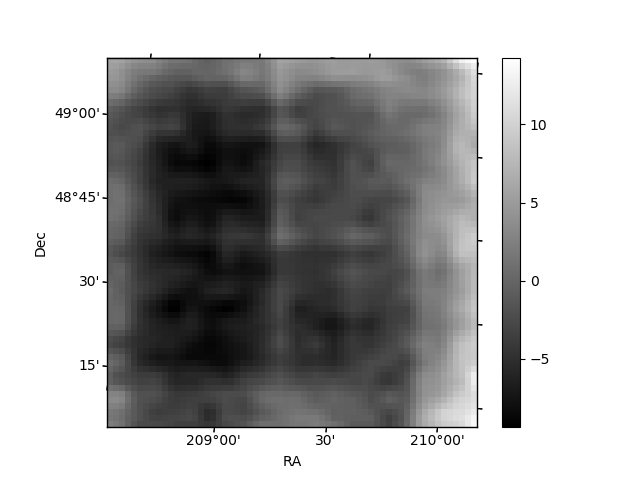
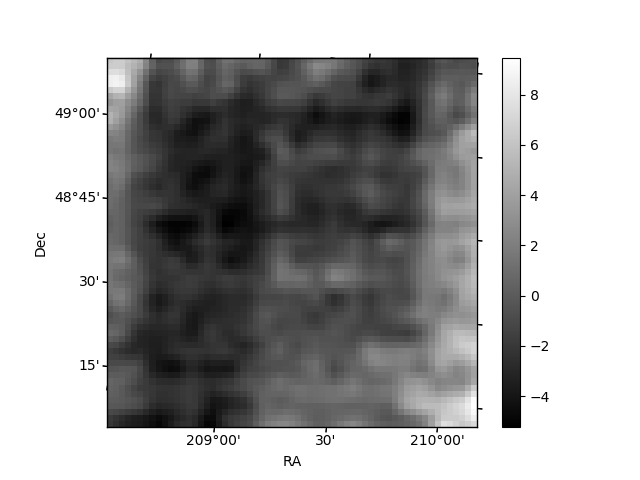
Histogram calculated using DETX and DETY for each event in the final _common_clean file
| Quadrant A | 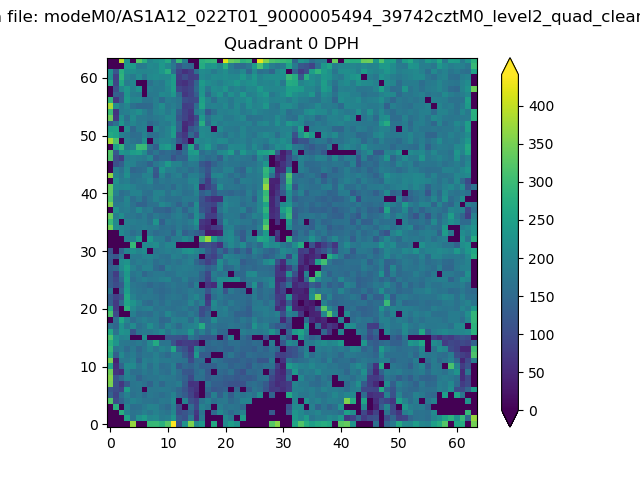 |
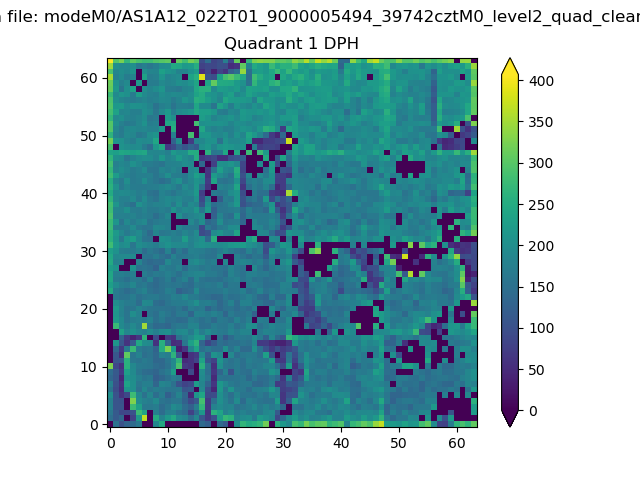 |
Quadrant B |
|---|---|---|---|
| Quadrant D | 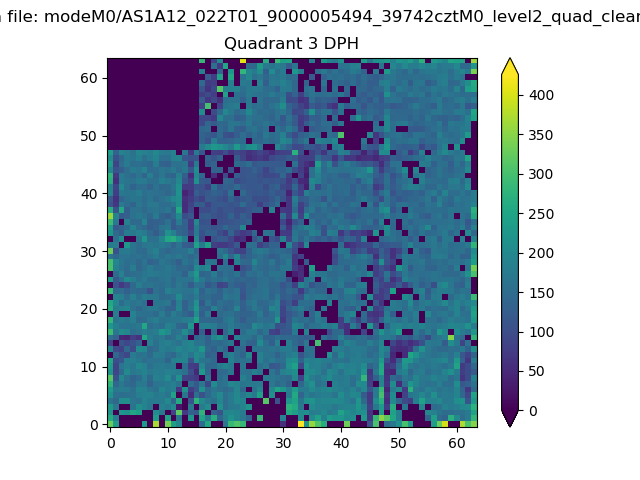 |
 |
Quadrant C |
| Plot type | Count rate plots | Images |
|---|---|---|
| Comparison with Poisson distribution Blue bars denote a histogram of data divided into 1 sec bins. Red curve is a Poisson curve with rate = median count rate of data. |
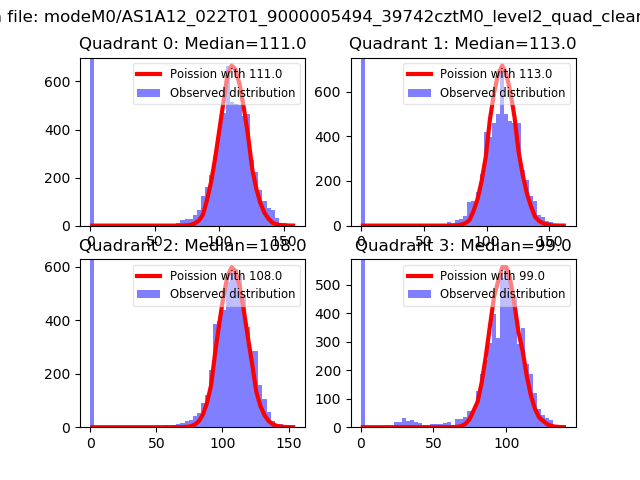 |
 |
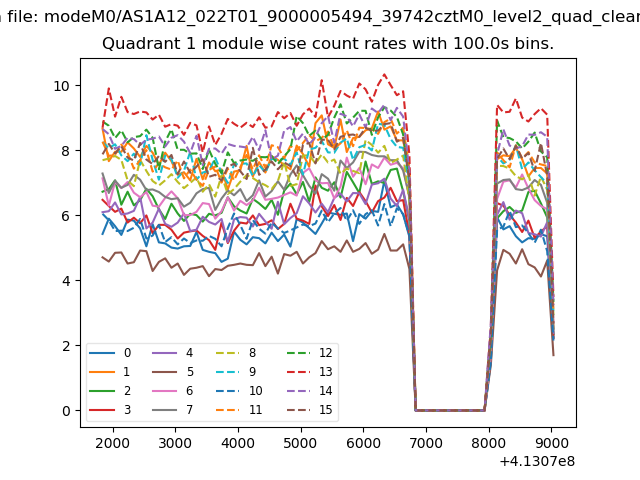
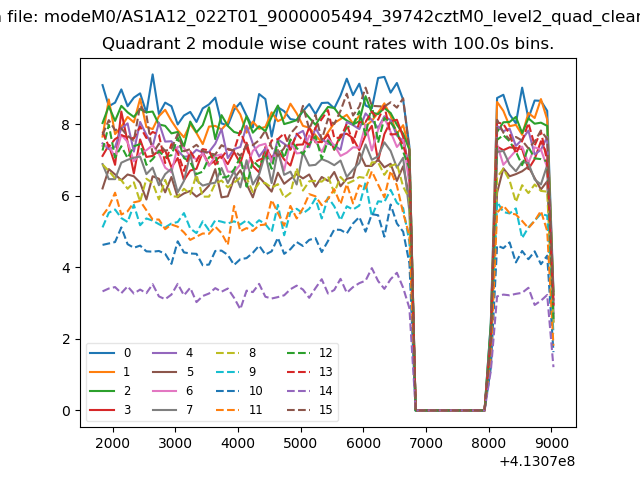
| Quadrant-wise count rates Data is divided into 100 sec bins |
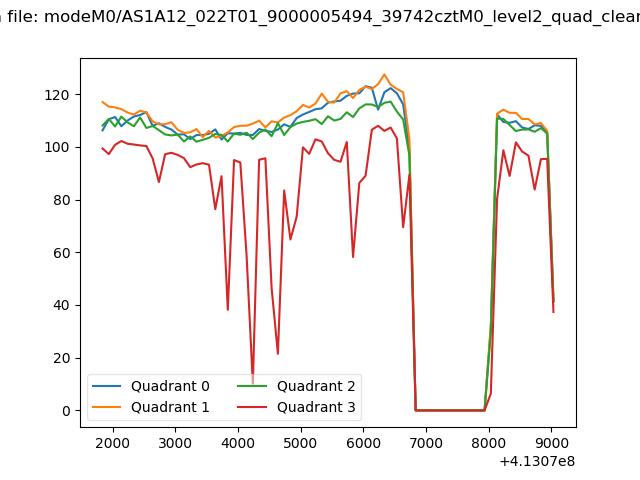 |
|
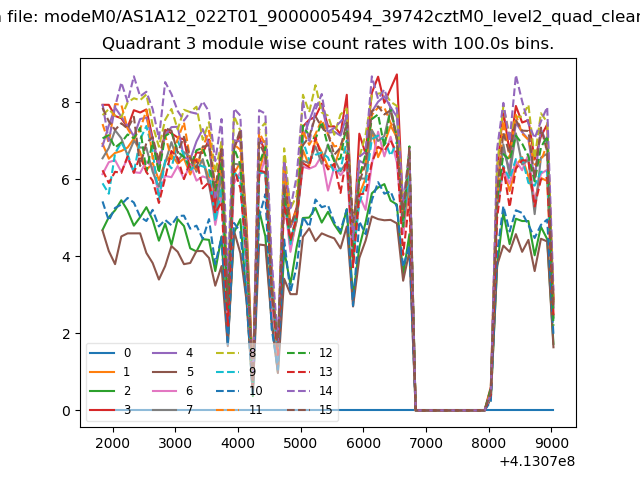
| Module-wise count rates for Quadrant A Data is divided into 100 sec bins |
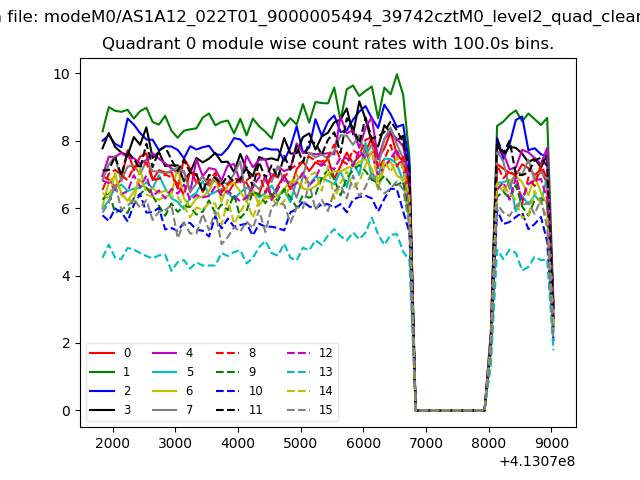 |
 |
| Module-wise count rates for Quadrant B Data is divided into 100 sec bins |
 |
 |
| Module-wise count rates for Quadrant C Data is divided into 100 sec bins |
 |
 |
| Module-wise count rates for Quadrant D Data is divided into 100 sec bins |
 |
 |
| Parameter | Plot |
|---|---|
| CZT HV Monitor | 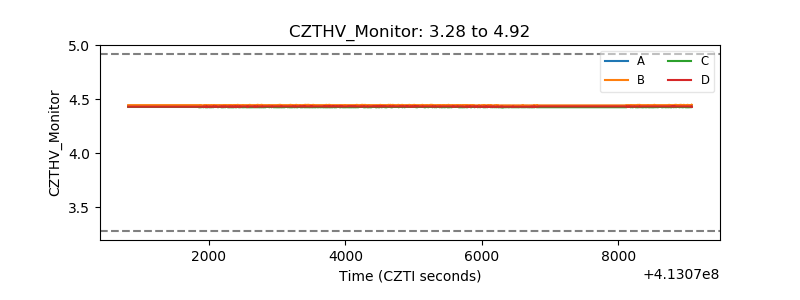 |
| D_VDD | 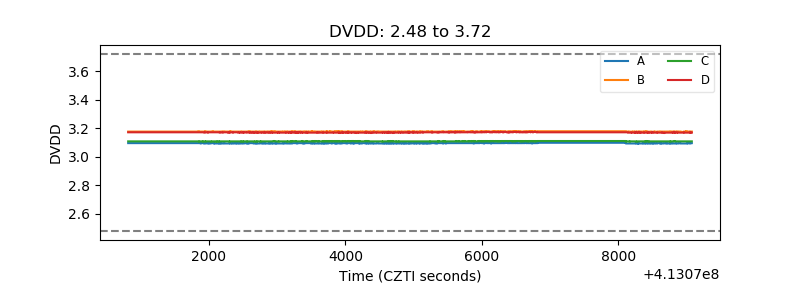 |
| Temperature 1 | 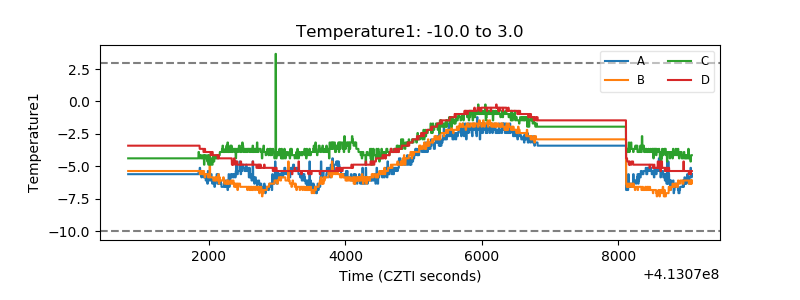 |
| Veto HV Monitor | 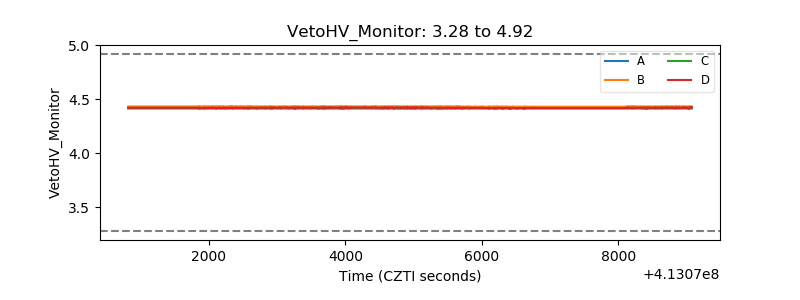 |
| Veto LLD | 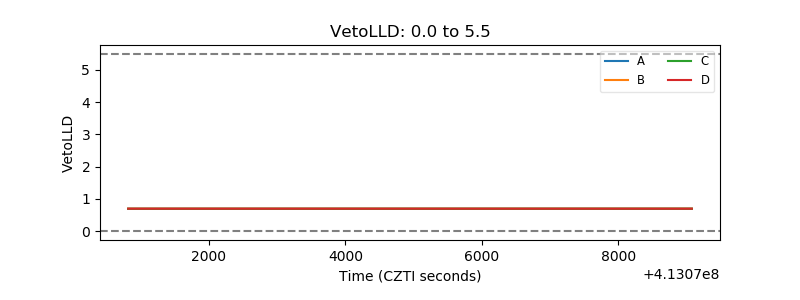 |
| Alpha Counter | 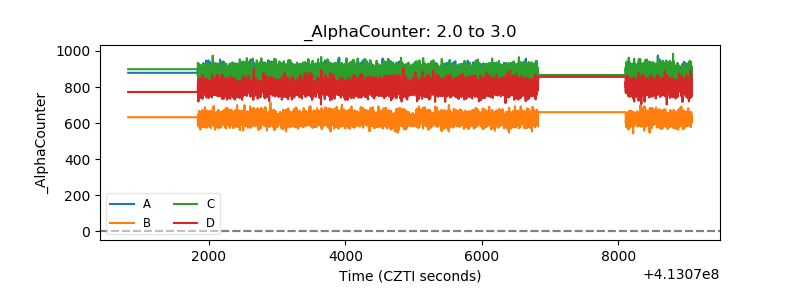 |
| _CPM_Rate | 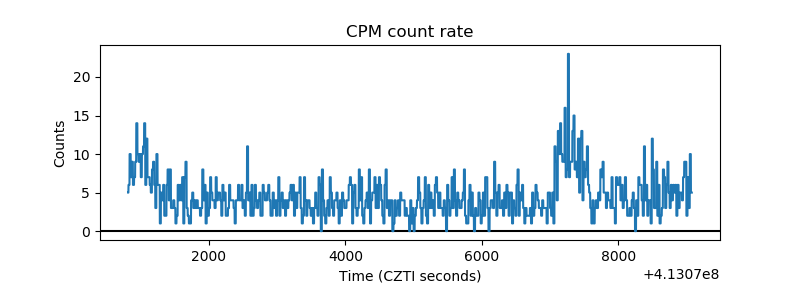 |
| CZT Counter | 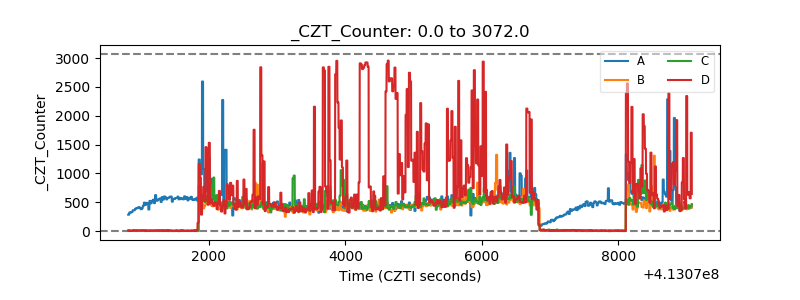 |
| +2.5 Volts monitor | 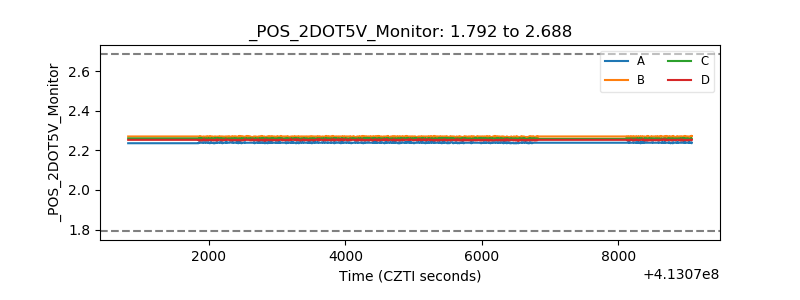 |
| +5 Volts monitor |  |
| _ROLL_ROT | 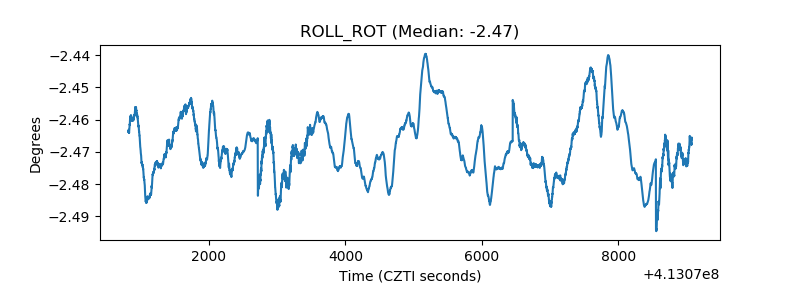 |
| _Roll_DEC | 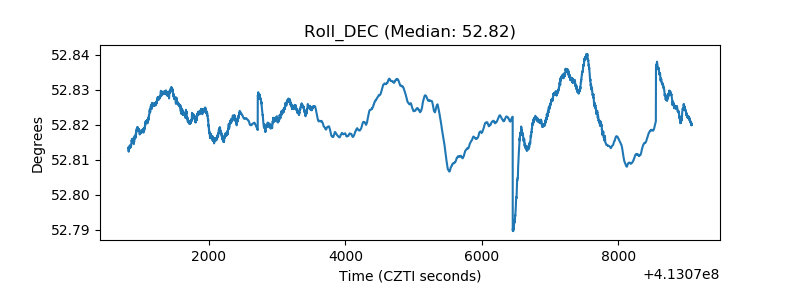 |
| _Roll_RA | 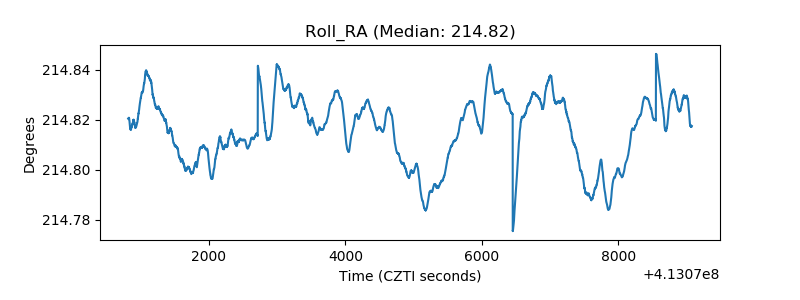 |
| Veto Counter | 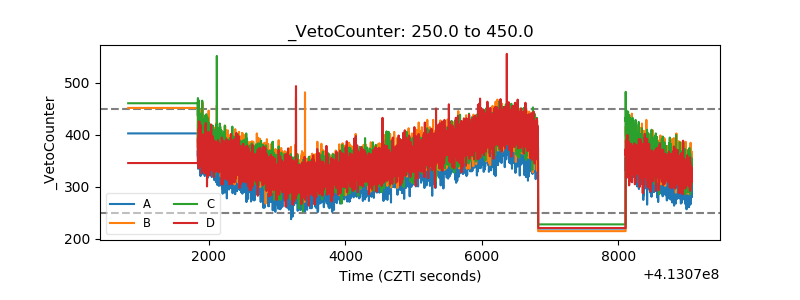 |