| Param | Original file | Final file |
|---|---|---|
| Filename | modeM0/AS1A12_022T01_9000005494_39744cztM0_level2.fits | modeM0/AS1A12_022T01_9000005494_39744cztM0_level2_quad_clean.evt |
| Size (bytes) | 701,737,920 | 172,440,000 |
| Size | 669.2 MB | 164.5 MB |
| Events in quadrant A | 7,399,516 | 1,079,452 |
| Events in quadrant B | 5,560,996 | 1,187,838 |
| Events in quadrant C | 5,899,293 | 1,148,954 |
| Events in quadrant D | 6,274,225 | 1,053,034 |
| Mode SS | |||
|---|---|---|---|
| Quadrant | BADHDUFLAG | Total packets | Discarded packets |
| A | 0 | 222 | 0 |
| B | 0 | 222 | 0 |
| C | 0 | 222 | 0 |
| D | 0 | 222 | 0 |
| Mode M0 | |||
|---|---|---|---|
| Quadrant | BADHDUFLAG | Total packets | Discarded packets |
| A | 0 | 29152 | 4 |
| B | 0 | 24129 | 3 |
| C | 0 | 24416 | 3 |
| D | 0 | 26610 | 3 |
| Mode M9 | |||
|---|---|---|---|
| Quadrant | BADHDUFLAG | Total packets | Discarded packets |
| A | 0 | 35 | 0 |
| B | 0 | 35 | 0 |
| C | 0 | 35 | 0 |
| D | 0 | 36 | 0 |
| Quadrant | Total seconds | Saturated seconds | Saturation percentage |
|---|---|---|---|
| A | 10854 | 909 | 8.374793% |
| B | 10854 | 188 | 1.732080% |
| C | 10854 | 51 | 0.469873% |
| D | 10854 | 298 | 2.745532% |
Noise dominated data is calculated using 1-second bins in cleaned event files. If a bin has >2000 counts, and if more than 50% of those come from <1% of pixels, then it is considered to be noise-dominated and hence unusable.
| Quadrant | # 1 sec bins | Bins with >0 counts | Bins with >2000 counts | High rate bins dominated by noise | Noise dominated (total time) | Noise dominated (detector-on time) | Marked lightcurve |
|---|---|---|---|---|---|---|---|
| A | 13628 | 10856 | 683 | 683 | 5.01% | 6.29% | 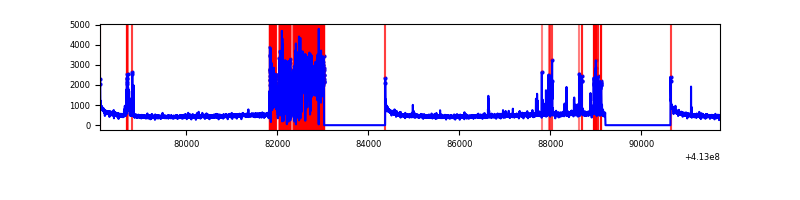 |
| B | 13628 | 10856 | 127 | 127 | 0.93% | 1.17% | 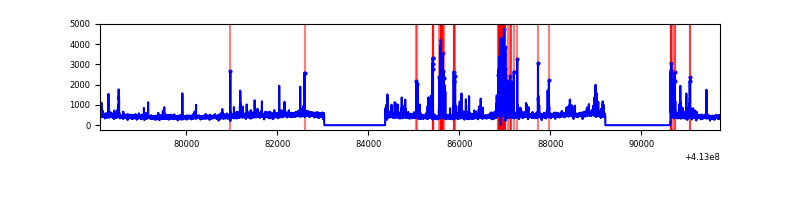 |
| C | 13628 | 10856 | 41 | 41 | 0.30% | 0.38% | 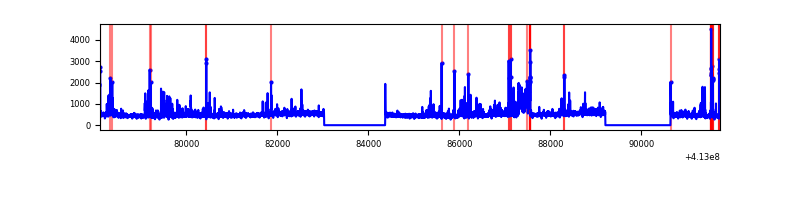 |
| D | 13628 | 10856 | 262 | 262 | 1.92% | 2.41% | 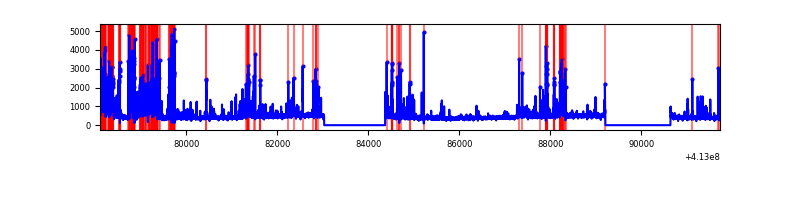 |
Top three noisy pixels from each quadrant. If the there are fewer than three noisy pixels in the level2.evt file, extra rows are filled as -1
| Pixel properties | Quadrant properties | ||||||
|---|---|---|---|---|---|---|---|
| Quadrant | DetID | PixID | Counts | Sigma | Mean | Median | Sigma |
| A | 15 | 174 | 2058353 | 9064.09 | 1119 | 1093 | 227.0 |
| A | 10 | 83 | 785048 | 3454.03 | 1119 | 1093 | 227.0 |
| A | 15 | 190 | 61489 | 266.1 | 1119 | 1093 | 227.0 |
| B | 5 | 255 | 728658 | 3214.1 | 1167 | 1132 | 226.4 |
| B | 4 | 170 | 77983 | 339.51 | 1167 | 1132 | 226.4 |
| B | 0 | 190 | 56334 | 243.87 | 1167 | 1132 | 226.4 |
| C | 9 | 187 | 460034 | 1728.92 | 1145 | 1152 | 265.4 |
| C | 15 | 214 | 441911 | 1660.64 | 1145 | 1152 | 265.4 |
| C | 15 | 208 | 430366 | 1617.14 | 1145 | 1152 | 265.4 |
| D | 12 | 227 | 1206367 | 4327.23 | 1138 | 1104 | 278.5 |
| D | 12 | 233 | 261852 | 936.16 | 1138 | 1104 | 278.5 |
| D | 1 | 52 | 126818 | 451.35 | 1138 | 1104 | 278.5 |
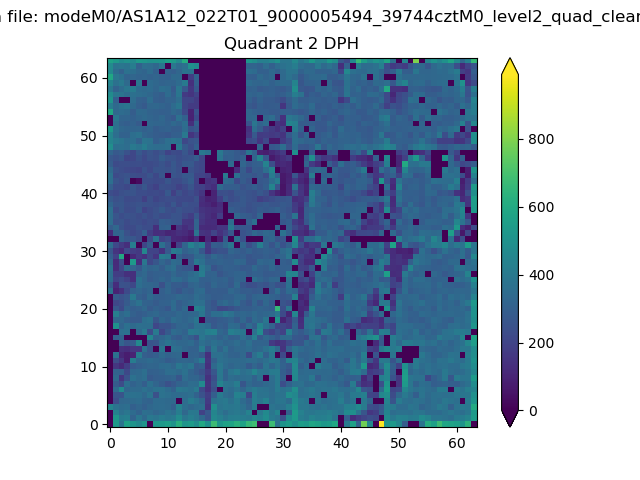
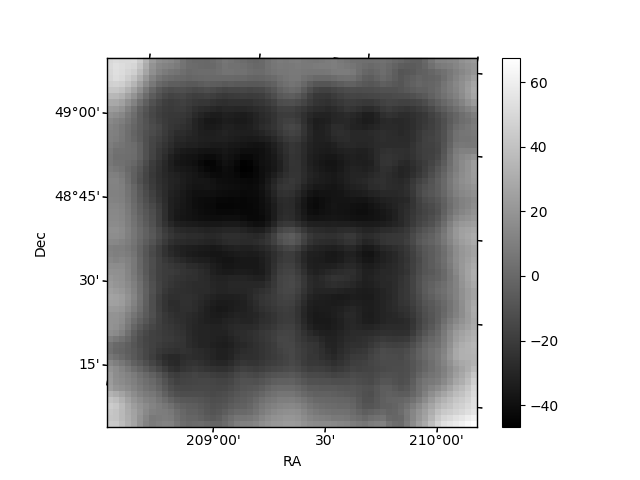
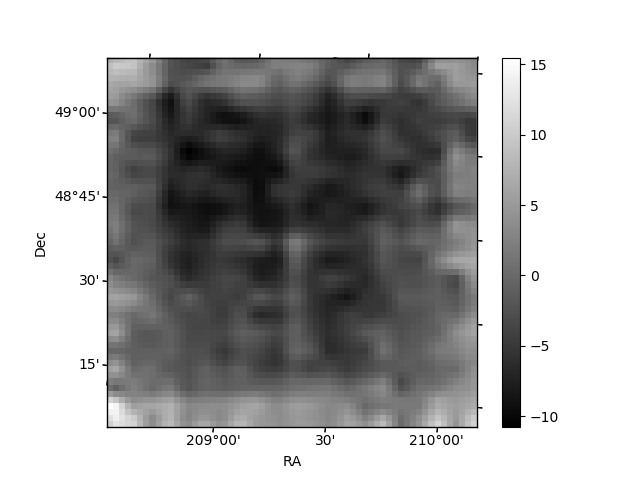
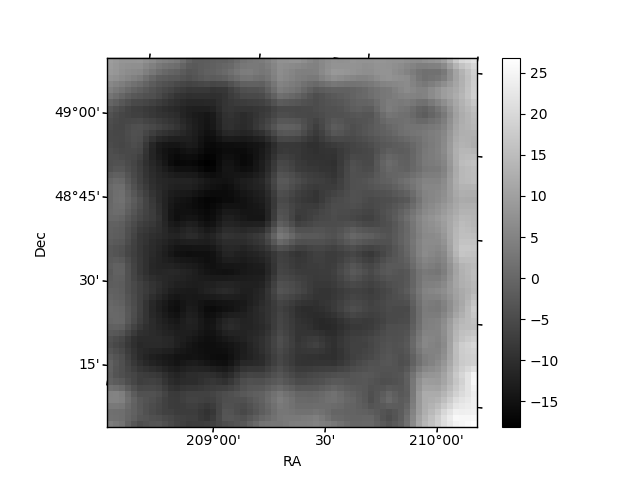
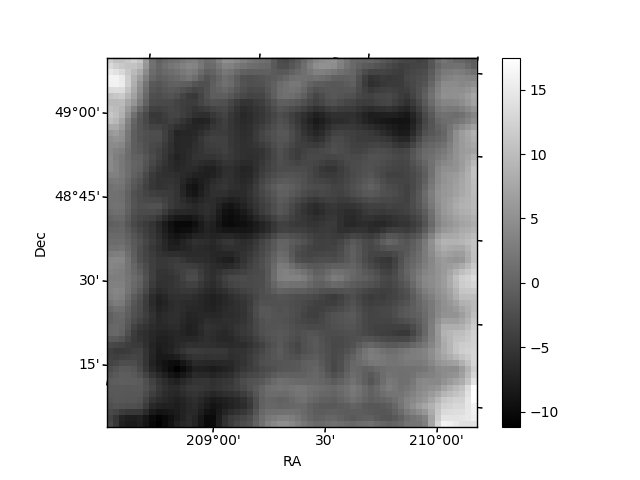
Histogram calculated using DETX and DETY for each event in the final _common_clean file
| Quadrant A | 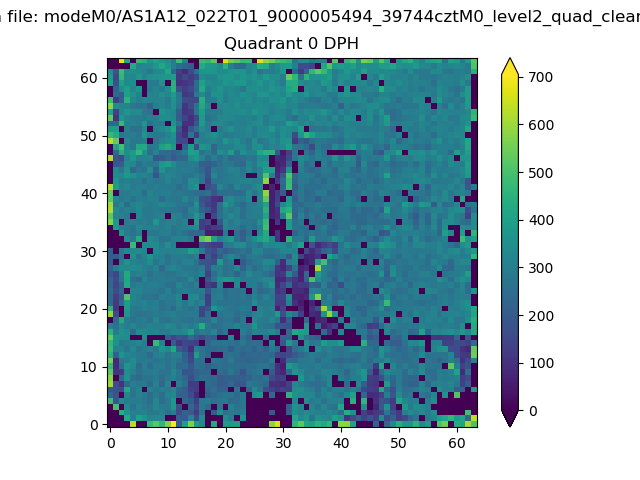 |
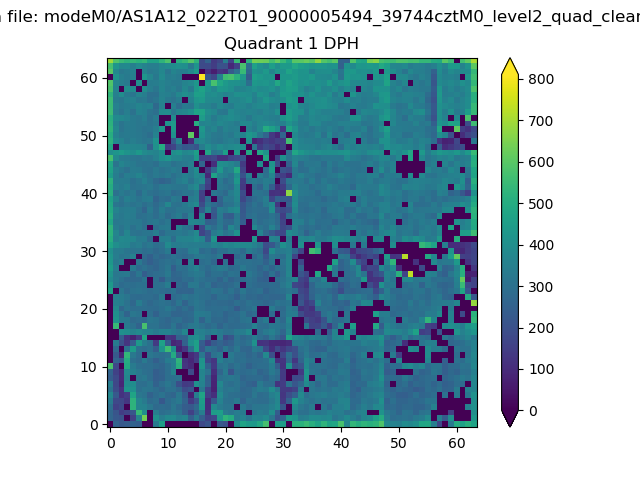 |
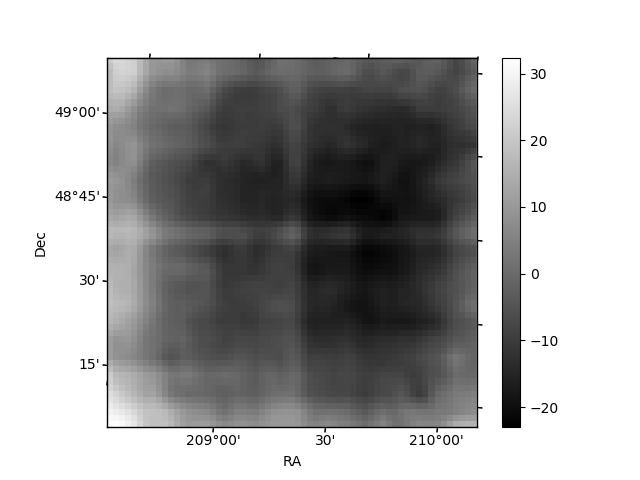
Quadrant B |
|---|---|---|---|
| Quadrant D | 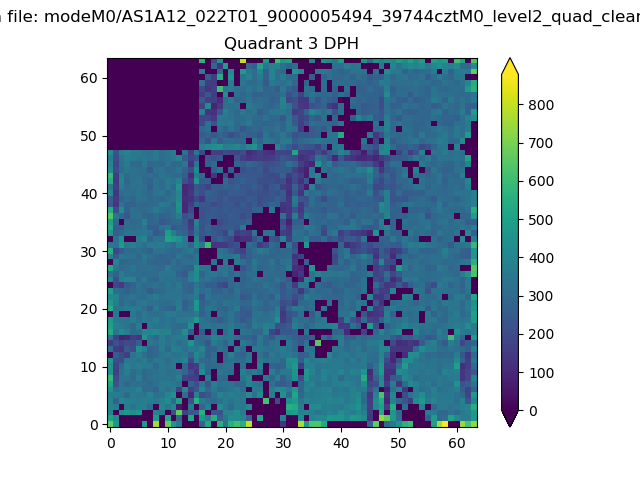 |
 |
Quadrant C |
| Plot type | Count rate plots | Images |
|---|---|---|
| Comparison with Poisson distribution Blue bars denote a histogram of data divided into 1 sec bins. Red curve is a Poisson curve with rate = median count rate of data. |
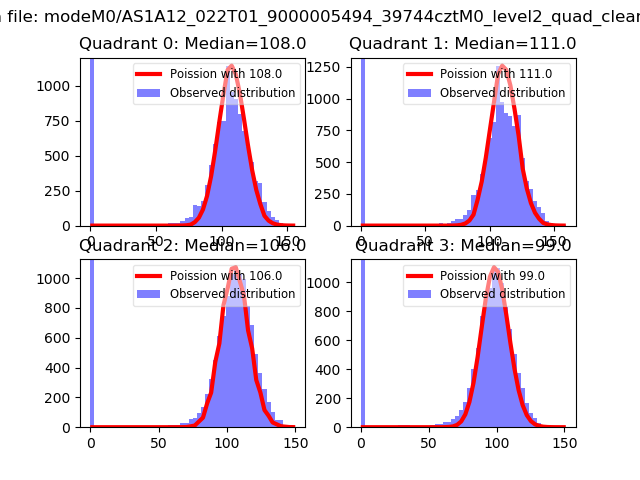 |
 |
| Quadrant-wise count rates Data is divided into 100 sec bins |
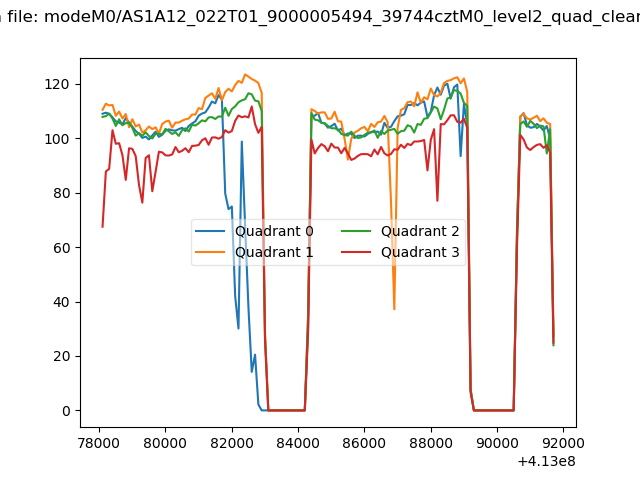 |
|
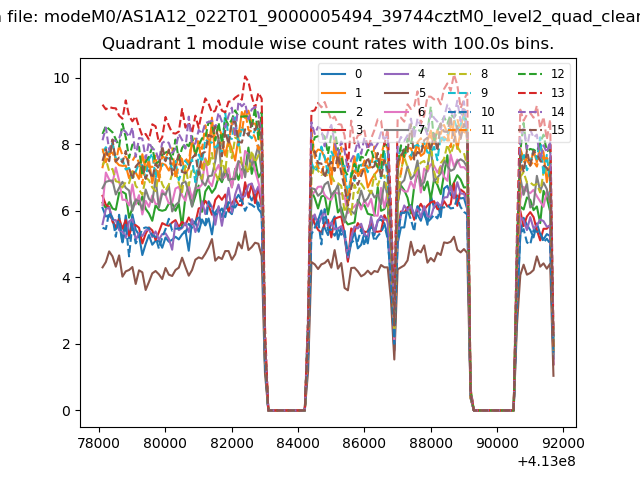
| Module-wise count rates for Quadrant A Data is divided into 100 sec bins |
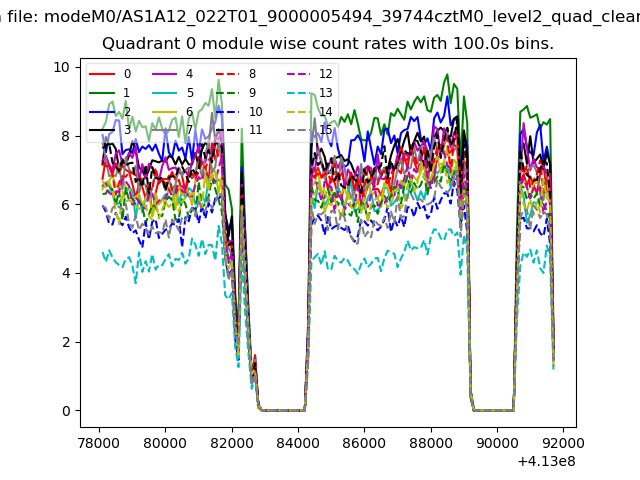 |
 |
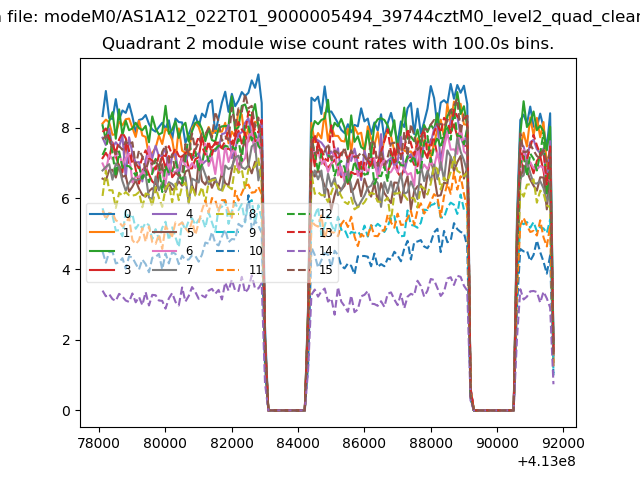
| Module-wise count rates for Quadrant B Data is divided into 100 sec bins |
 |
 |
| Module-wise count rates for Quadrant C Data is divided into 100 sec bins |
 |
 |
| Module-wise count rates for Quadrant D Data is divided into 100 sec bins |
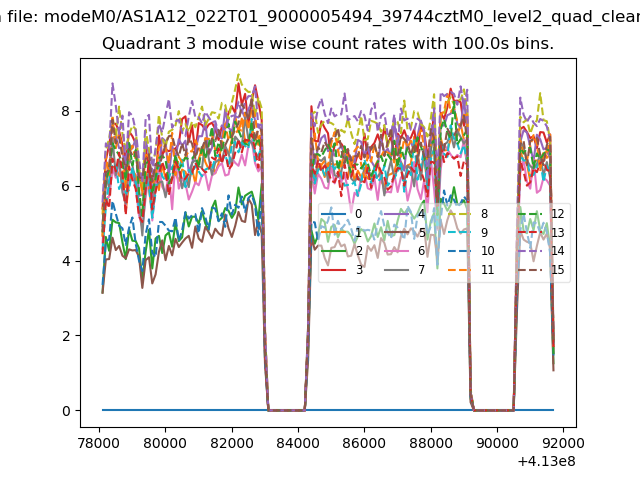 |
 |
| Parameter | Plot |
|---|---|
| CZT HV Monitor | 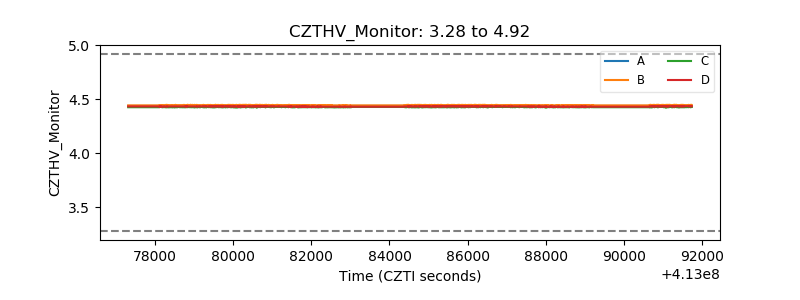 |
| D_VDD | 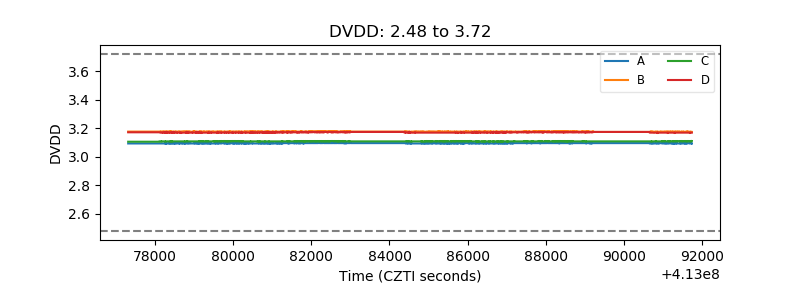 |
| Temperature 1 | 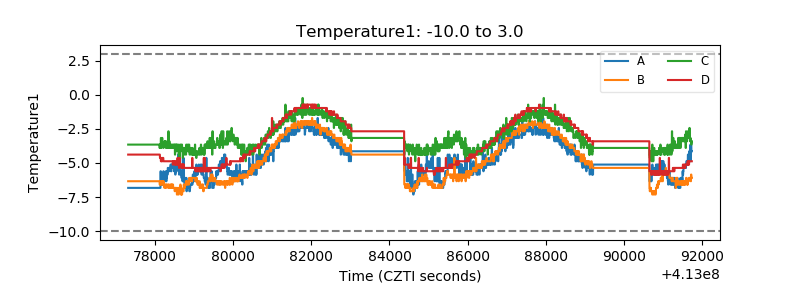 |
| Veto HV Monitor |  |
| Veto LLD | 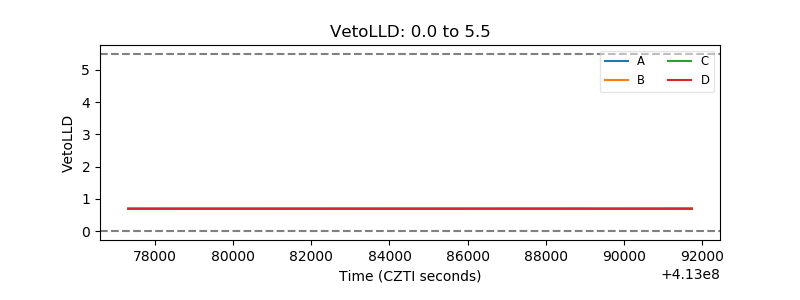 |
| Alpha Counter | 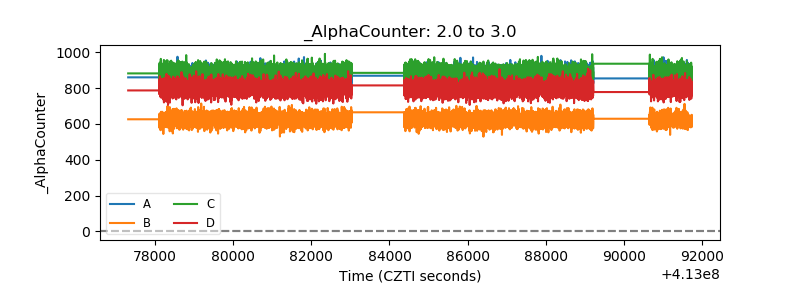 |
| _CPM_Rate | 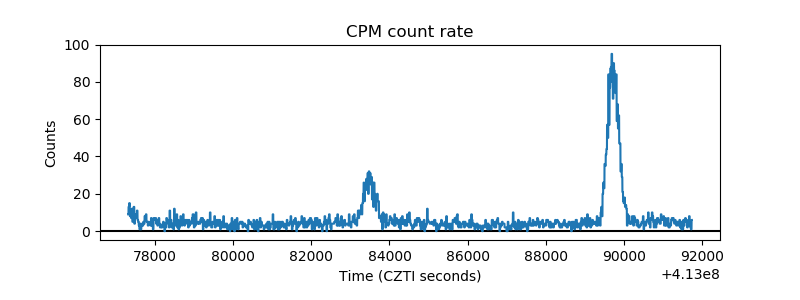 |
| CZT Counter | 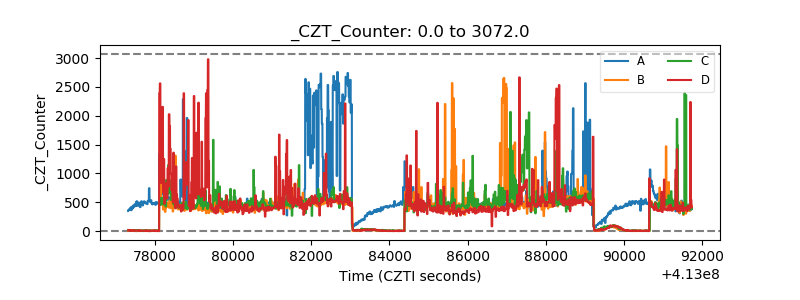 |
| +2.5 Volts monitor | 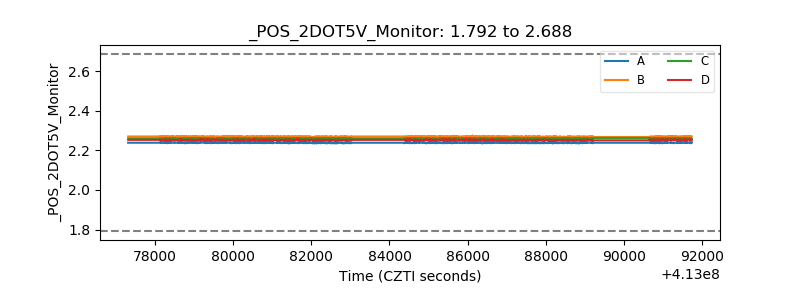 |
| +5 Volts monitor | 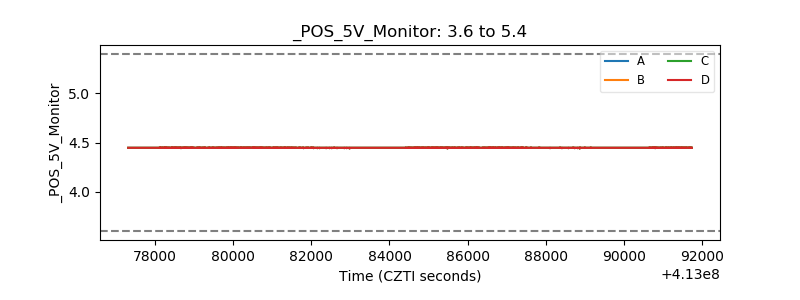 |
| _ROLL_ROT | 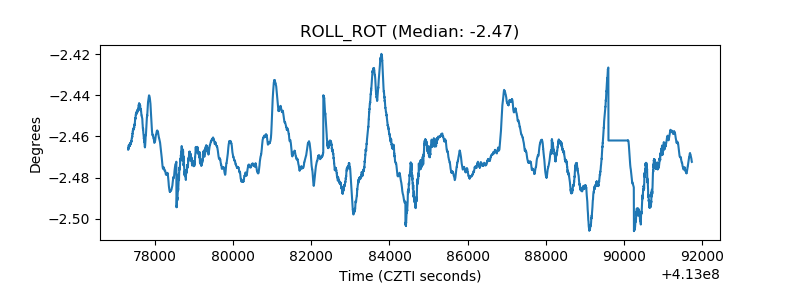 |
| _Roll_DEC | 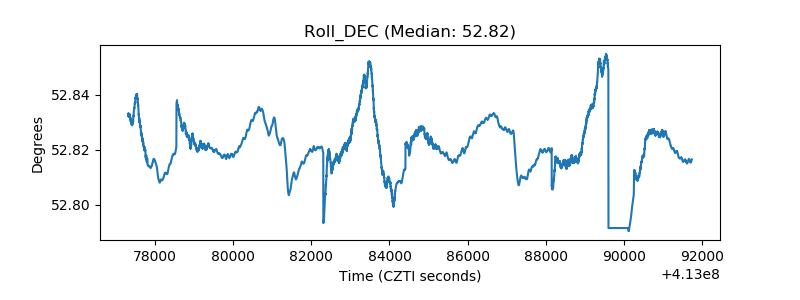 |
| _Roll_RA | 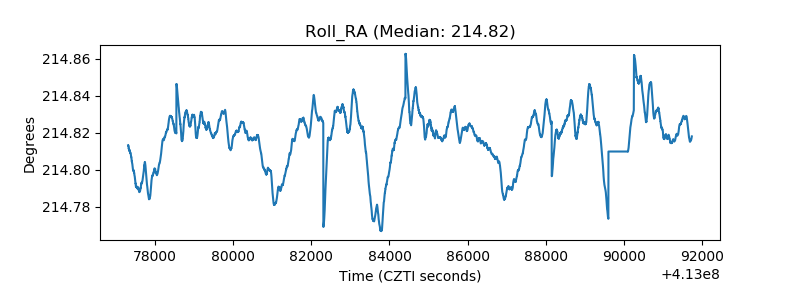 |
| Veto Counter | 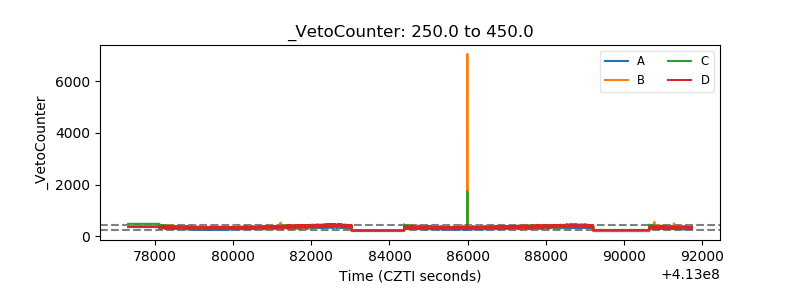 |