| Param | Original file | Final file |
|---|---|---|
| Filename | modeM0/AS1A12_022T01_9000005494_39745cztM0_level2.fits | modeM0/AS1A12_022T01_9000005494_39745cztM0_level2_quad_clean.evt |
| Size (bytes) | 337,567,680 | 91,964,160 |
| Size | 321.9 MB | 87.7 MB |
| Events in quadrant A | 3,193,454 | 614,815 |
| Events in quadrant B | 2,960,432 | 624,086 |
| Events in quadrant C | 3,111,940 | 593,180 |
| Events in quadrant D | 2,789,715 | 557,700 |
| Mode SS | |||
|---|---|---|---|
| Quadrant | BADHDUFLAG | Total packets | Discarded packets |
| A | 0 | 114 | 0 |
| B | 0 | 114 | 0 |
| C | 0 | 114 | 0 |
| D | 0 | 114 | 0 |
| Mode M0 | |||
|---|---|---|---|
| Quadrant | BADHDUFLAG | Total packets | Discarded packets |
| A | 0 | 13032 | 3 |
| B | 0 | 12689 | 4 |
| C | 0 | 12901 | 24 |
| D | 0 | 12382 | 6 |
| Mode M9 | |||
|---|---|---|---|
| Quadrant | BADHDUFLAG | Total packets | Discarded packets |
| A | 0 | 28 | 0 |
| B | 0 | 28 | 0 |
| C | 0 | 28 | 0 |
| D | 0 | 29 | 0 |
| Quadrant | Total seconds | Saturated seconds | Saturation percentage |
|---|---|---|---|
| A | 5650 | 85 | 1.504425% |
| B | 5649 | 136 | 2.407506% |
| C | 5644 | 96 | 1.700921% |
| D | 5647 | 30 | 0.531256% |
Noise dominated data is calculated using 1-second bins in cleaned event files. If a bin has >2000 counts, and if more than 50% of those come from <1% of pixels, then it is considered to be noise-dominated and hence unusable.
| Quadrant | # 1 sec bins | Bins with >0 counts | Bins with >2000 counts | High rate bins dominated by noise | Noise dominated (total time) | Noise dominated (detector-on time) | Marked lightcurve |
|---|---|---|---|---|---|---|---|
| A | 7204 | 5652 | 54 | 54 | 0.75% | 0.96% | 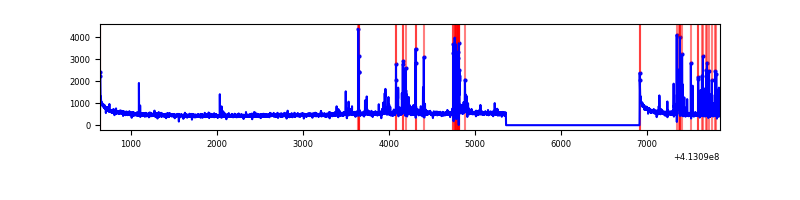 |
| B | 7204 | 5651 | 93 | 93 | 1.29% | 1.65% | 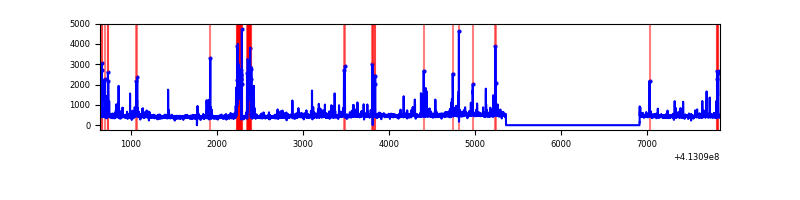 |
| C | 7204 | 5649 | 99 | 99 | 1.37% | 1.75% | 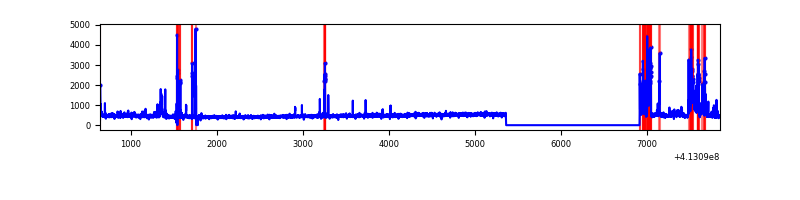 |
| D | 7204 | 5651 | 33 | 33 | 0.46% | 0.58% | 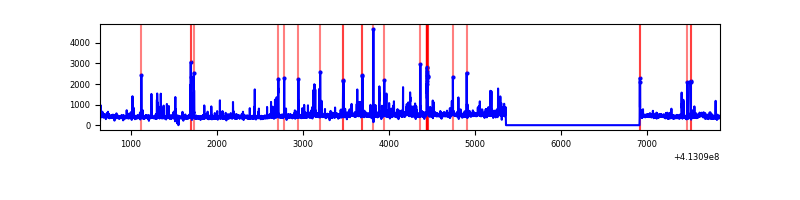 |
Top three noisy pixels from each quadrant. If the there are fewer than three noisy pixels in the level2.evt file, extra rows are filled as -1
| Pixel properties | Quadrant properties | ||||||
|---|---|---|---|---|---|---|---|
| Quadrant | DetID | PixID | Counts | Sigma | Mean | Median | Sigma |
| A | 10 | 83 | 466535 | 3738.05 | 610 | 598 | 124.6 |
| A | 15 | 174 | 175008 | 1399.23 | 610 | 598 | 124.6 |
| A | 9 | 143 | 98058 | 781.89 | 610 | 598 | 124.6 |
| B | 5 | 255 | 402649 | 3464.57 | 604 | 587 | 116.0 |
| B | 5 | 172 | 115698 | 991.91 | 604 | 587 | 116.0 |
| B | 0 | 190 | 28235 | 238.24 | 604 | 587 | 116.0 |
| C | 9 | 187 | 291194 | 2098.42 | 592 | 594 | 138.5 |
| C | 15 | 214 | 231302 | 1665.94 | 592 | 594 | 138.5 |
| C | 4 | 0 | 231105 | 1664.52 | 592 | 594 | 138.5 |
| D | 12 | 227 | 257573 | 1757.53 | 596 | 578 | 146.2 |
| D | 2 | 250 | 70164 | 475.88 | 596 | 578 | 146.2 |
| D | 12 | 218 | 38892 | 262.02 | 596 | 578 | 146.2 |
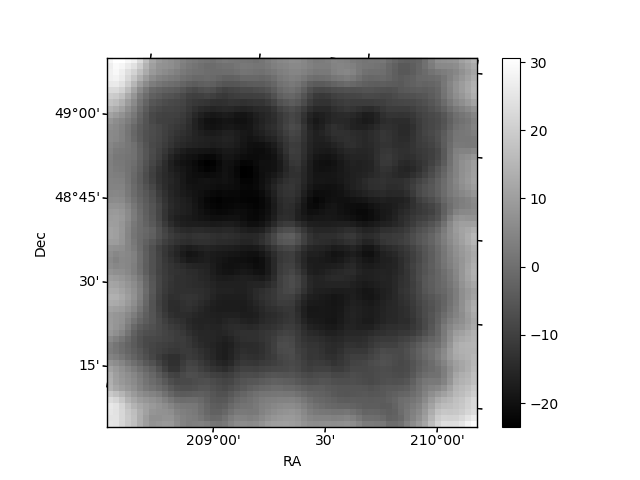
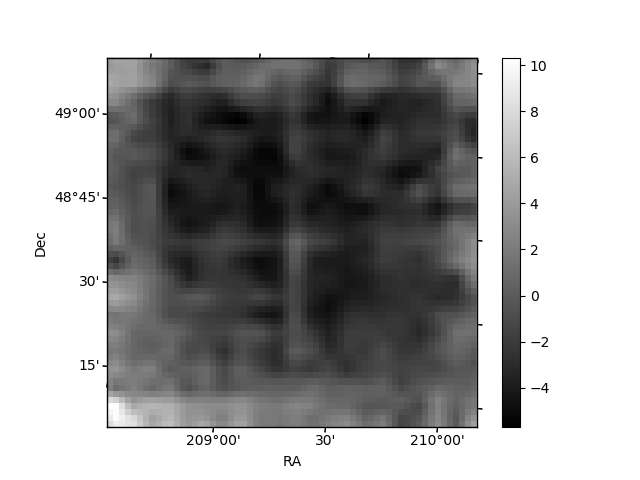
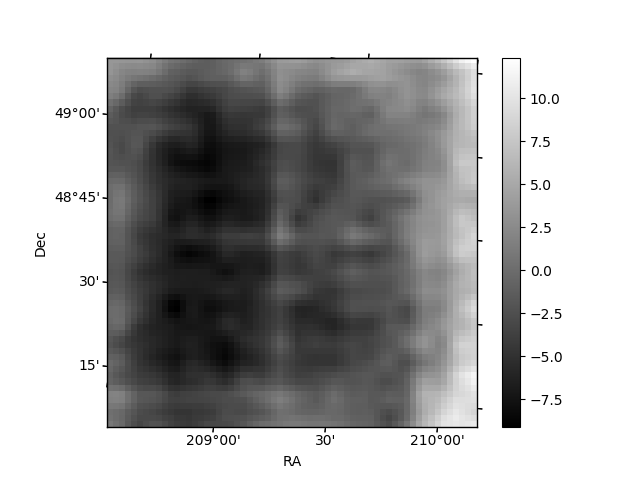
Histogram calculated using DETX and DETY for each event in the final _common_clean file
| Quadrant A | 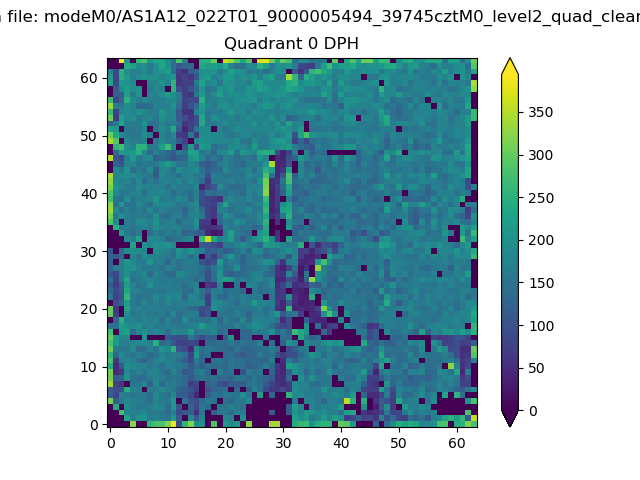 |
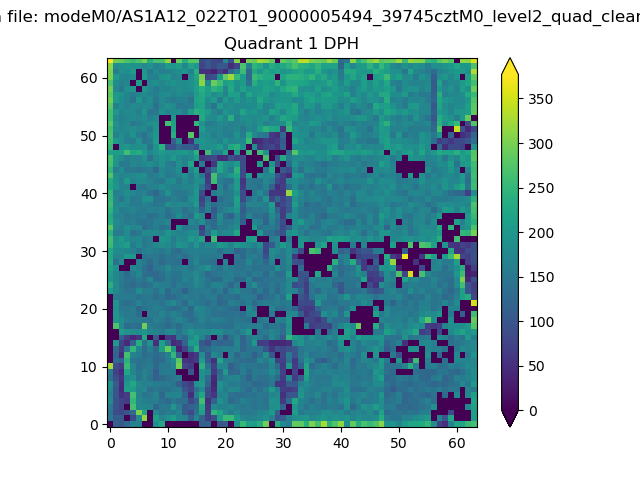 |
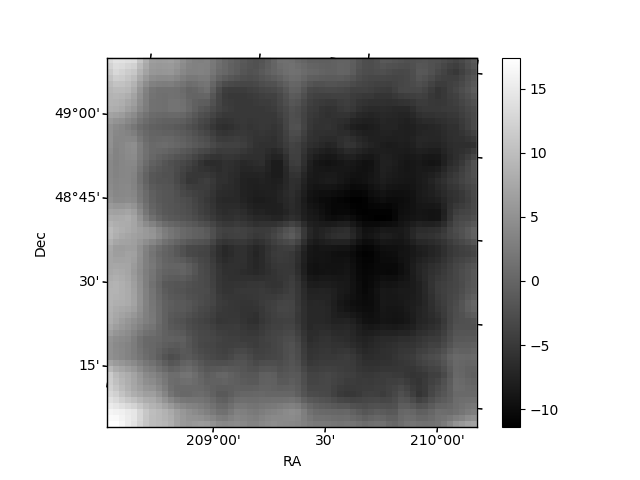
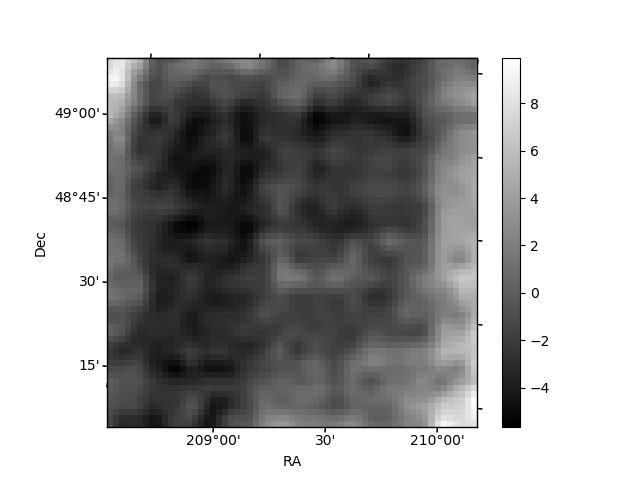
Quadrant B |
|---|---|---|---|
| Quadrant D | 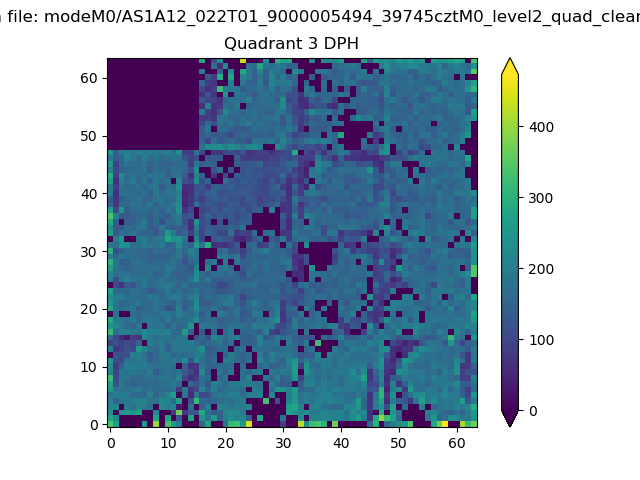 |
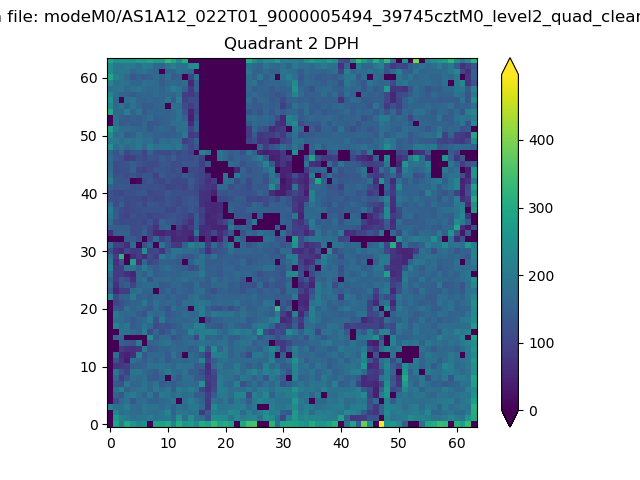 |
Quadrant C |
| Plot type | Count rate plots | Images |
|---|---|---|
| Comparison with Poisson distribution Blue bars denote a histogram of data divided into 1 sec bins. Red curve is a Poisson curve with rate = median count rate of data. |
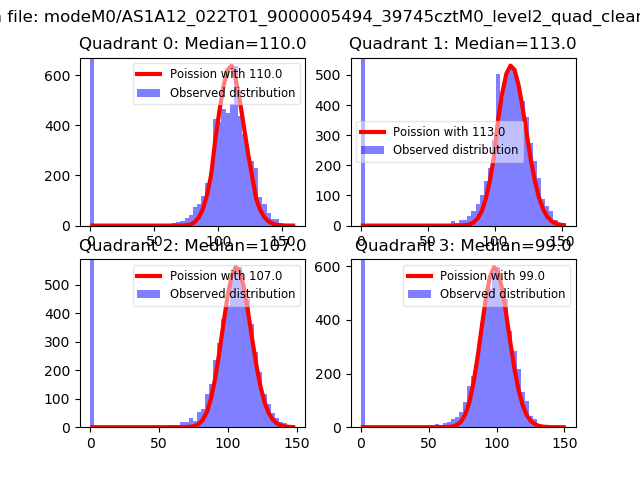 |
 |
| Quadrant-wise count rates Data is divided into 100 sec bins |
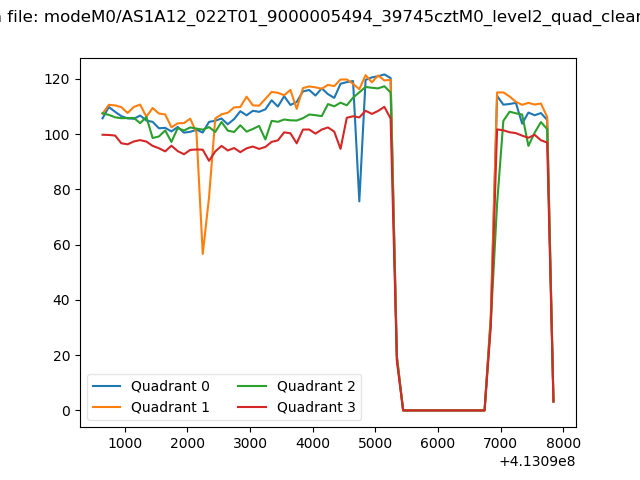 |
|
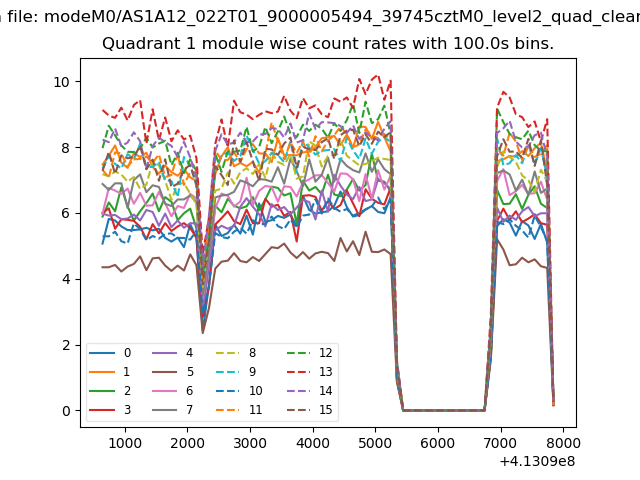
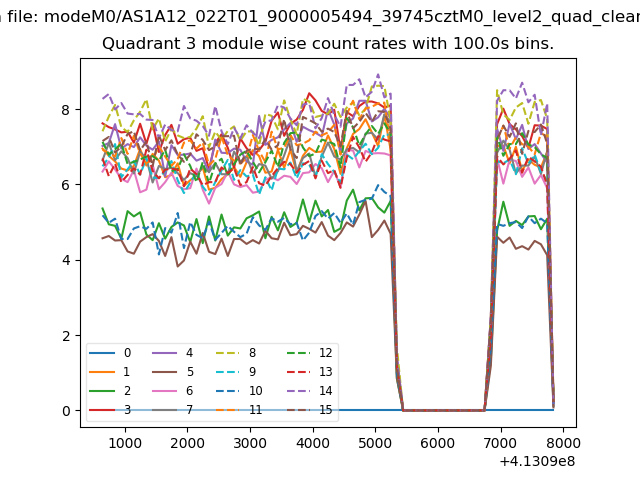
| Module-wise count rates for Quadrant A Data is divided into 100 sec bins |
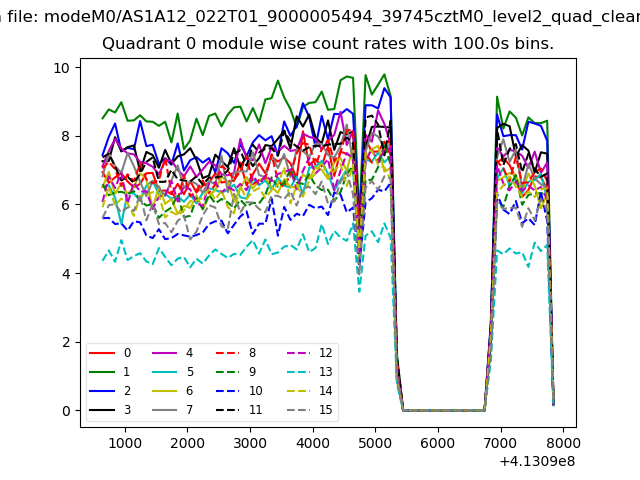 |
 |
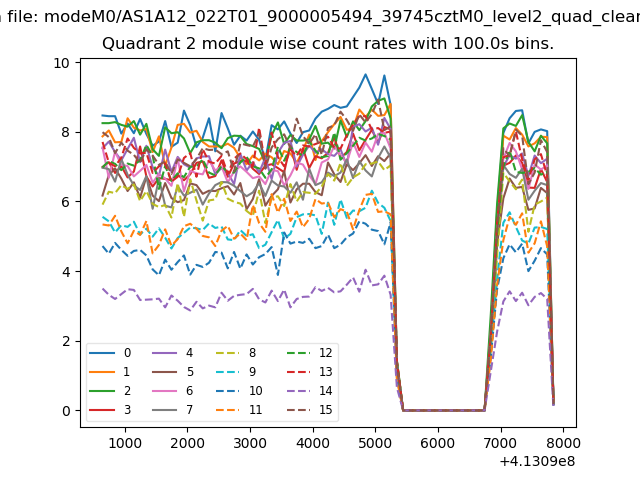
| Module-wise count rates for Quadrant B Data is divided into 100 sec bins |
 |
 |
| Module-wise count rates for Quadrant C Data is divided into 100 sec bins |
 |
 |
| Module-wise count rates for Quadrant D Data is divided into 100 sec bins |
 |
 |
| Parameter | Plot |
|---|---|
| CZT HV Monitor | 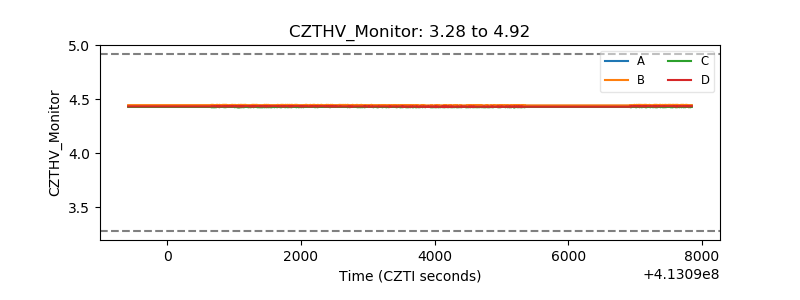 |
| D_VDD | 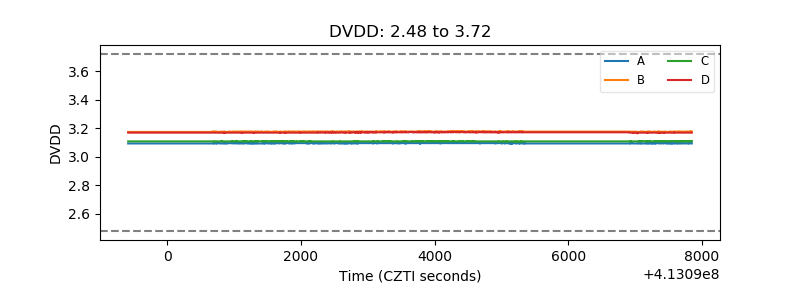 |
| Temperature 1 | 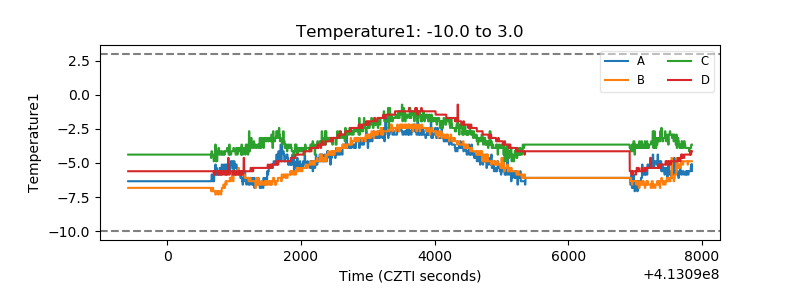 |
| Veto HV Monitor | 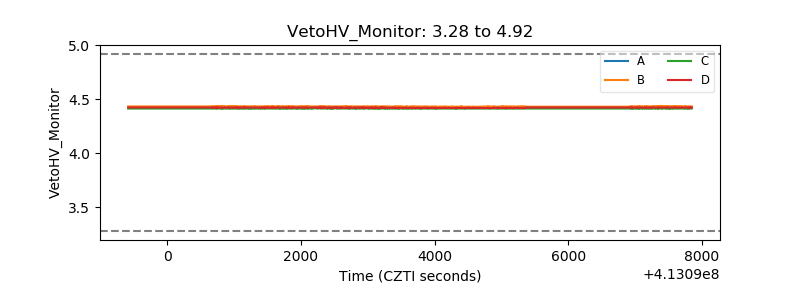 |
| Veto LLD | 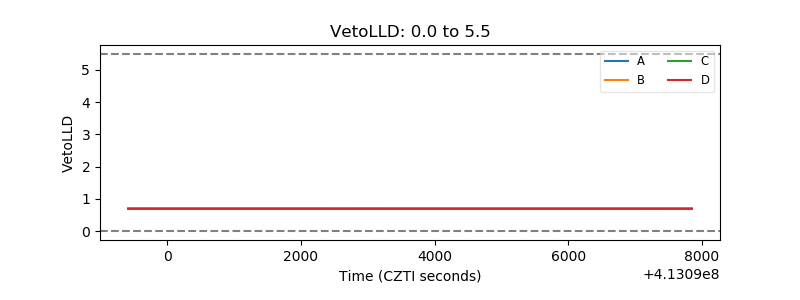 |
| Alpha Counter | 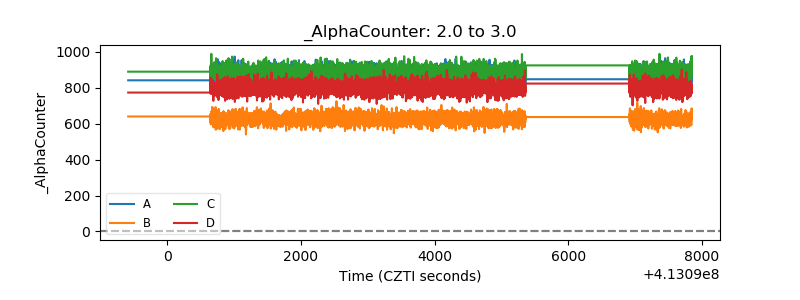 |
| _CPM_Rate | 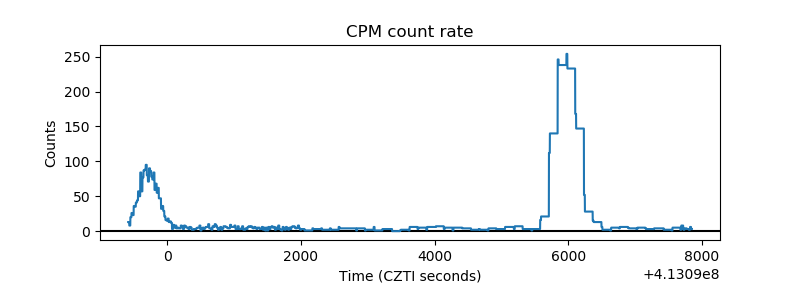 |
| CZT Counter | 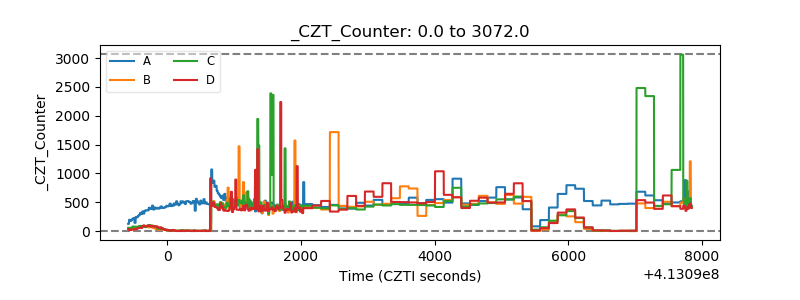 |
| +2.5 Volts monitor | 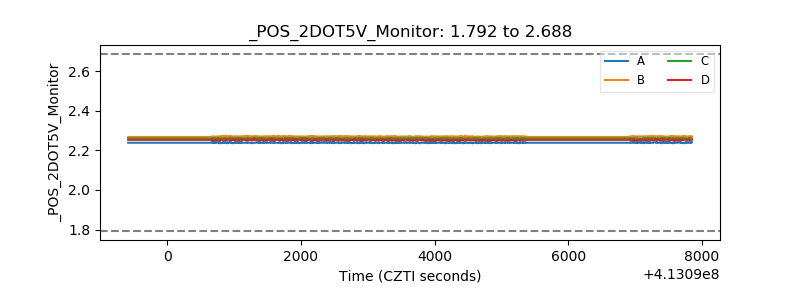 |
| +5 Volts monitor |  |
| _ROLL_ROT | 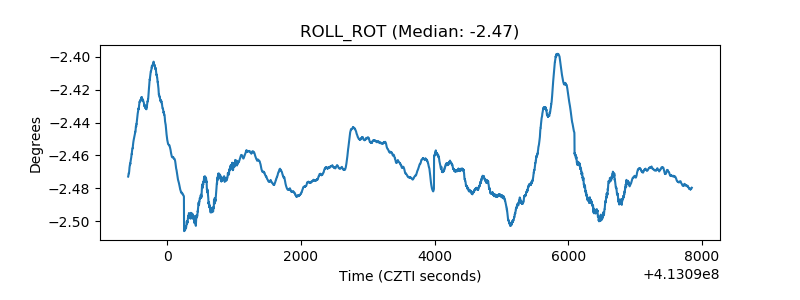 |
| _Roll_DEC | 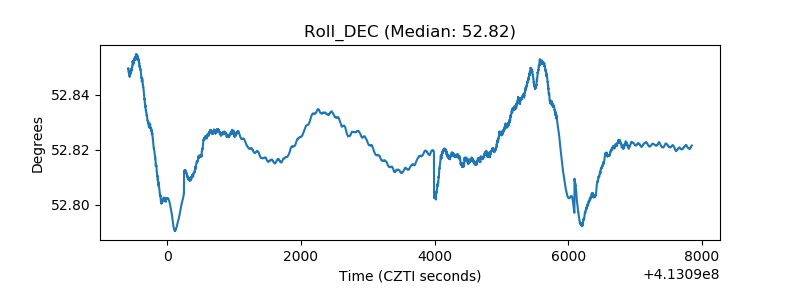 |
| _Roll_RA | 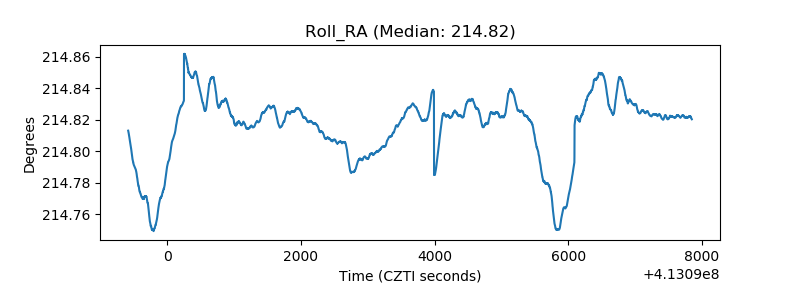 |
| Veto Counter | 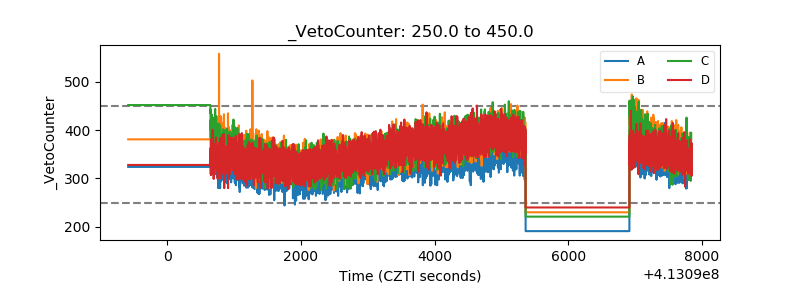 |