| Param | Original file | Final file |
|---|---|---|
| Filename | modeM0/AS1A12_022T01_9000005494_39746cztM0_level2.fits | modeM0/AS1A12_022T01_9000005494_39746cztM0_level2_quad_clean.evt |
| Size (bytes) | 345,977,280 | 91,549,440 |
| Size | 329.9 MB | 87.3 MB |
| Events in quadrant A | 3,110,204 | 614,324 |
| Events in quadrant B | 2,644,320 | 633,296 |
| Events in quadrant C | 3,152,220 | 594,132 |
| Events in quadrant D | 3,468,005 | 542,300 |
| Mode SS | |||
|---|---|---|---|
| Quadrant | BADHDUFLAG | Total packets | Discarded packets |
| A | 0 | 112 | 0 |
| B | 0 | 112 | 0 |
| C | 0 | 112 | 0 |
| D | 0 | 112 | 0 |
| Mode M0 | |||
|---|---|---|---|
| Quadrant | BADHDUFLAG | Total packets | Discarded packets |
| A | 0 | 12624 | 2 |
| B | 0 | 11644 | 1 |
| C | 0 | 12815 | 1 |
| D | 0 | 14261 | 1 |
| Mode M9 | |||
|---|---|---|---|
| Quadrant | BADHDUFLAG | Total packets | Discarded packets |
| A | 0 | 18 | 0 |
| B | 0 | 18 | 0 |
| C | 0 | 18 | 0 |
| D | 0 | 19 | 0 |
| Quadrant | Total seconds | Saturated seconds | Saturation percentage |
|---|---|---|---|
| A | 5548 | 62 | 1.117520% |
| B | 5548 | 37 | 0.666907% |
| C | 5548 | 77 | 1.387888% |
| D | 5548 | 202 | 3.640952% |
Noise dominated data is calculated using 1-second bins in cleaned event files. If a bin has >2000 counts, and if more than 50% of those come from <1% of pixels, then it is considered to be noise-dominated and hence unusable.
| Quadrant | # 1 sec bins | Bins with >0 counts | Bins with >2000 counts | High rate bins dominated by noise | Noise dominated (total time) | Noise dominated (detector-on time) | Marked lightcurve |
|---|---|---|---|---|---|---|---|
| A | 7220 | 5549 | 44 | 44 | 0.61% | 0.79% | 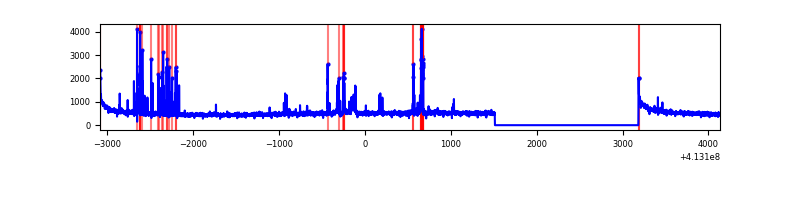 |
| B | 7220 | 5549 | 21 | 21 | 0.29% | 0.38% | 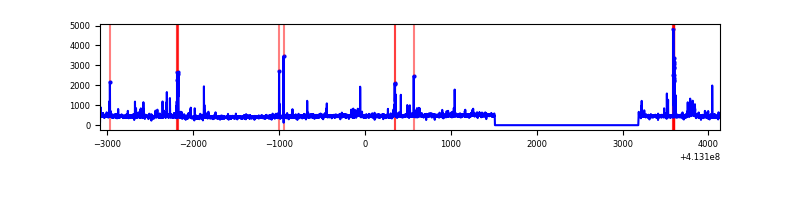 |
| C | 7220 | 5549 | 80 | 80 | 1.11% | 1.44% | 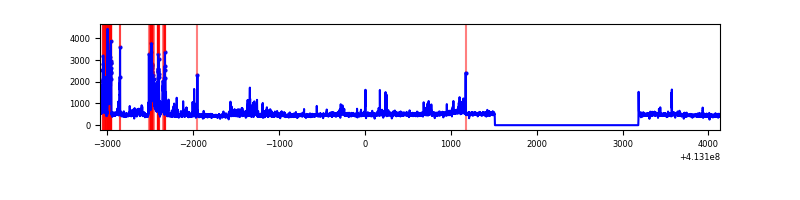 |
| D | 7220 | 5549 | 155 | 155 | 2.15% | 2.79% | 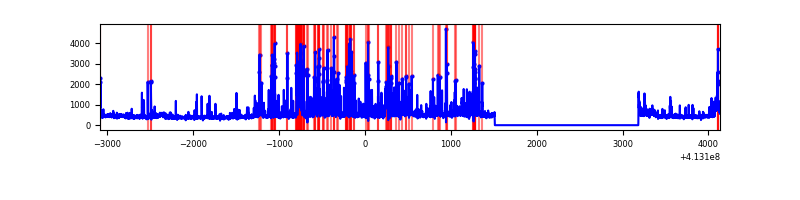 |
Top three noisy pixels from each quadrant. If the there are fewer than three noisy pixels in the level2.evt file, extra rows are filled as -1
| Pixel properties | Quadrant properties | ||||||
|---|---|---|---|---|---|---|---|
| Quadrant | DetID | PixID | Counts | Sigma | Mean | Median | Sigma |
| A | 10 | 83 | 457098 | 3695.76 | 610 | 597 | 123.5 |
| A | 15 | 174 | 144757 | 1167.1 | 610 | 597 | 123.5 |
| A | 6 | 10 | 74203 | 595.9 | 610 | 597 | 123.5 |
| B | 5 | 172 | 89516 | 756.89 | 604 | 588 | 117.5 |
| B | 5 | 255 | 87253 | 737.62 | 604 | 588 | 117.5 |
| B | 0 | 190 | 36674 | 307.14 | 604 | 588 | 117.5 |
| C | 9 | 187 | 398287 | 2878.33 | 588 | 591 | 138.2 |
| C | 15 | 214 | 229299 | 1655.28 | 588 | 591 | 138.2 |
| C | 4 | 0 | 147357 | 1062.22 | 588 | 591 | 138.2 |
| D | 12 | 227 | 821686 | 5728.95 | 585 | 569 | 143.3 |
| D | 12 | 233 | 149392 | 1038.34 | 585 | 569 | 143.3 |
| D | 2 | 250 | 110004 | 763.53 | 585 | 569 | 143.3 |
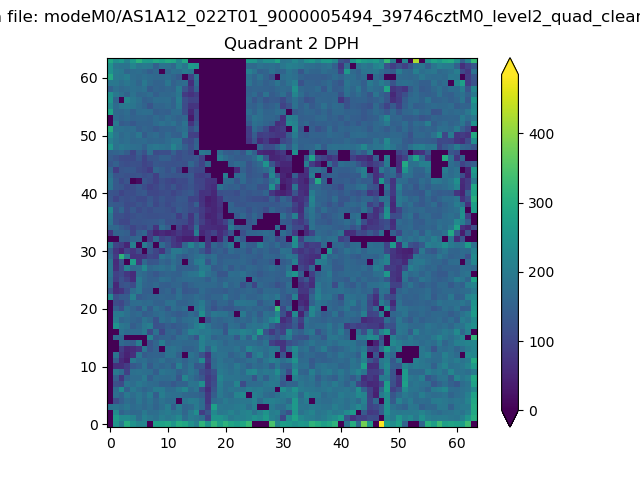
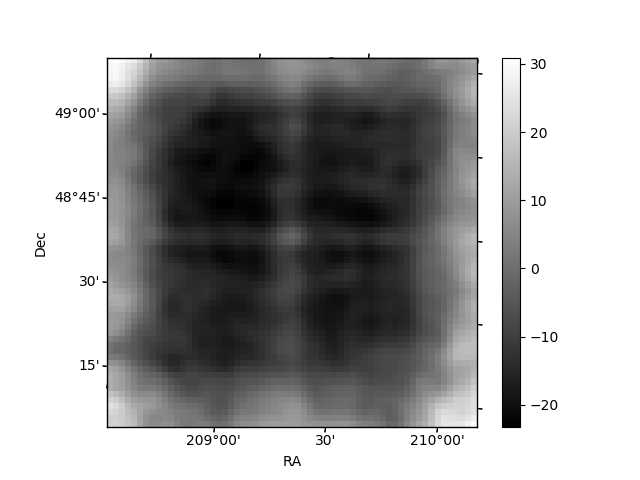
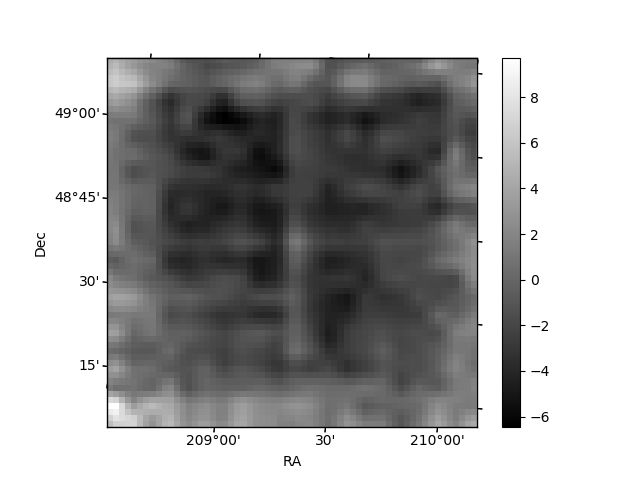
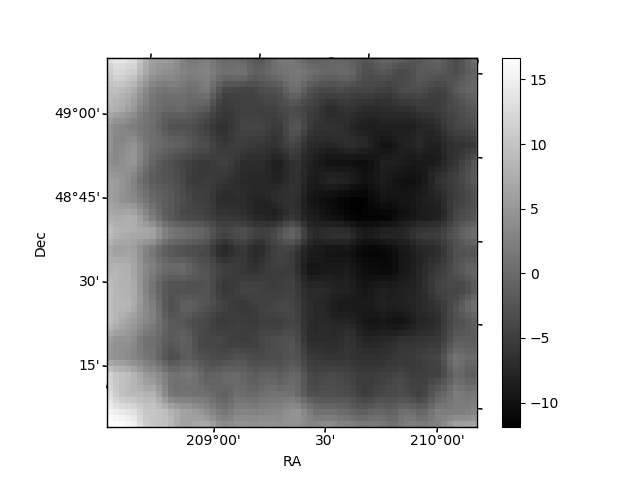
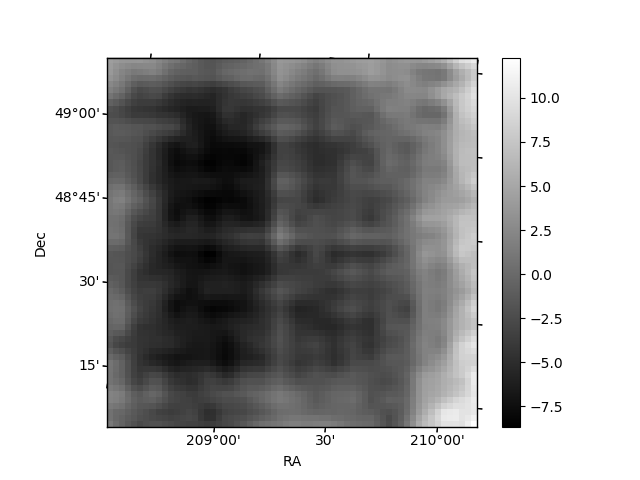
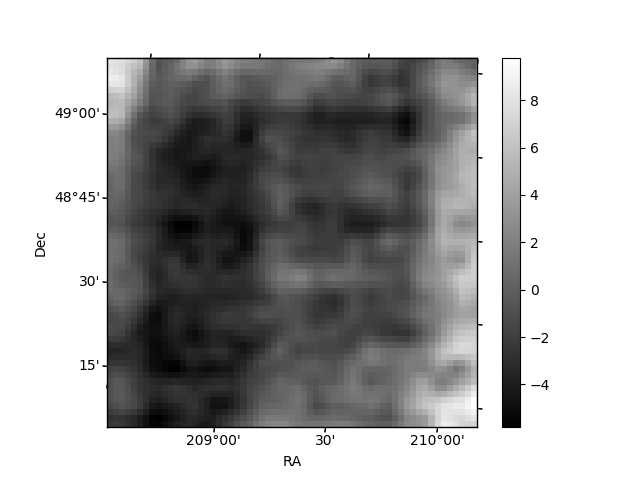
Histogram calculated using DETX and DETY for each event in the final _common_clean file
| Quadrant A | 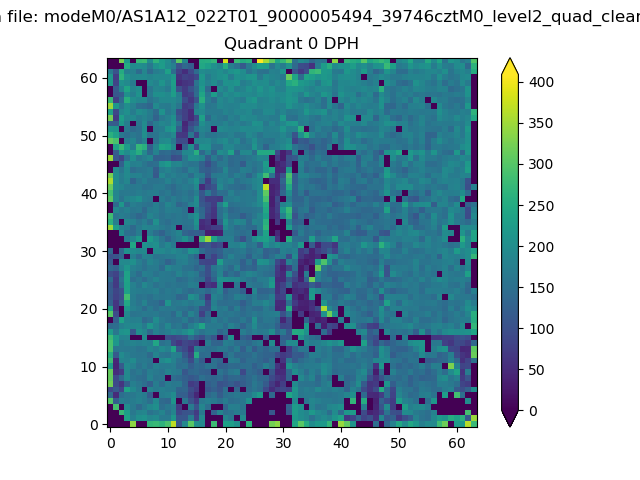 |
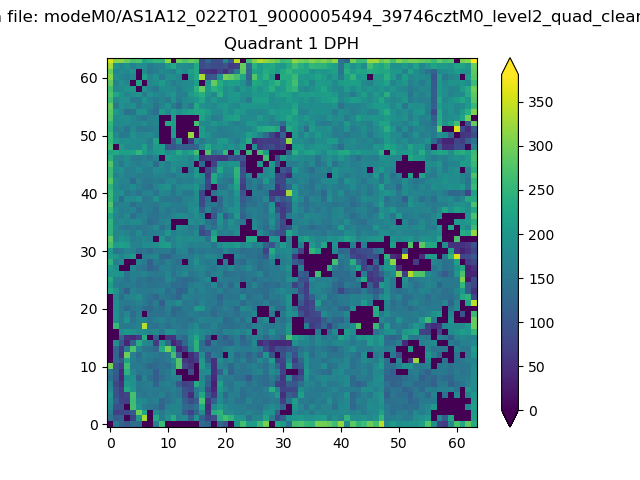 |
Quadrant B |
|---|---|---|---|
| Quadrant D | 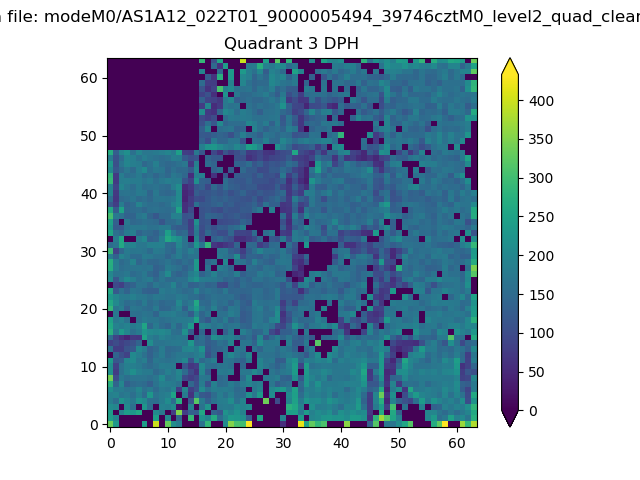 |
 |
Quadrant C |
| Plot type | Count rate plots | Images |
|---|---|---|
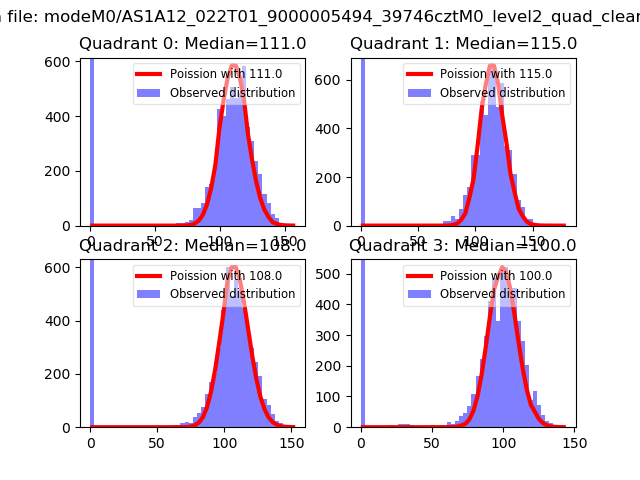
| Comparison with Poisson distribution Blue bars denote a histogram of data divided into 1 sec bins. Red curve is a Poisson curve with rate = median count rate of data. |
 |
 |
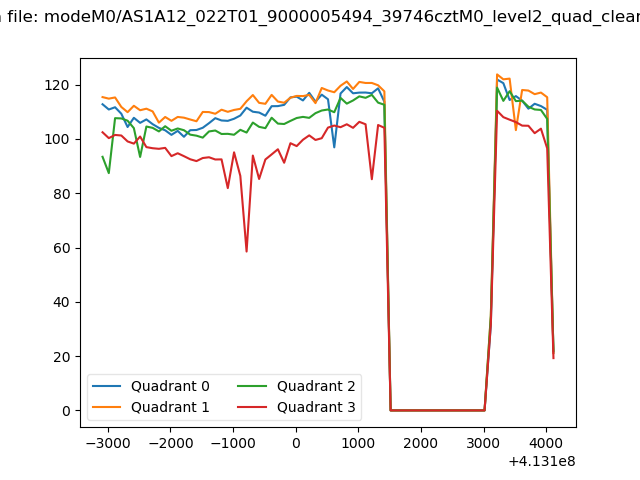
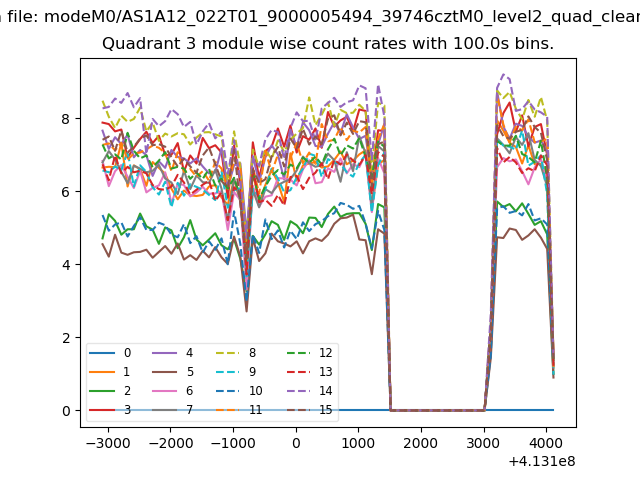
| Quadrant-wise count rates Data is divided into 100 sec bins |
 |
|
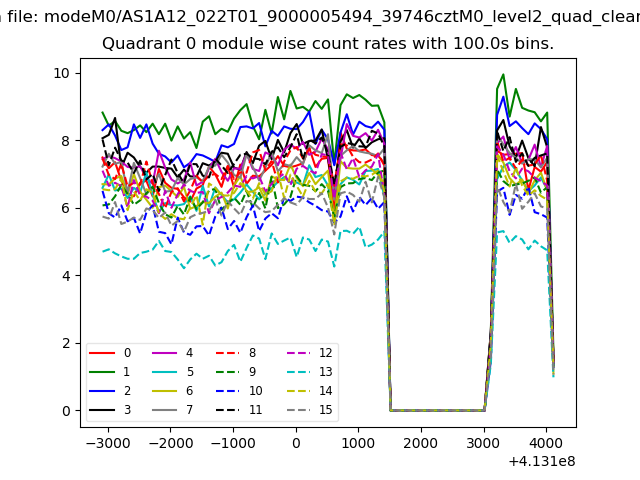
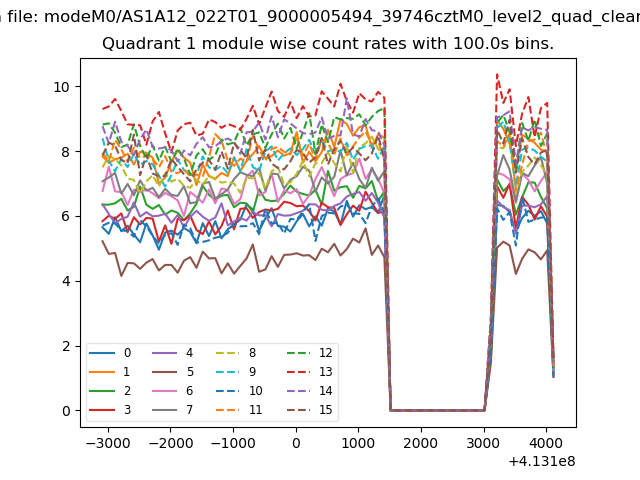
| Module-wise count rates for Quadrant A Data is divided into 100 sec bins |
 |
 |
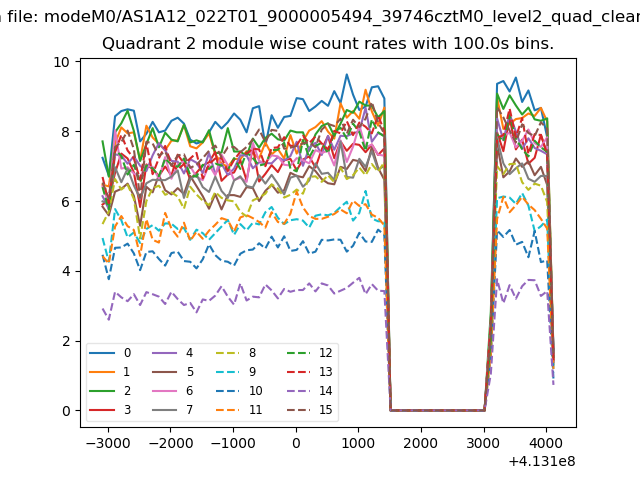
| Module-wise count rates for Quadrant B Data is divided into 100 sec bins |
 |
 |
| Module-wise count rates for Quadrant C Data is divided into 100 sec bins |
 |
 |
| Module-wise count rates for Quadrant D Data is divided into 100 sec bins |
 |
 |
| Parameter | Plot |
|---|---|
| CZT HV Monitor |  |
| D_VDD | 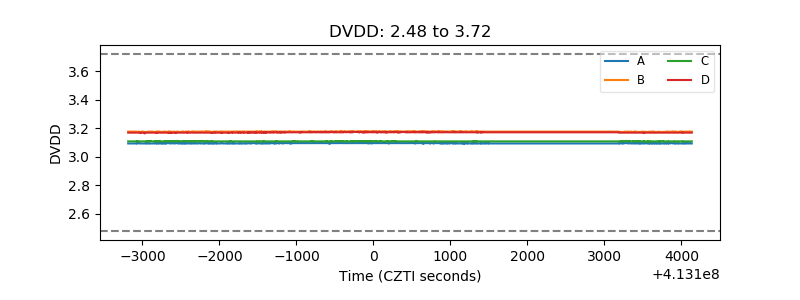 |
| Temperature 1 | 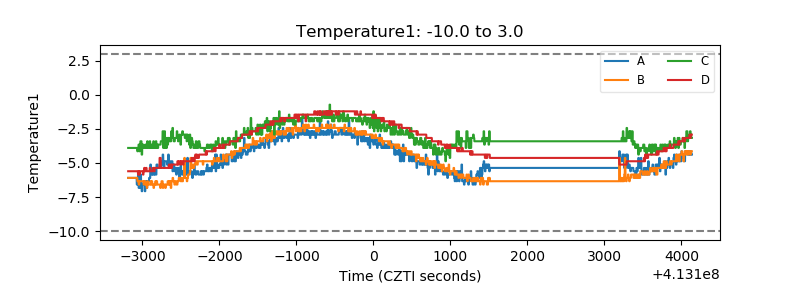 |
| Veto HV Monitor | 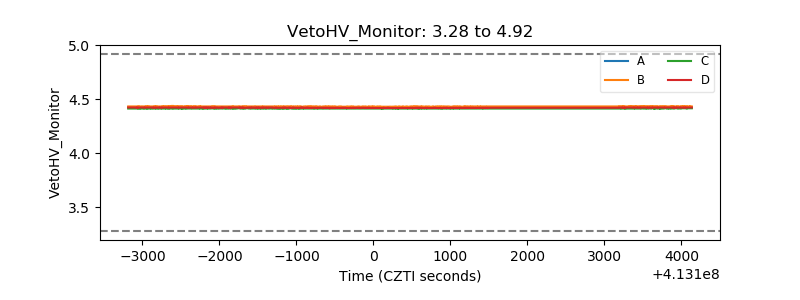 |
| Veto LLD | 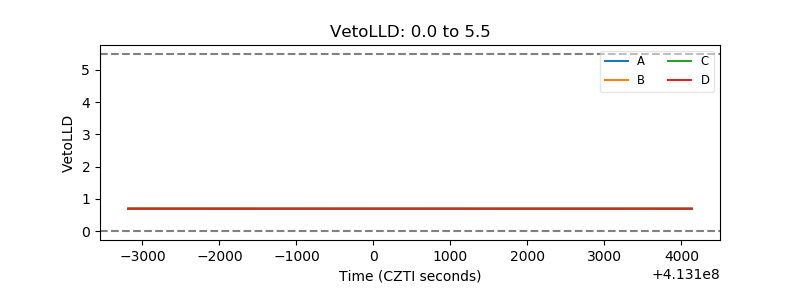 |
| Alpha Counter | 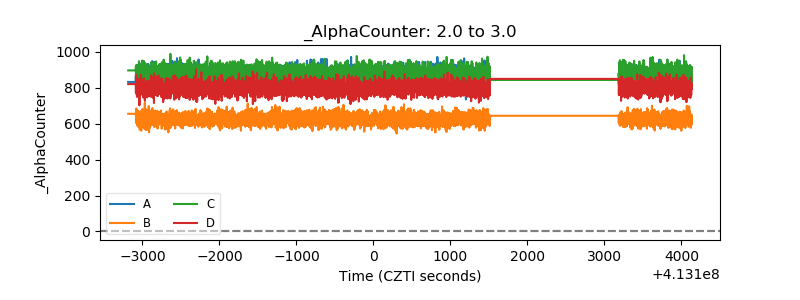 |
| _CPM_Rate | 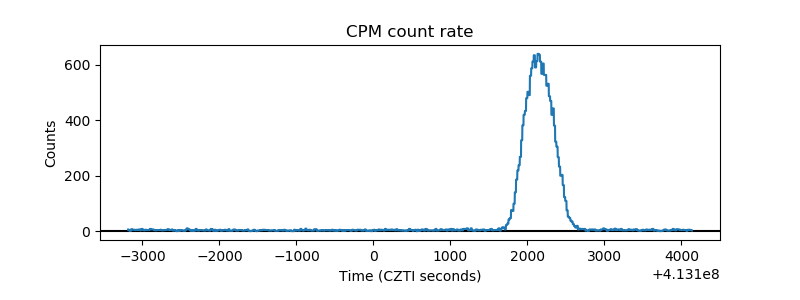 |
| CZT Counter | 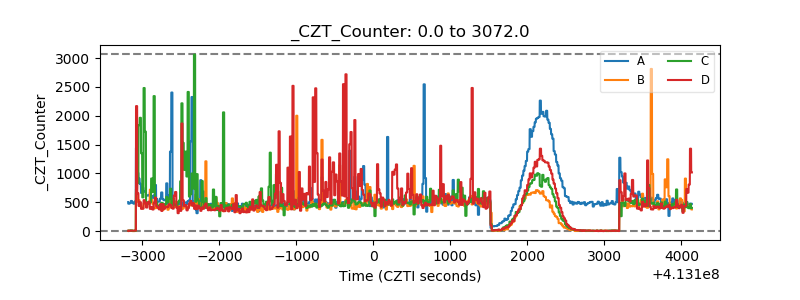 |
| +2.5 Volts monitor | 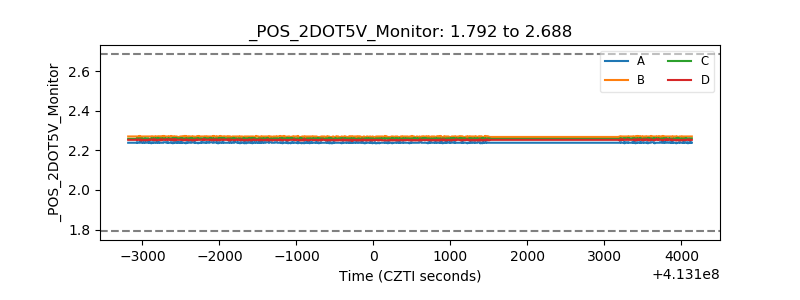 |
| +5 Volts monitor | 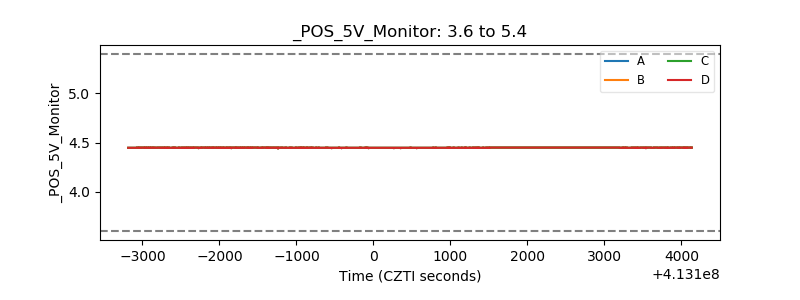 |
| _ROLL_ROT | 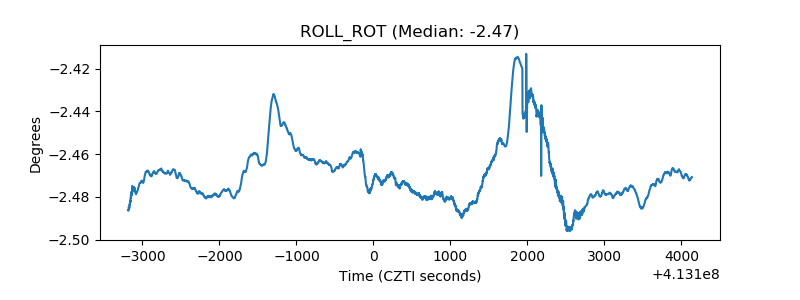 |
| _Roll_DEC | 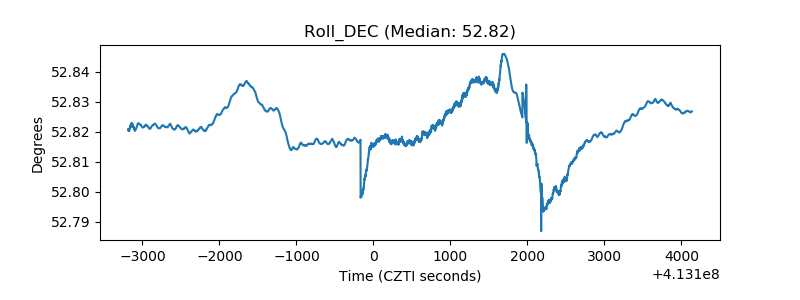 |
| _Roll_RA | 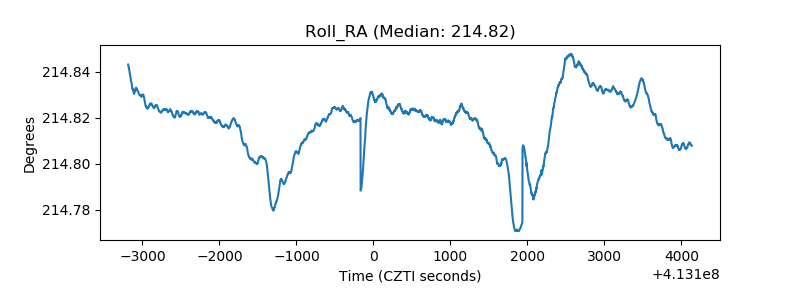 |
| Veto Counter | 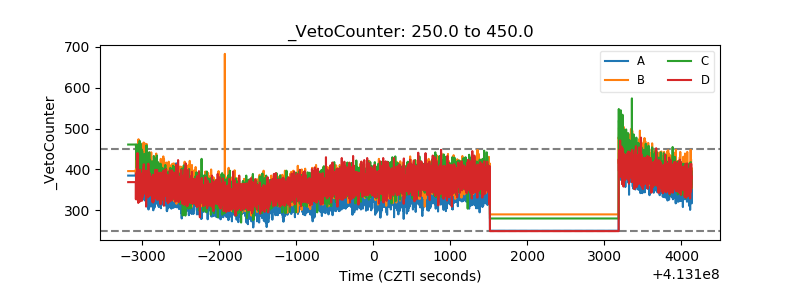 |