| Param | Original file | Final file |
|---|---|---|
| Filename | modeM0/AS1A12_022T01_9000005494_39749cztM0_level2.fits | modeM0/AS1A12_022T01_9000005494_39749cztM0_level2_quad_clean.evt |
| Size (bytes) | 345,985,920 | 93,473,280 |
| Size | 330.0 MB | 89.1 MB |
| Events in quadrant A | 3,202,438 | 644,395 |
| Events in quadrant B | 2,647,415 | 653,326 |
| Events in quadrant C | 2,819,879 | 614,898 |
| Events in quadrant D | 3,732,870 | 553,768 |
| Mode SS | |||
|---|---|---|---|
| Quadrant | BADHDUFLAG | Total packets | Discarded packets |
| A | 0 | 106 | 0 |
| B | 0 | 106 | 0 |
| C | 0 | 106 | 0 |
| D | 0 | 106 | 0 |
| Mode M0 | |||
|---|---|---|---|
| Quadrant | BADHDUFLAG | Total packets | Discarded packets |
| A | 0 | 12682 | 3 |
| B | 0 | 11145 | 2 |
| C | 0 | 11442 | 2 |
| D | 0 | 14462 | 2 |
| Mode M9 | |||
|---|---|---|---|
| Quadrant | BADHDUFLAG | Total packets | Discarded packets |
| A | 0 | 19 | 0 |
| B | 0 | 19 | 0 |
| C | 0 | 19 | 0 |
| D | 0 | 19 | 0 |
| Quadrant | Total seconds | Saturated seconds | Saturation percentage |
|---|---|---|---|
| A | 5199 | 79 | 1.519523% |
| B | 5199 | 54 | 1.038661% |
| C | 5199 | 10 | 0.192345% |
| D | 5199 | 245 | 4.712445% |
Noise dominated data is calculated using 1-second bins in cleaned event files. If a bin has >2000 counts, and if more than 50% of those come from <1% of pixels, then it is considered to be noise-dominated and hence unusable.
| Quadrant | # 1 sec bins | Bins with >0 counts | Bins with >2000 counts | High rate bins dominated by noise | Noise dominated (total time) | Noise dominated (detector-on time) | Marked lightcurve |
|---|---|---|---|---|---|---|---|
| A | 7112 | 5200 | 48 | 48 | 0.67% | 0.92% | 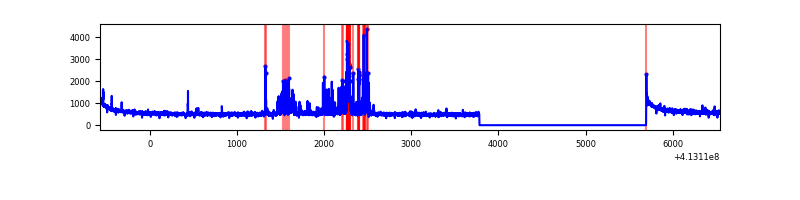 |
| B | 7112 | 5200 | 38 | 38 | 0.53% | 0.73% | 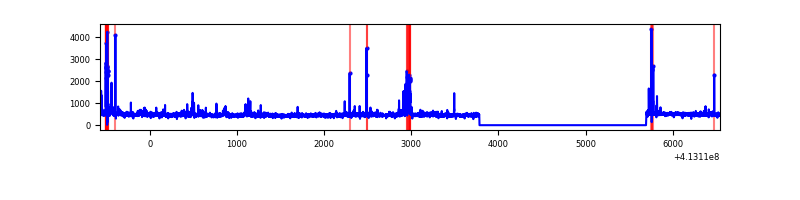 |
| C | 7112 | 5200 | 9 | 9 | 0.13% | 0.17% | 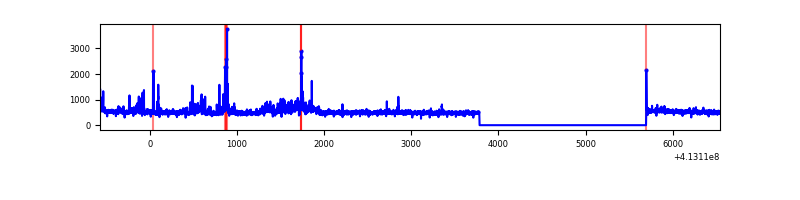 |
| D | 7112 | 5200 | 226 | 226 | 3.18% | 4.35% | 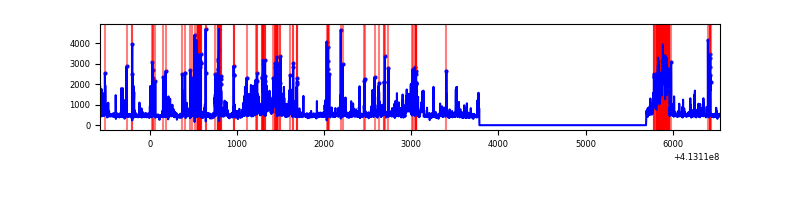 |
Top three noisy pixels from each quadrant. If the there are fewer than three noisy pixels in the level2.evt file, extra rows are filled as -1
| Pixel properties | Quadrant properties | ||||||
|---|---|---|---|---|---|---|---|
| Quadrant | DetID | PixID | Counts | Sigma | Mean | Median | Sigma |
| A | 10 | 83 | 441160 | 3574.57 | 612 | 601 | 123.2 |
| A | 13 | 248 | 274960 | 2226.07 | 612 | 601 | 123.2 |
| A | 15 | 174 | 111248 | 897.76 | 612 | 601 | 123.2 |
| B | 5 | 255 | 122602 | 1063.33 | 599 | 583 | 114.8 |
| B | 10 | 246 | 90753 | 785.78 | 599 | 583 | 114.8 |
| B | 5 | 172 | 44190 | 380.01 | 599 | 583 | 114.8 |
| C | 15 | 214 | 216309 | 1589.92 | 586 | 589 | 135.7 |
| C | 15 | 208 | 165733 | 1217.16 | 586 | 589 | 135.7 |
| C | 9 | 187 | 124183 | 910.92 | 586 | 589 | 135.7 |
| D | 12 | 227 | 591340 | 4133.07 | 585 | 568 | 142.9 |
| D | 12 | 233 | 457741 | 3198.4 | 585 | 568 | 142.9 |
| D | 2 | 153 | 92283 | 641.64 | 585 | 568 | 142.9 |
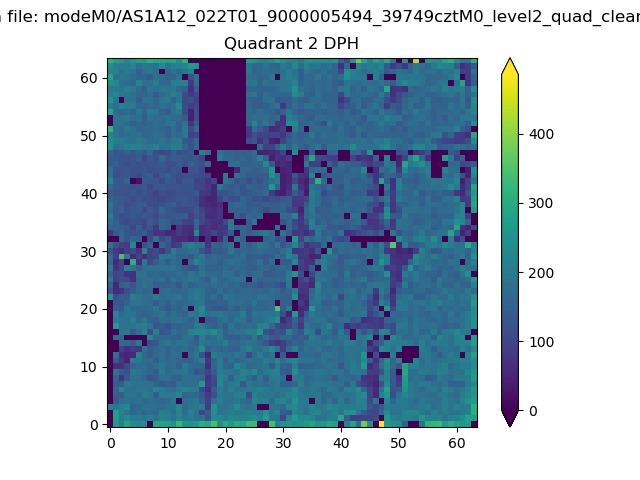
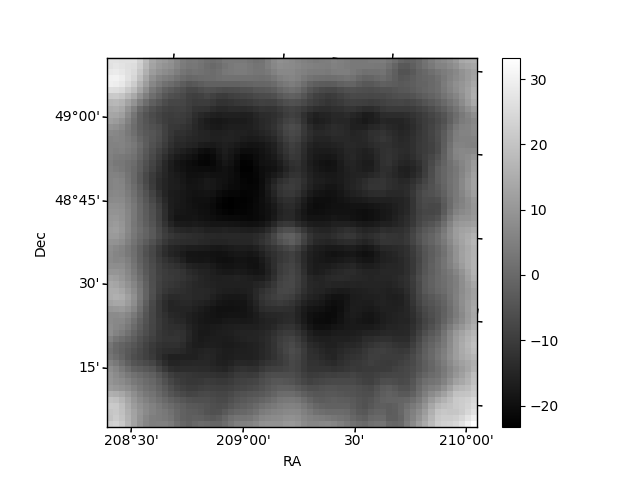
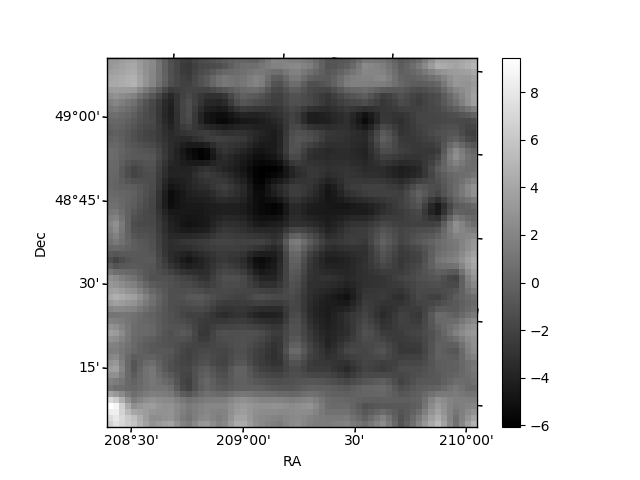
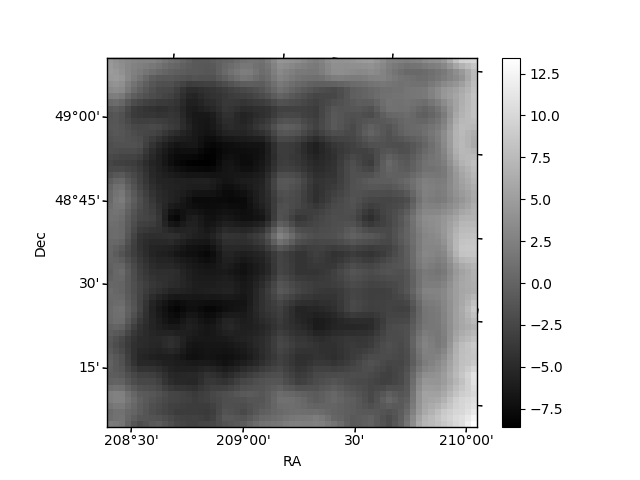
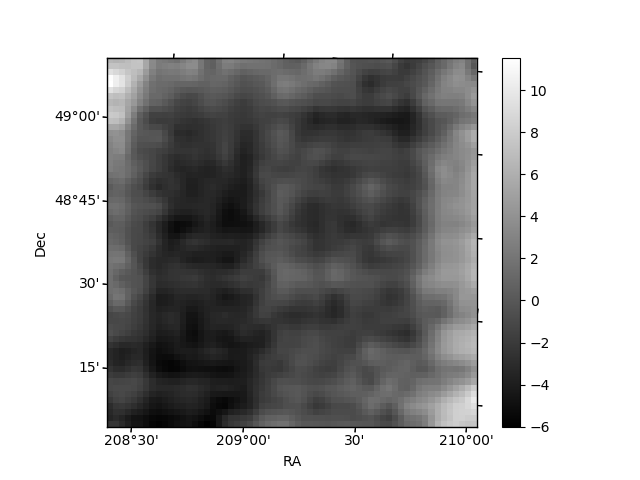
Histogram calculated using DETX and DETY for each event in the final _common_clean file
| Quadrant A | 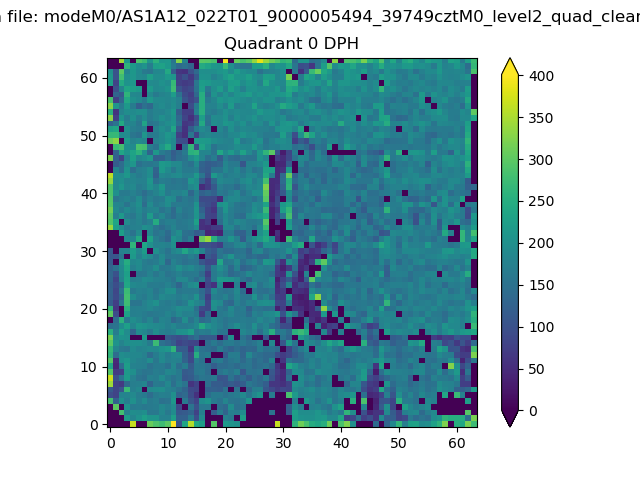 |
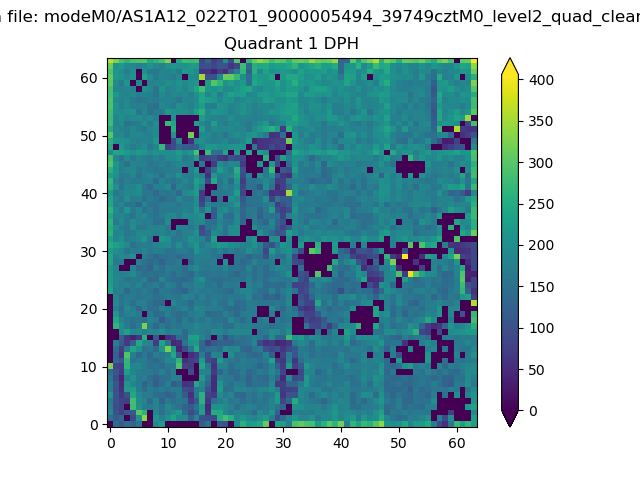 |
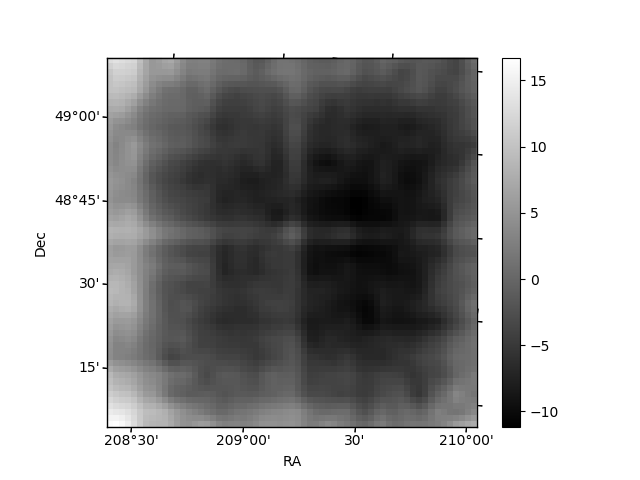
Quadrant B |
|---|---|---|---|
| Quadrant D | 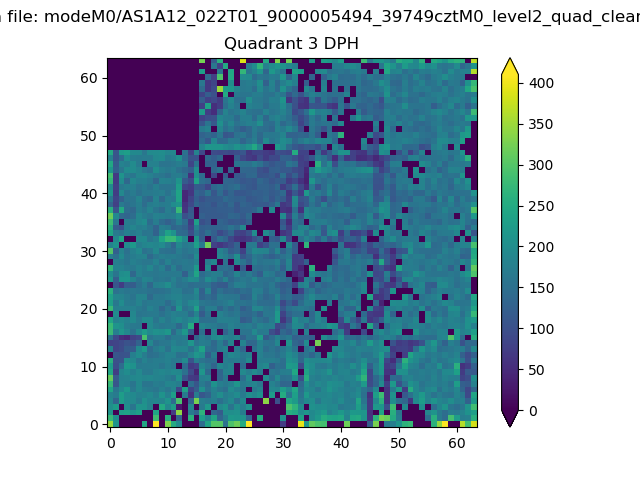 |
 |
Quadrant C |
| Plot type | Count rate plots | Images |
|---|---|---|
| Comparison with Poisson distribution Blue bars denote a histogram of data divided into 1 sec bins. Red curve is a Poisson curve with rate = median count rate of data. |
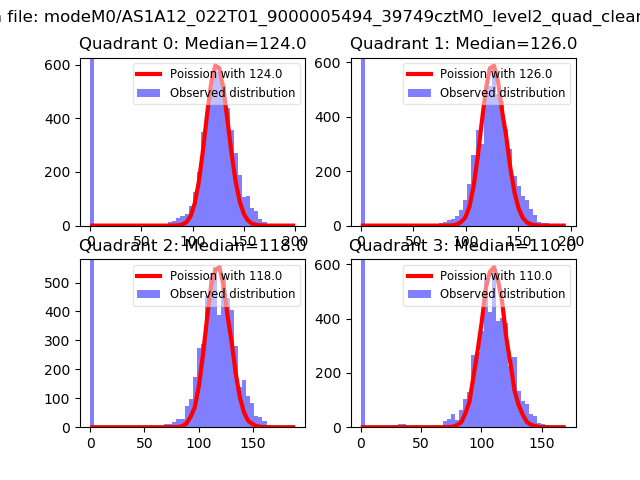 |
 |
| Quadrant-wise count rates Data is divided into 100 sec bins |
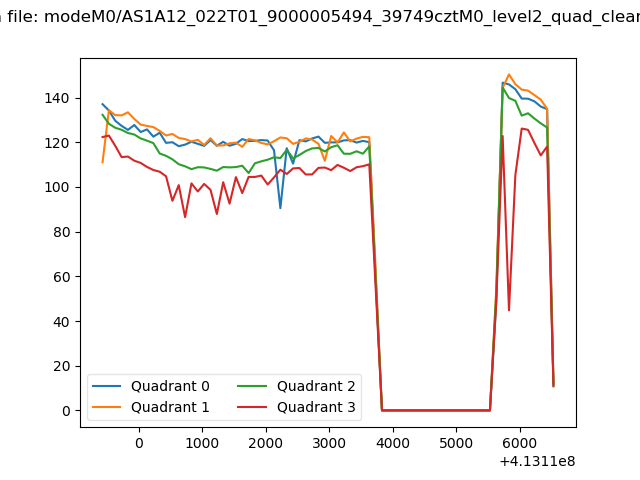 |
|
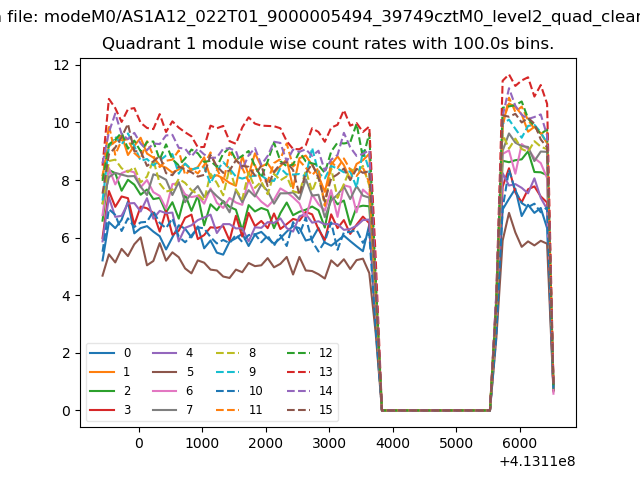
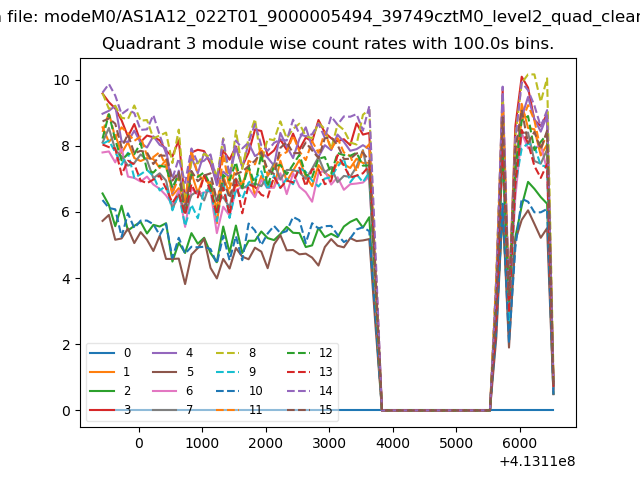
| Module-wise count rates for Quadrant A Data is divided into 100 sec bins |
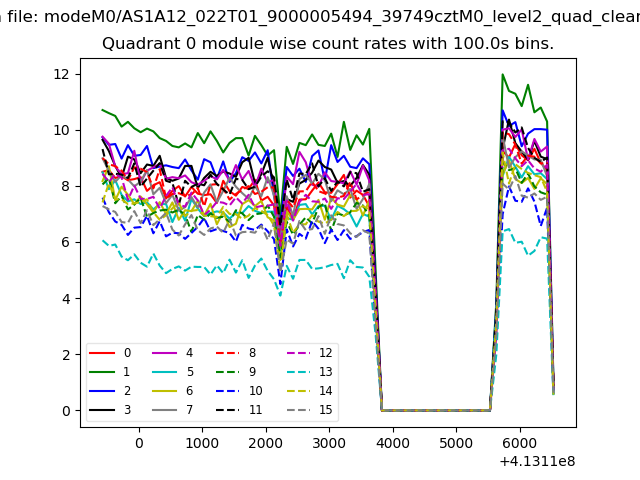 |
 |
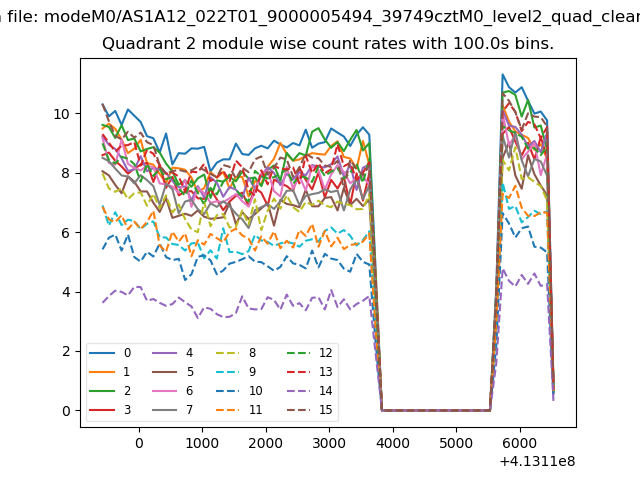
| Module-wise count rates for Quadrant B Data is divided into 100 sec bins |
 |
 |
| Module-wise count rates for Quadrant C Data is divided into 100 sec bins |
 |
 |
| Module-wise count rates for Quadrant D Data is divided into 100 sec bins |
 |
 |
| Parameter | Plot |
|---|---|
| CZT HV Monitor | 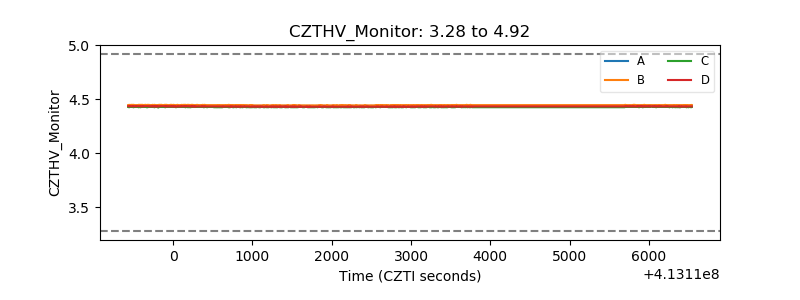 |
| D_VDD | 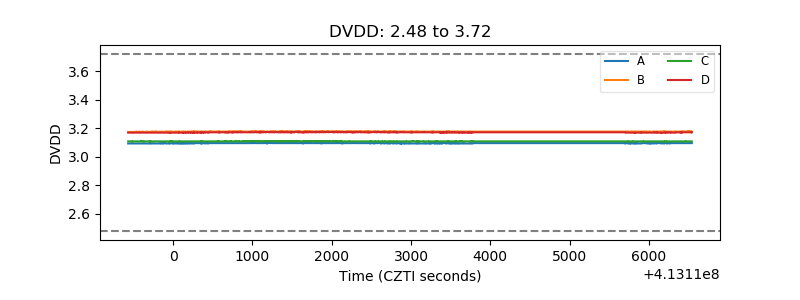 |
| Temperature 1 | 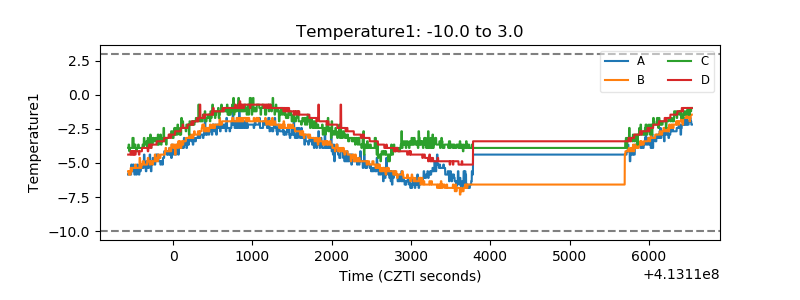 |
| Veto HV Monitor | 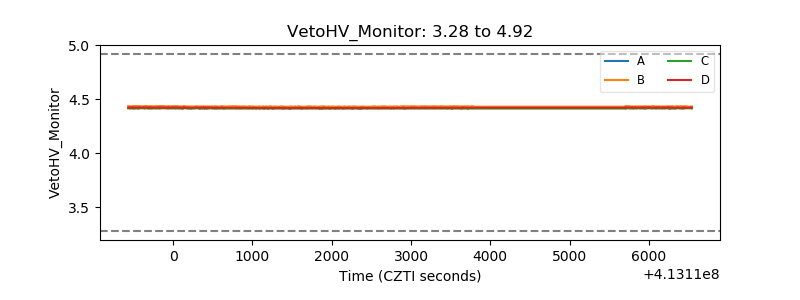 |
| Veto LLD | 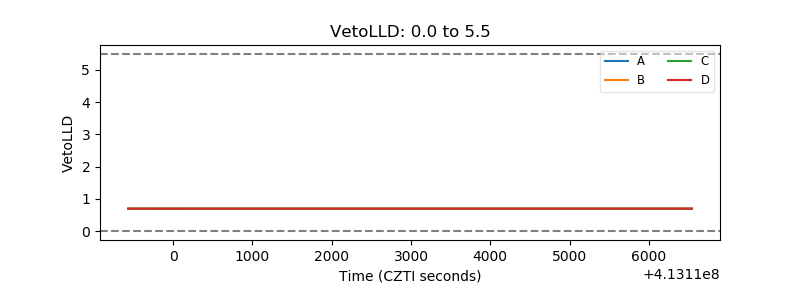 |
| Alpha Counter | 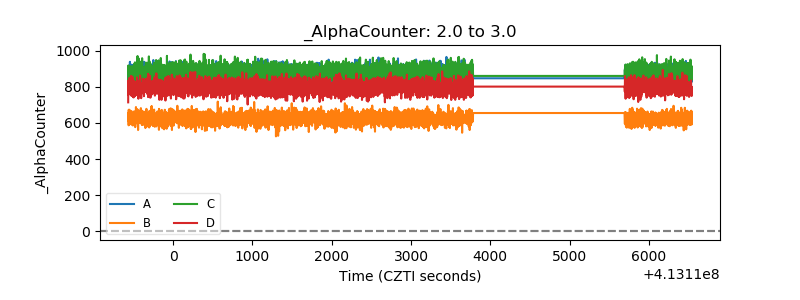 |
| _CPM_Rate | 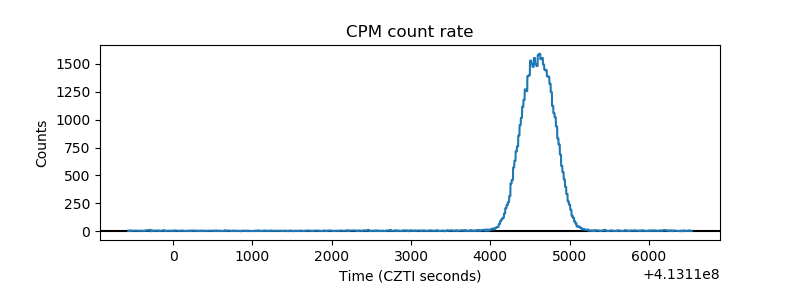 |
| CZT Counter | 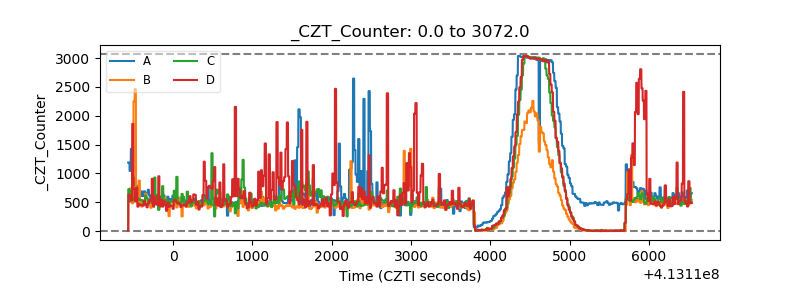 |
| +2.5 Volts monitor | 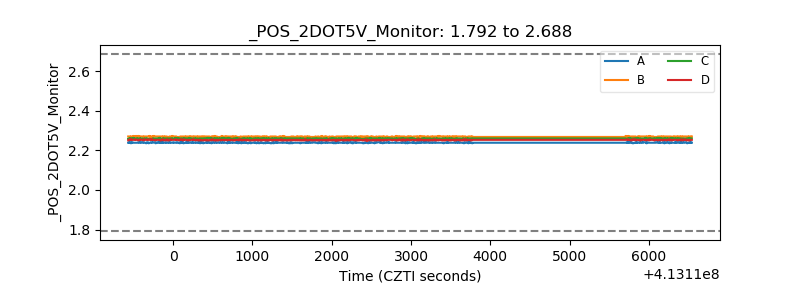 |
| +5 Volts monitor | 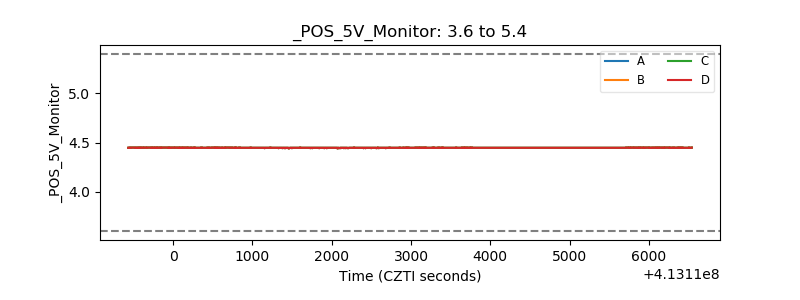 |
| _ROLL_ROT | 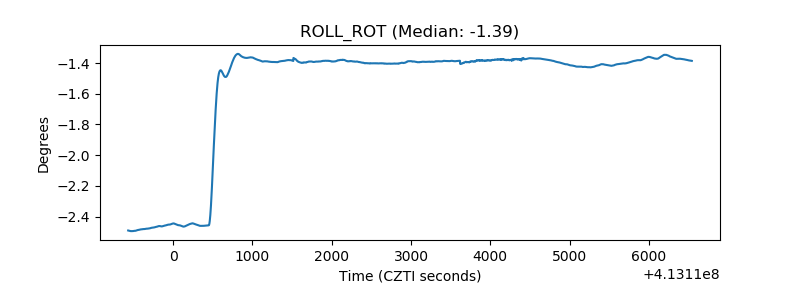 |
| _Roll_DEC | 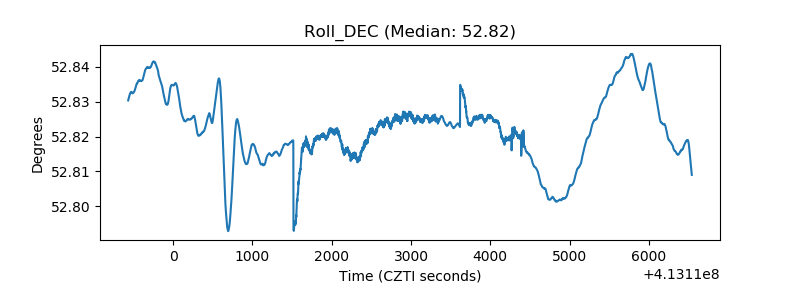 |
| _Roll_RA | 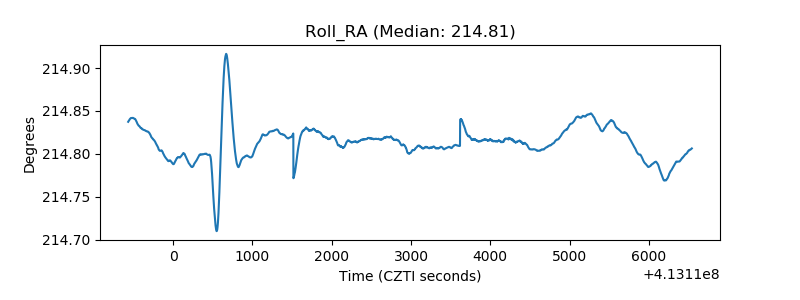 |
| Veto Counter | 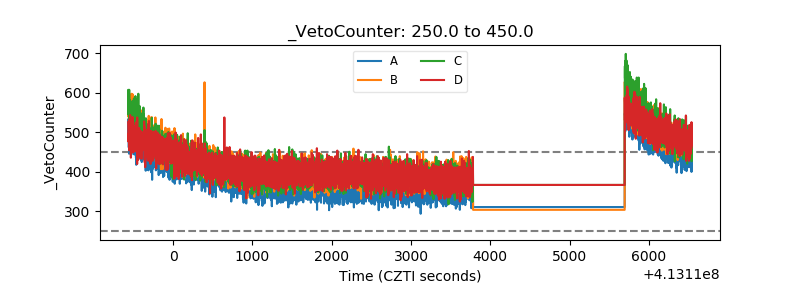 |