| Param | Original file | Final file |
|---|---|---|
| Filename | modeM0/AS1A12_022T01_9000005494_39750cztM0_level2.fits | modeM0/AS1A12_022T01_9000005494_39750cztM0_level2_quad_clean.evt |
| Size (bytes) | 352,586,880 | 98,193,600 |
| Size | 336.3 MB | 93.6 MB |
| Events in quadrant A | 3,494,500 | 682,554 |
| Events in quadrant B | 2,650,294 | 695,913 |
| Events in quadrant C | 2,759,638 | 648,011 |
| Events in quadrant D | 3,741,395 | 581,434 |
| Mode SS | |||
|---|---|---|---|
| Quadrant | BADHDUFLAG | Total packets | Discarded packets |
| A | 0 | 108 | 0 |
| B | 0 | 108 | 0 |
| C | 0 | 108 | 0 |
| D | 0 | 108 | 0 |
| Mode M0 | |||
|---|---|---|---|
| Quadrant | BADHDUFLAG | Total packets | Discarded packets |
| A | 0 | 13729 | 3 |
| B | 0 | 11027 | 2 |
| C | 0 | 11126 | 2 |
| D | 0 | 14586 | 2 |
| Mode M9 | |||
|---|---|---|---|
| Quadrant | BADHDUFLAG | Total packets | Discarded packets |
| A | 0 | 26 | 0 |
| B | 0 | 26 | 0 |
| C | 0 | 26 | 0 |
| D | 0 | 27 | 0 |
| Quadrant | Total seconds | Saturated seconds | Saturation percentage |
|---|---|---|---|
| A | 5215 | 89 | 1.706616% |
| B | 5215 | 26 | 0.498562% |
| C | 5215 | 14 | 0.268456% |
| D | 5215 | 270 | 5.177373% |
Noise dominated data is calculated using 1-second bins in cleaned event files. If a bin has >2000 counts, and if more than 50% of those come from <1% of pixels, then it is considered to be noise-dominated and hence unusable.
| Quadrant | # 1 sec bins | Bins with >0 counts | Bins with >2000 counts | High rate bins dominated by noise | Noise dominated (total time) | Noise dominated (detector-on time) | Marked lightcurve |
|---|---|---|---|---|---|---|---|
| A | 7250 | 5216 | 61 | 61 | 0.84% | 1.17% | 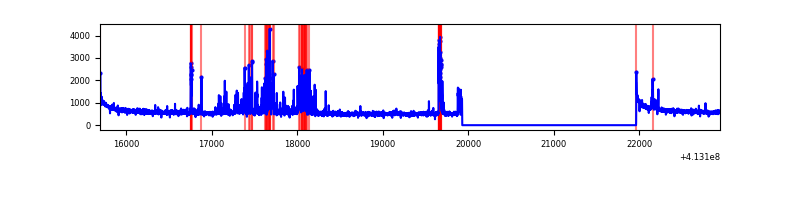 |
| B | 7250 | 5216 | 13 | 13 | 0.18% | 0.25% | 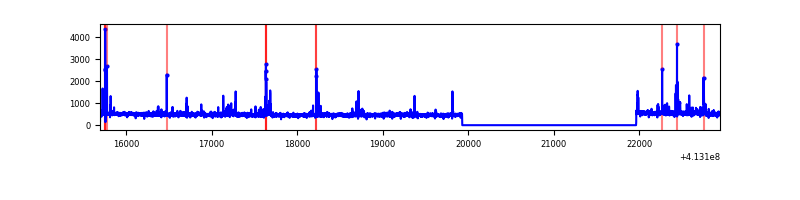 |
| C | 7250 | 5216 | 11 | 11 | 0.15% | 0.21% | 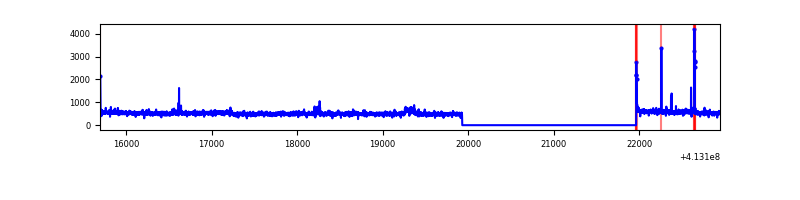 |
| D | 7250 | 5216 | 254 | 254 | 3.50% | 4.87% | 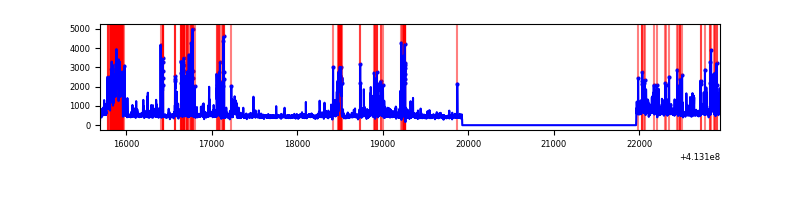 |
Top three noisy pixels from each quadrant. If the there are fewer than three noisy pixels in the level2.evt file, extra rows are filled as -1
| Pixel properties | Quadrant properties | ||||||
|---|---|---|---|---|---|---|---|
| Quadrant | DetID | PixID | Counts | Sigma | Mean | Median | Sigma |
| A | 10 | 83 | 463255 | 3621.34 | 635 | 622 | 127.8 |
| A | 13 | 248 | 319809 | 2498.49 | 635 | 622 | 127.8 |
| A | 15 | 174 | 236934 | 1849.77 | 635 | 622 | 127.8 |
| B | 5 | 172 | 70193 | 588.83 | 625 | 610 | 118.2 |
| B | 5 | 255 | 46173 | 385.57 | 625 | 610 | 118.2 |
| B | 0 | 186 | 28511 | 236.11 | 625 | 610 | 118.2 |
| C | 15 | 214 | 217146 | 1541.56 | 610 | 614 | 140.5 |
| C | 15 | 208 | 46487 | 326.58 | 610 | 614 | 140.5 |
| C | 9 | 187 | 35700 | 249.79 | 610 | 614 | 140.5 |
| D | 12 | 227 | 619530 | 4202.19 | 607 | 589 | 147.3 |
| D | 12 | 233 | 386232 | 2618.25 | 607 | 589 | 147.3 |
| D | 13 | 249 | 159605 | 1079.61 | 607 | 589 | 147.3 |
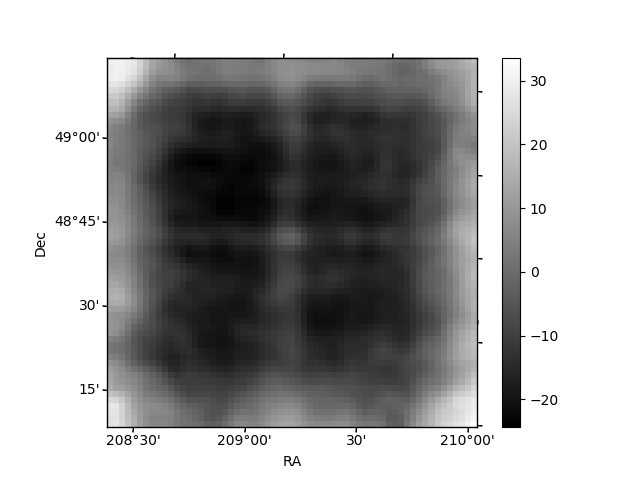
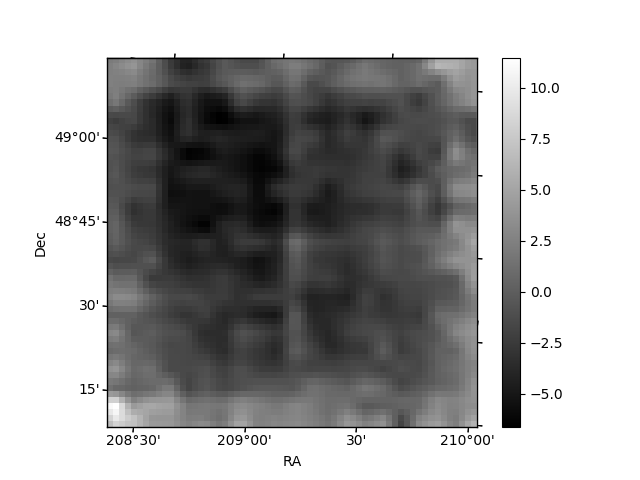
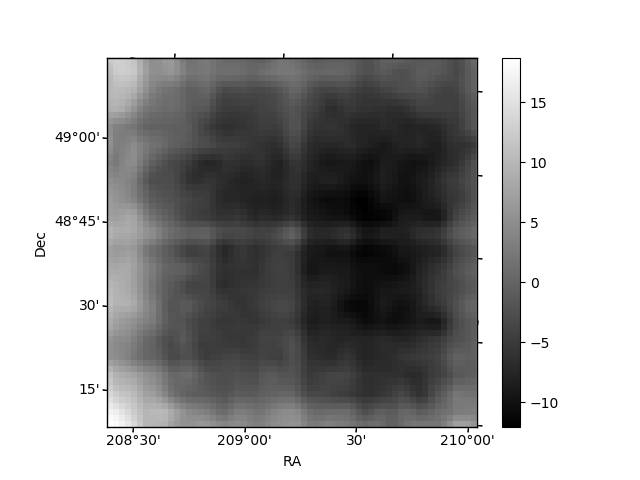
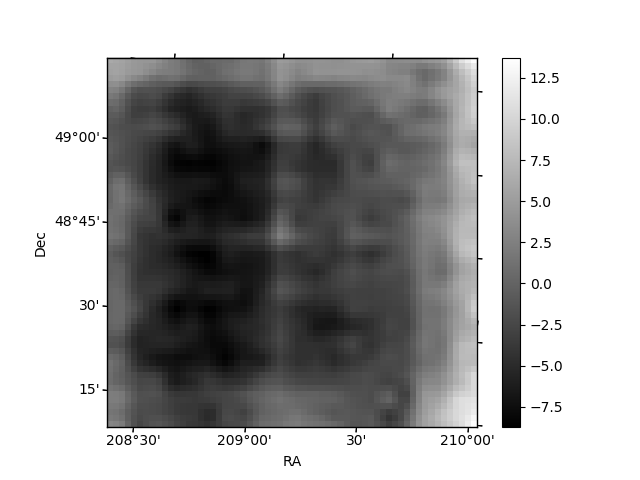
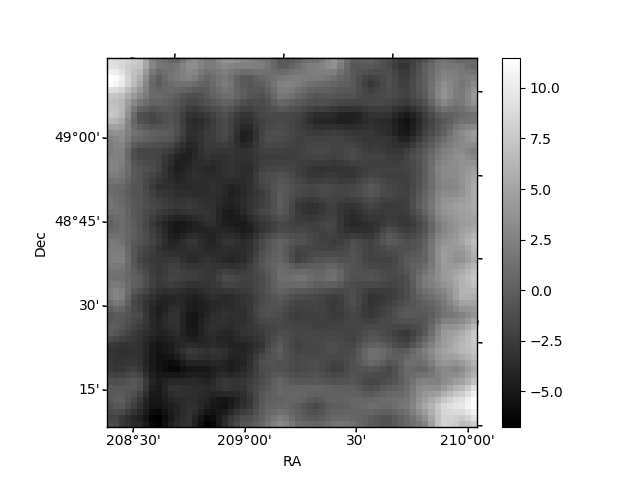
Histogram calculated using DETX and DETY for each event in the final _common_clean file
| Quadrant A | 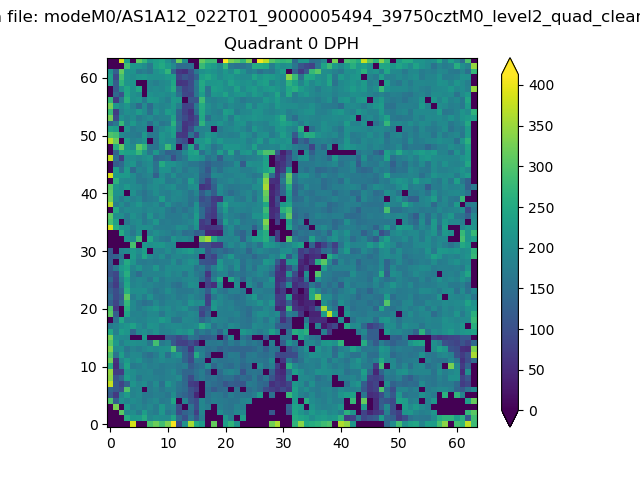 |
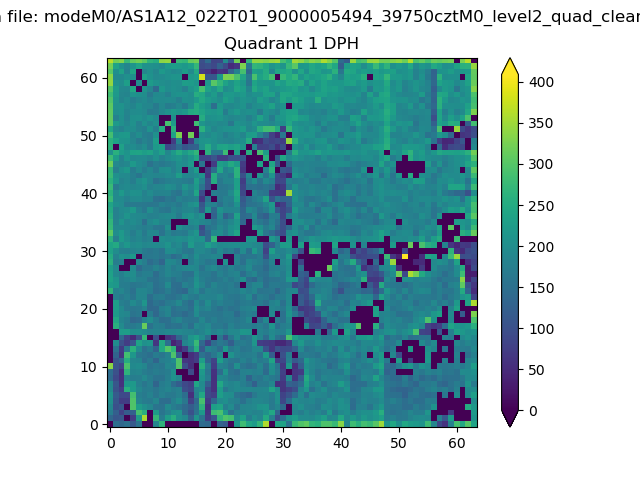 |
Quadrant B |
|---|---|---|---|
| Quadrant D | 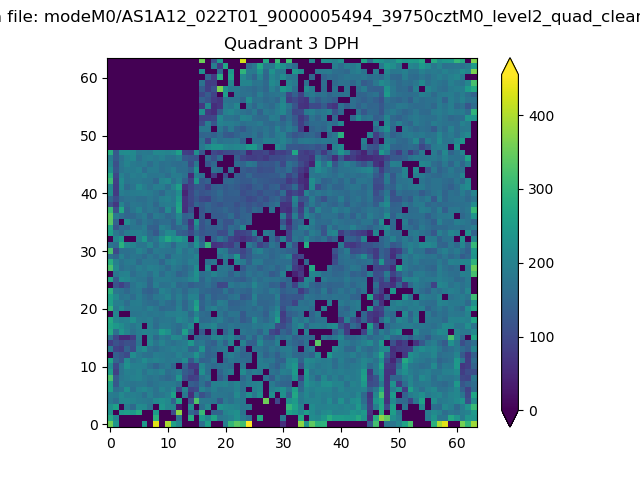 |
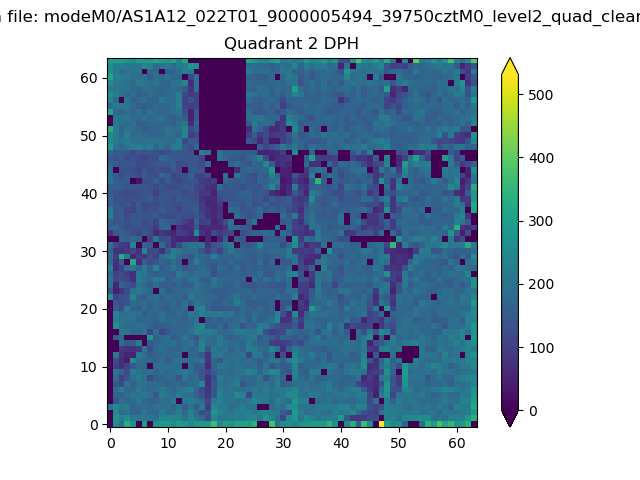 |
Quadrant C |
| Plot type | Count rate plots | Images |
|---|---|---|
| Comparison with Poisson distribution Blue bars denote a histogram of data divided into 1 sec bins. Red curve is a Poisson curve with rate = median count rate of data. |
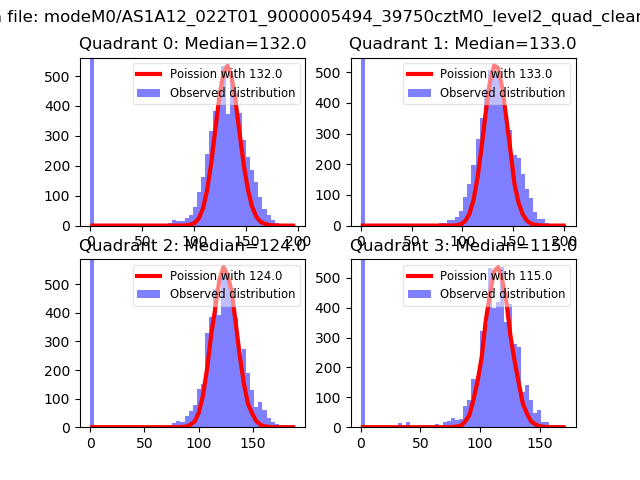 |
 |
| Quadrant-wise count rates Data is divided into 100 sec bins |
 |
|
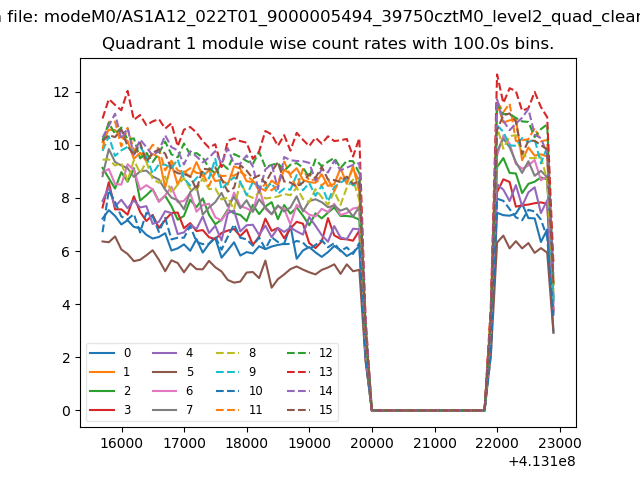
| Module-wise count rates for Quadrant A Data is divided into 100 sec bins |
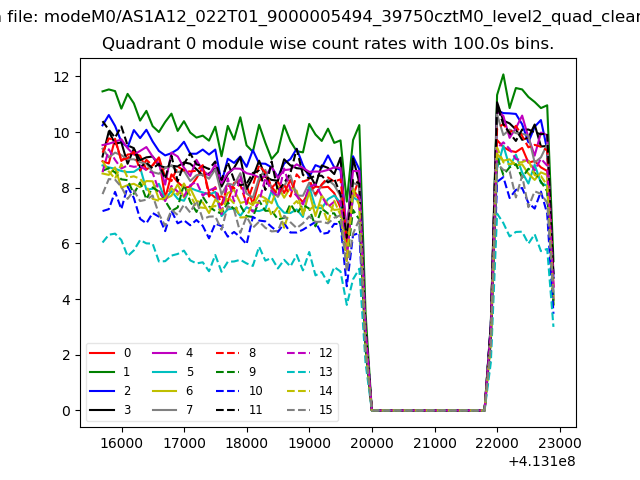 |
 |
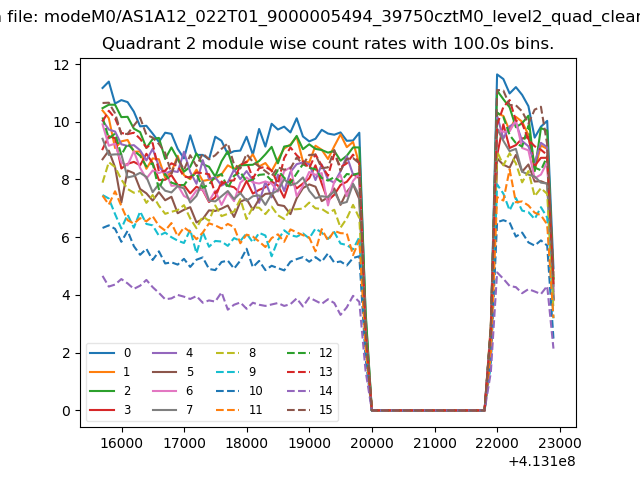
| Module-wise count rates for Quadrant B Data is divided into 100 sec bins |
 |
 |
| Module-wise count rates for Quadrant C Data is divided into 100 sec bins |
 |
 |
| Module-wise count rates for Quadrant D Data is divided into 100 sec bins |
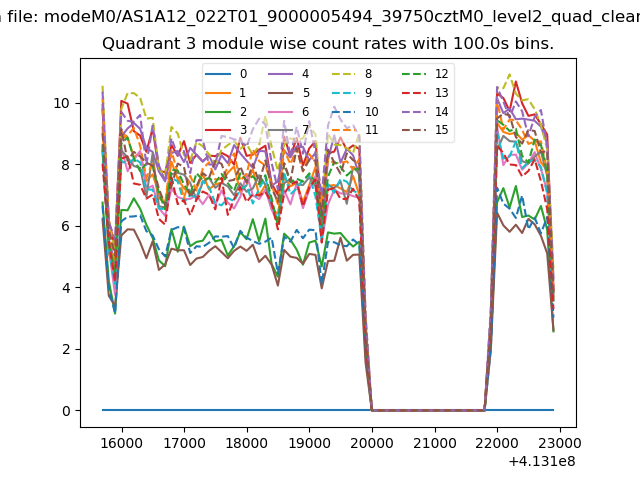 |
 |
| Parameter | Plot |
|---|---|
| CZT HV Monitor | 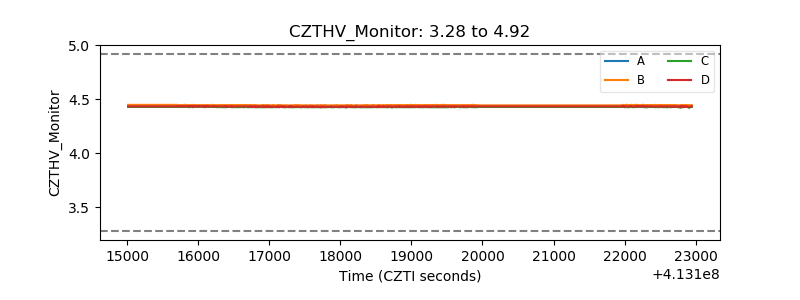 |
| D_VDD | 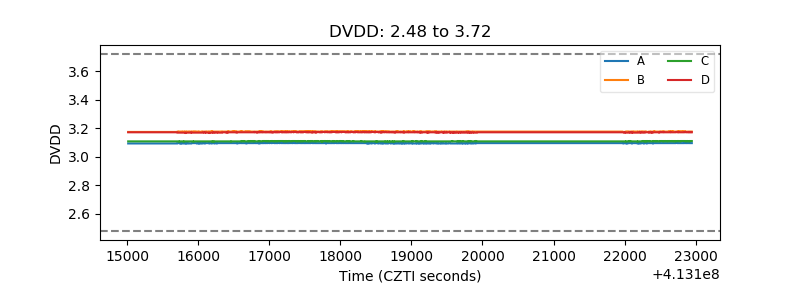 |
| Temperature 1 | 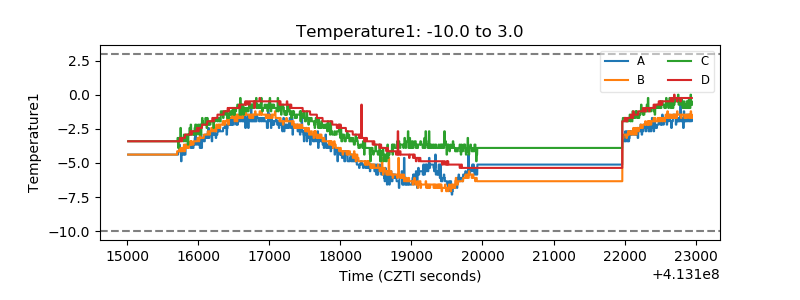 |
| Veto HV Monitor | 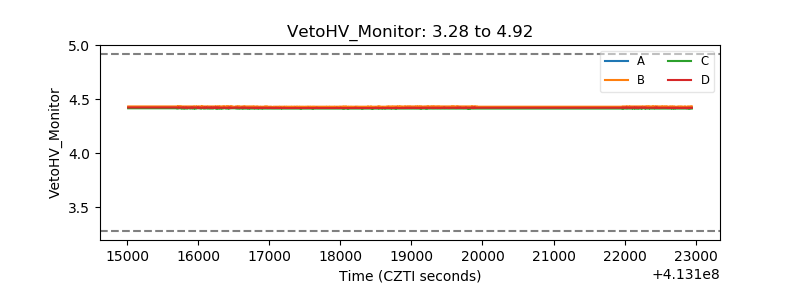 |
| Veto LLD | 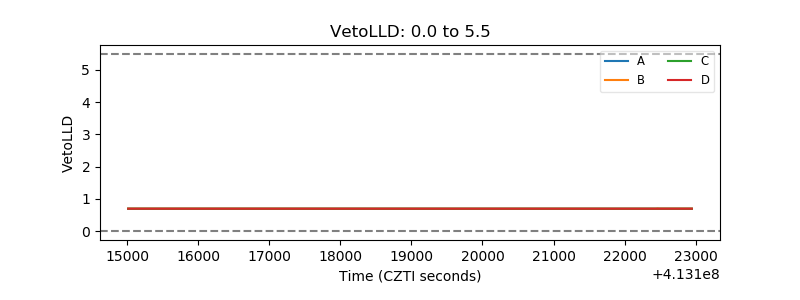 |
| Alpha Counter | 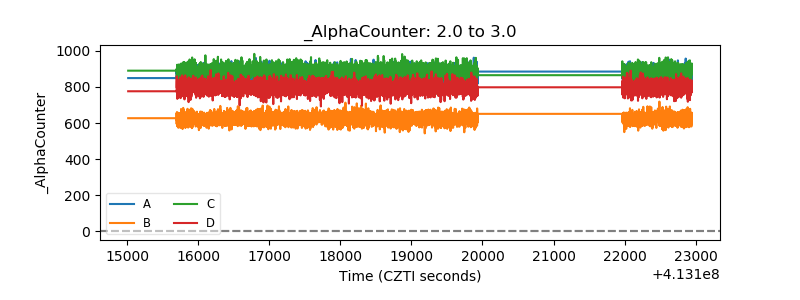 |
| _CPM_Rate | 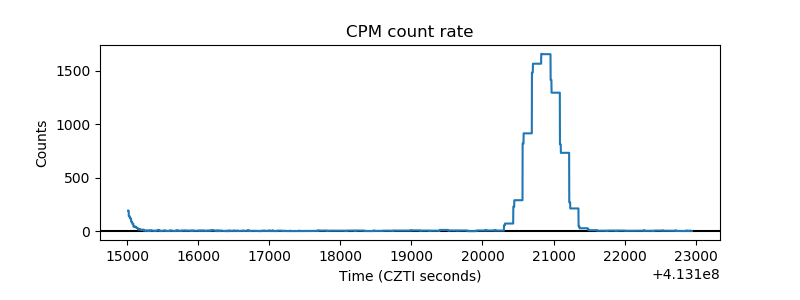 |
| CZT Counter | 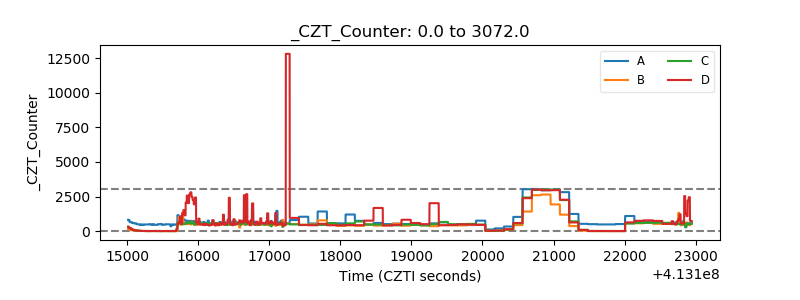 |
| +2.5 Volts monitor | 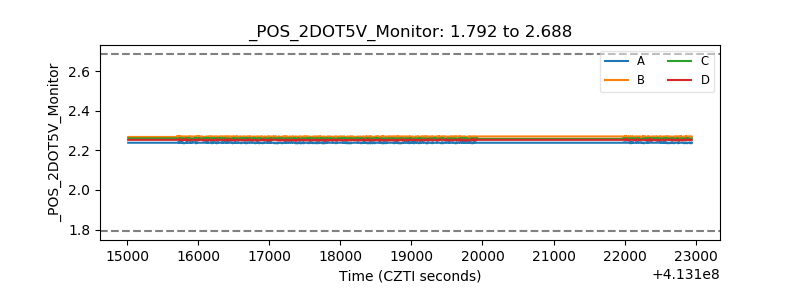 |
| +5 Volts monitor | 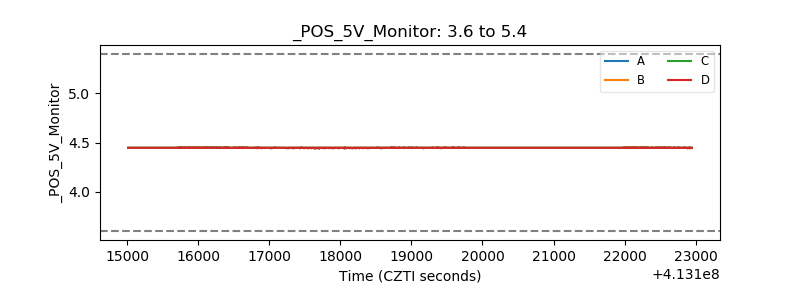 |
| _ROLL_ROT | 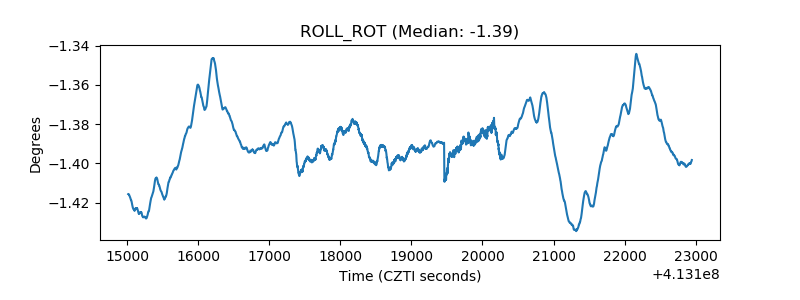 |
| _Roll_DEC | 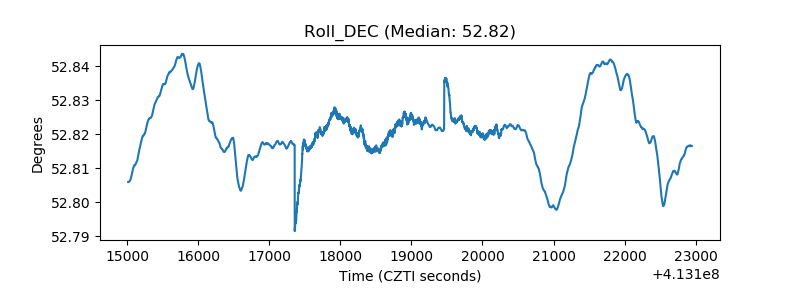 |
| _Roll_RA | 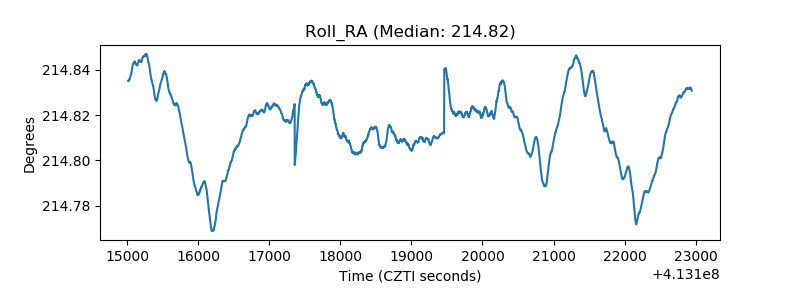 |
| Veto Counter | 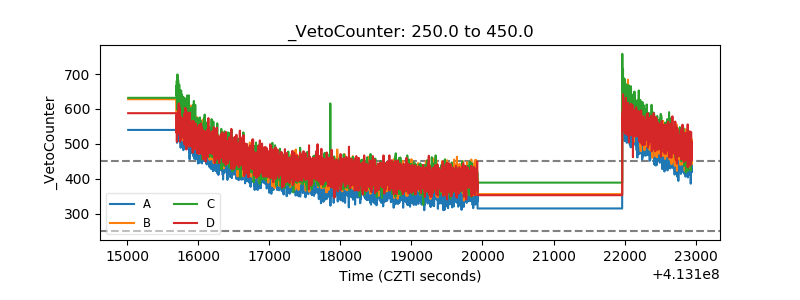 |