| Param | Original file | Final file |
|---|---|---|
| Filename | modeM0/AS1A12_022T01_9000005494_39751cztM0_level2.fits | modeM0/AS1A12_022T01_9000005494_39751cztM0_level2_quad_clean.evt |
| Size (bytes) | 373,337,280 | 99,123,840 |
| Size | 356.0 MB | 94.5 MB |
| Events in quadrant A | 3,781,456 | 676,151 |
| Events in quadrant B | 2,703,010 | 707,472 |
| Events in quadrant C | 3,023,223 | 655,054 |
| Events in quadrant D | 3,906,864 | 598,559 |
| Mode SS | |||
|---|---|---|---|
| Quadrant | BADHDUFLAG | Total packets | Discarded packets |
| A | 0 | 104 | 0 |
| B | 0 | 104 | 0 |
| C | 0 | 104 | 0 |
| D | 0 | 104 | 0 |
| Mode M0 | |||
|---|---|---|---|
| Quadrant | BADHDUFLAG | Total packets | Discarded packets |
| A | 0 | 14698 | 3 |
| B | 0 | 11188 | 2 |
| C | 0 | 12041 | 2 |
| D | 0 | 15113 | 2 |
| Mode M9 | |||
|---|---|---|---|
| Quadrant | BADHDUFLAG | Total packets | Discarded packets |
| A | 0 | 24 | 0 |
| B | 0 | 24 | 0 |
| C | 0 | 24 | 0 |
| D | 0 | 25 | 0 |
| Quadrant | Total seconds | Saturated seconds | Saturation percentage |
|---|---|---|---|
| A | 5211 | 223 | 4.279409% |
| B | 5211 | 19 | 0.364613% |
| C | 5211 | 35 | 0.671656% |
| D | 5211 | 233 | 4.471311% |
Noise dominated data is calculated using 1-second bins in cleaned event files. If a bin has >2000 counts, and if more than 50% of those come from <1% of pixels, then it is considered to be noise-dominated and hence unusable.
| Quadrant | # 1 sec bins | Bins with >0 counts | Bins with >2000 counts | High rate bins dominated by noise | Noise dominated (total time) | Noise dominated (detector-on time) | Marked lightcurve |
|---|---|---|---|---|---|---|---|
| A | 7334 | 5212 | 167 | 167 | 2.28% | 3.20% | 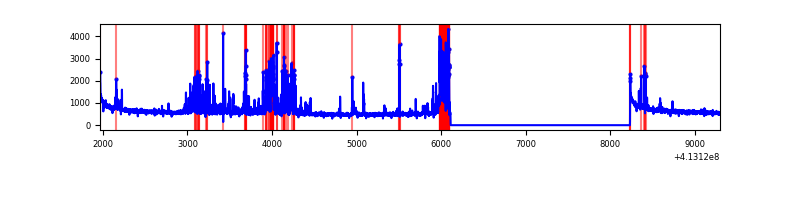 |
| B | 7334 | 5212 | 10 | 10 | 0.14% | 0.19% | 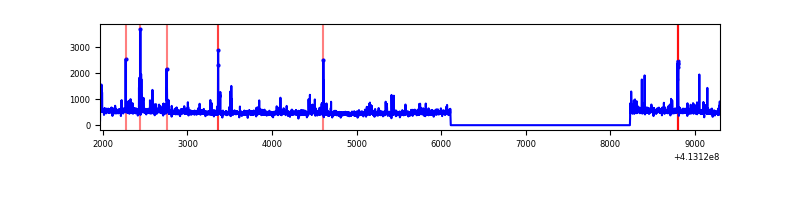 |
| C | 7334 | 5212 | 30 | 30 | 0.41% | 0.58% | 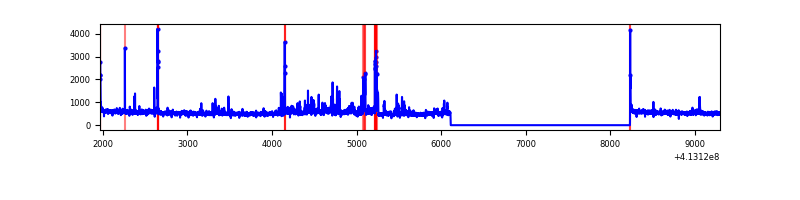 |
| D | 7334 | 5212 | 201 | 201 | 2.74% | 3.86% | 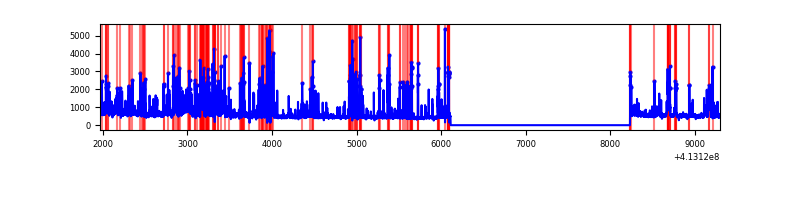 |
Top three noisy pixels from each quadrant. If the there are fewer than three noisy pixels in the level2.evt file, extra rows are filled as -1
| Pixel properties | Quadrant properties | ||||||
|---|---|---|---|---|---|---|---|
| Quadrant | DetID | PixID | Counts | Sigma | Mean | Median | Sigma |
| A | 15 | 174 | 503331 | 3927.73 | 628 | 615 | 128.0 |
| A | 10 | 83 | 469204 | 3661.09 | 628 | 615 | 128.0 |
| A | 13 | 248 | 312927 | 2440.1 | 628 | 615 | 128.0 |
| B | 5 | 172 | 102526 | 866.61 | 628 | 614 | 117.6 |
| B | 0 | 190 | 45378 | 380.65 | 628 | 614 | 117.6 |
| B | 4 | 251 | 25227 | 209.3 | 628 | 614 | 117.6 |
| C | 15 | 208 | 258435 | 1818.33 | 615 | 621 | 141.8 |
| C | 15 | 214 | 217053 | 1526.47 | 615 | 621 | 141.8 |
| C | 9 | 187 | 84849 | 594.05 | 615 | 621 | 141.8 |
| D | 12 | 227 | 1113289 | 7422.69 | 614 | 597 | 149.9 |
| D | 2 | 250 | 134510 | 893.32 | 614 | 597 | 149.9 |
| D | 12 | 233 | 99227 | 657.95 | 614 | 597 | 149.9 |
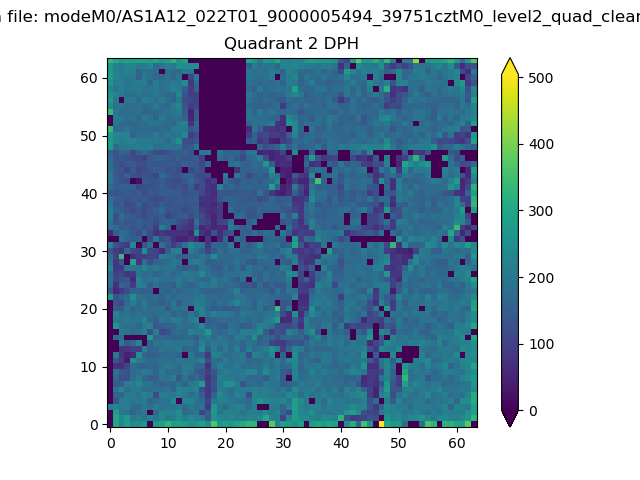
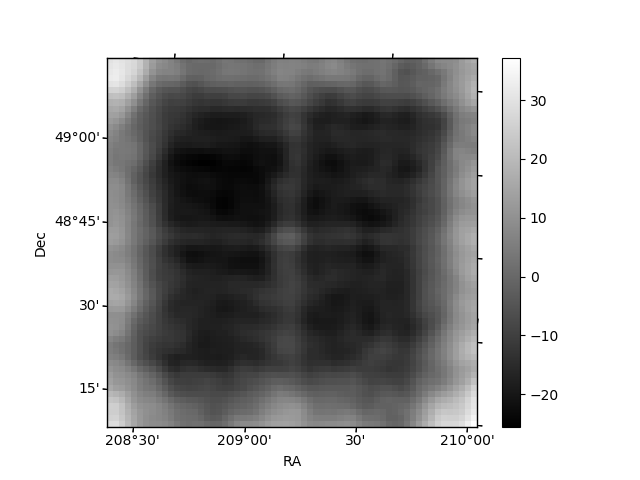
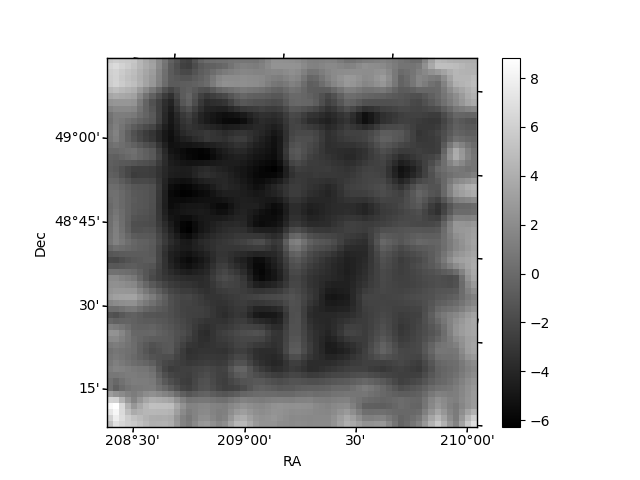
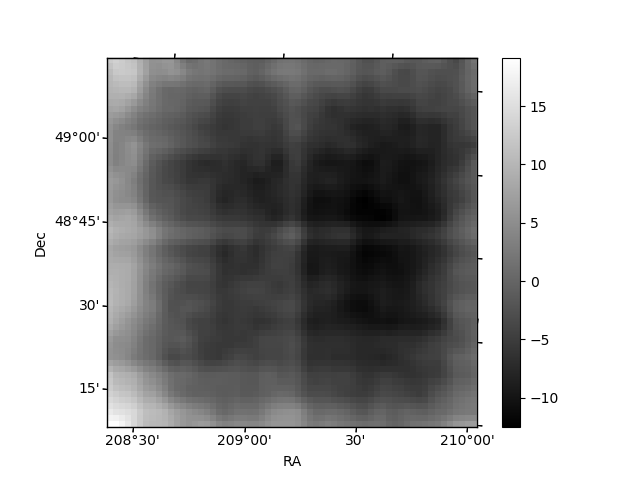
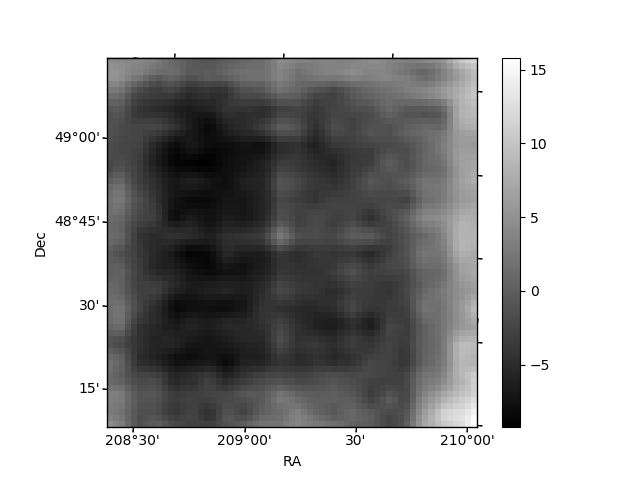
Histogram calculated using DETX and DETY for each event in the final _common_clean file
| Quadrant A | 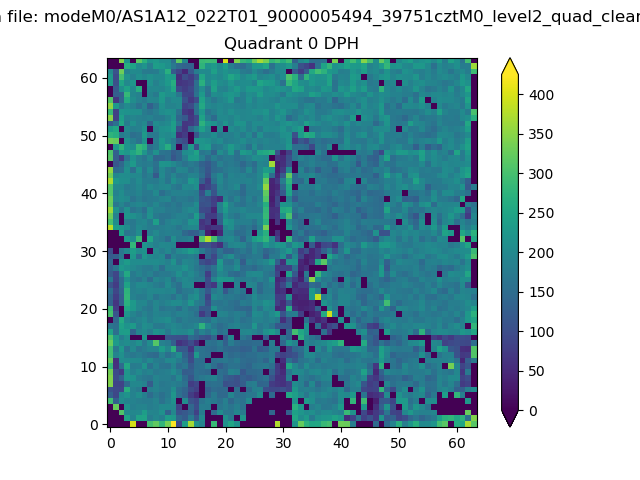 |
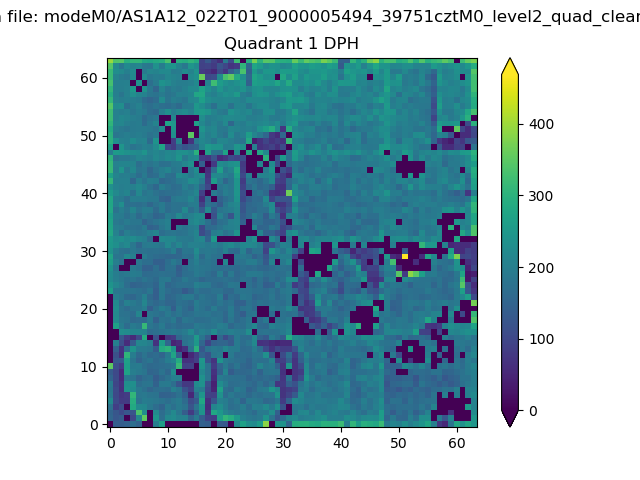 |
Quadrant B |
|---|---|---|---|
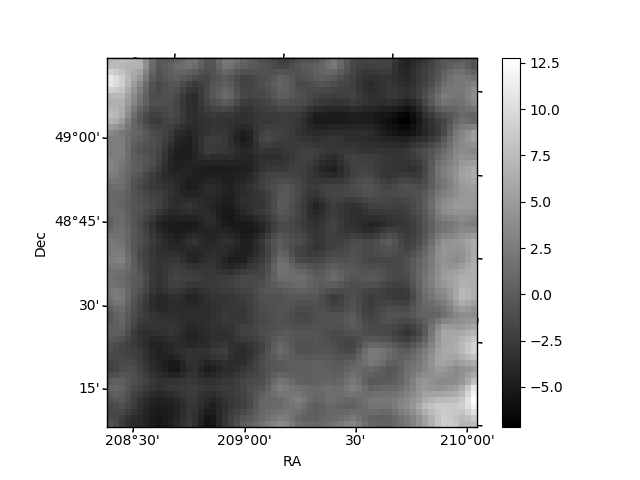
| Quadrant D | 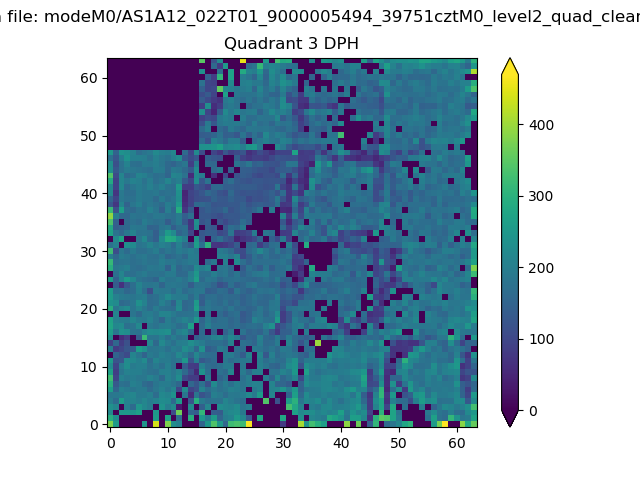 |
 |
Quadrant C |
| Plot type | Count rate plots | Images |
|---|---|---|
| Comparison with Poisson distribution Blue bars denote a histogram of data divided into 1 sec bins. Red curve is a Poisson curve with rate = median count rate of data. |
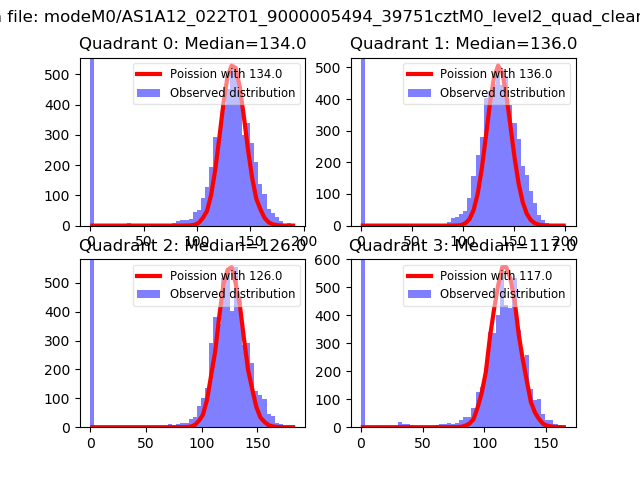 |
 |
| Quadrant-wise count rates Data is divided into 100 sec bins |
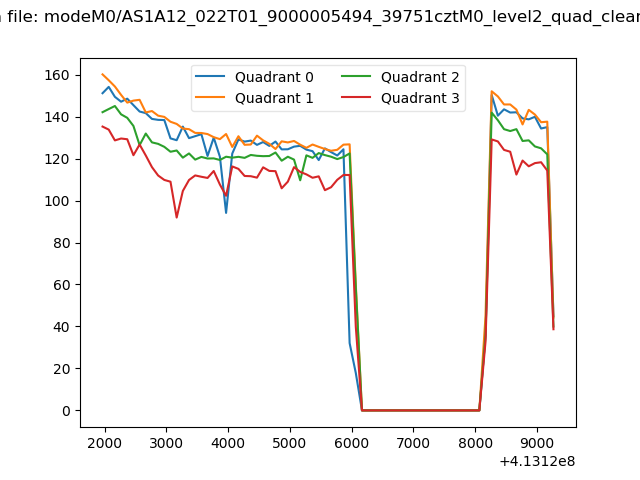 |
|
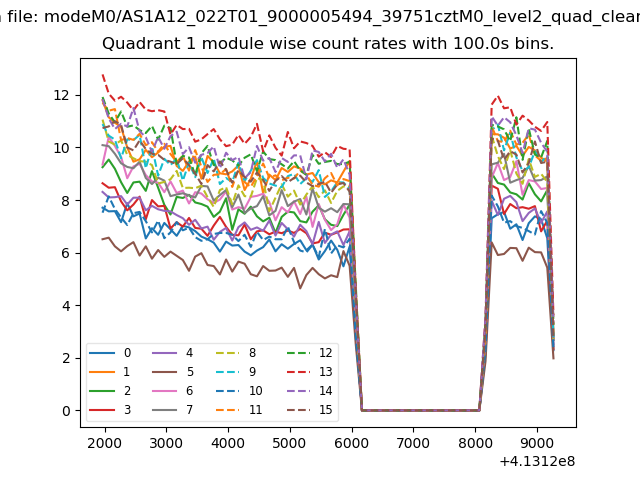
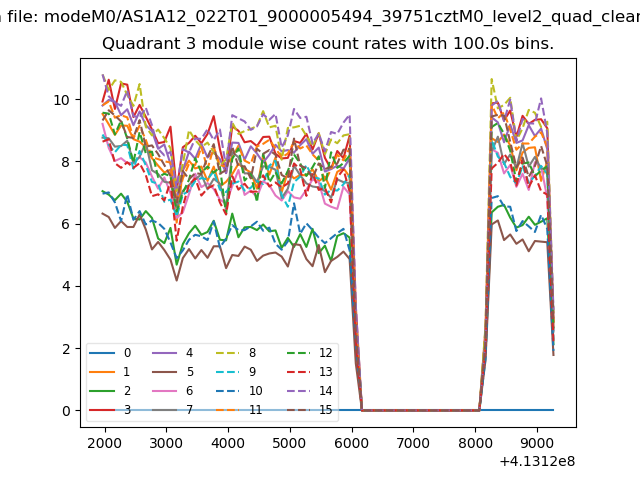
| Module-wise count rates for Quadrant A Data is divided into 100 sec bins |
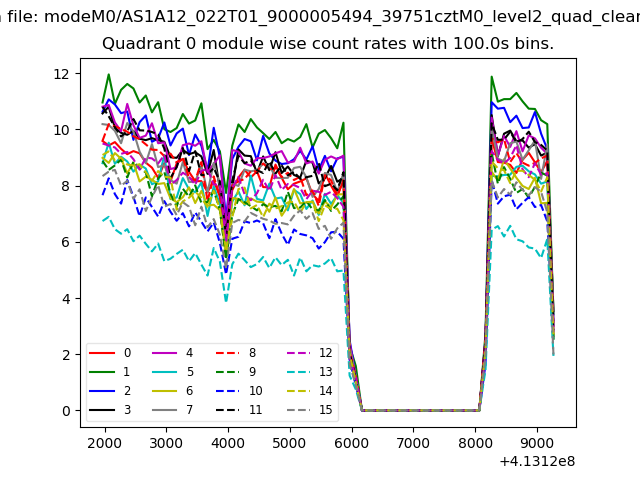 |
 |
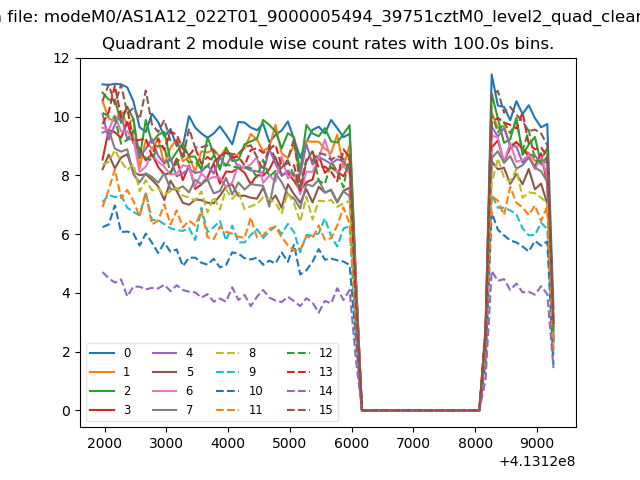
| Module-wise count rates for Quadrant B Data is divided into 100 sec bins |
 |
 |
| Module-wise count rates for Quadrant C Data is divided into 100 sec bins |
 |
 |
| Module-wise count rates for Quadrant D Data is divided into 100 sec bins |
 |
 |
| Parameter | Plot |
|---|---|
| CZT HV Monitor | 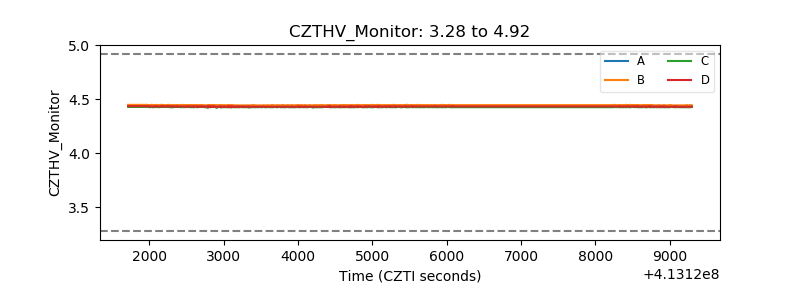 |
| D_VDD | 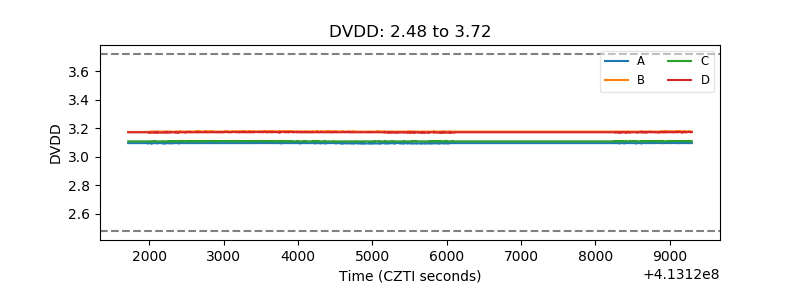 |
| Temperature 1 | 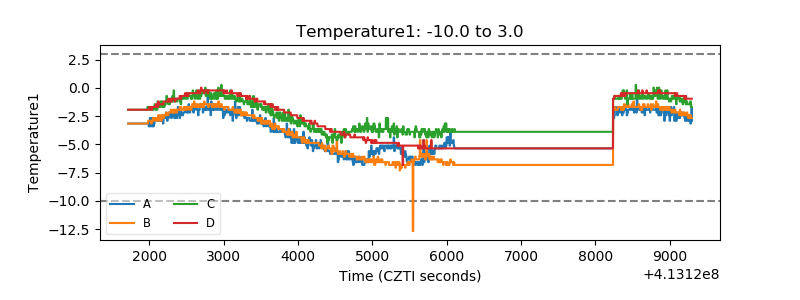 |
| Veto HV Monitor | 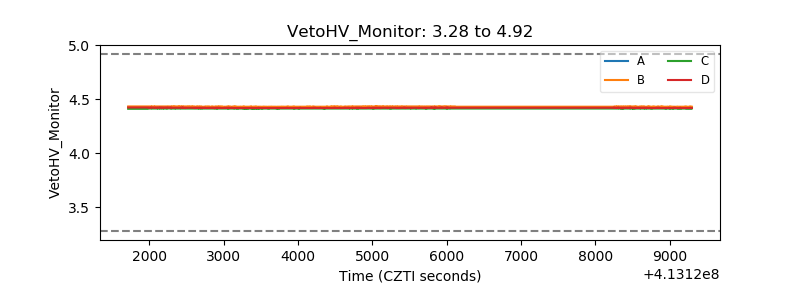 |
| Veto LLD | 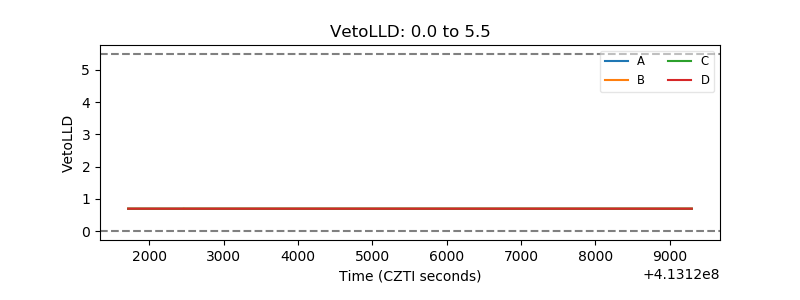 |
| Alpha Counter | 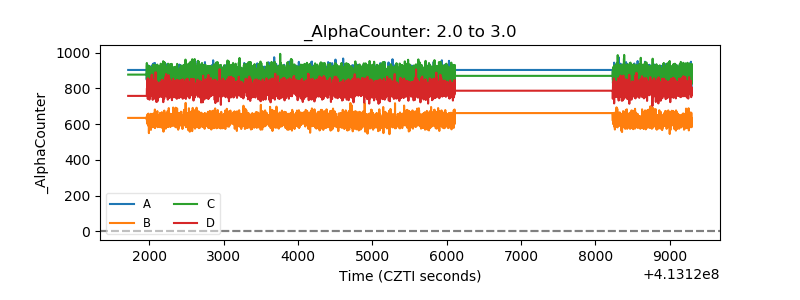 |
| _CPM_Rate | 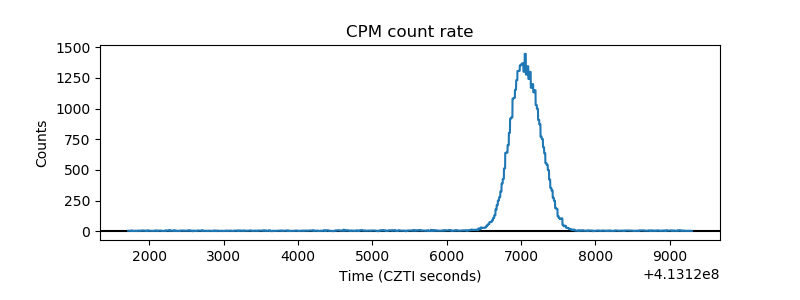 |
| CZT Counter | 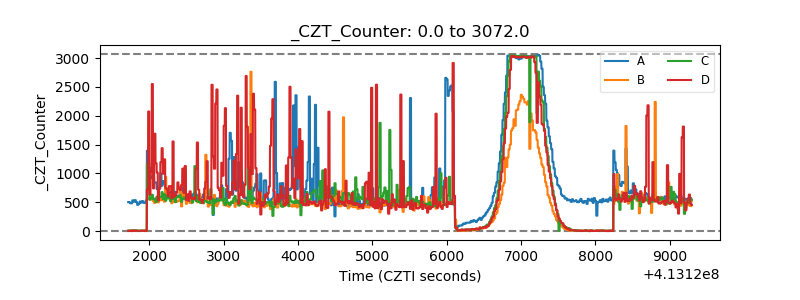 |
| +2.5 Volts monitor | 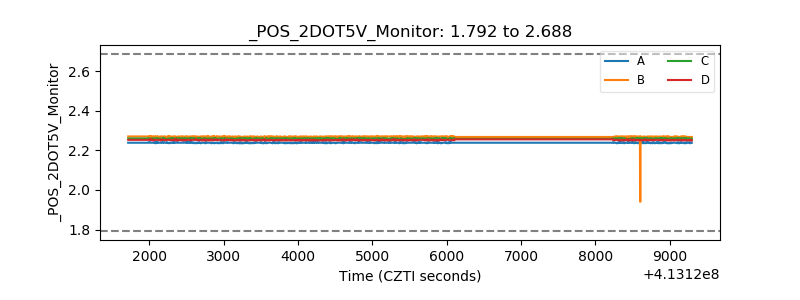 |
| +5 Volts monitor |  |
| _ROLL_ROT | 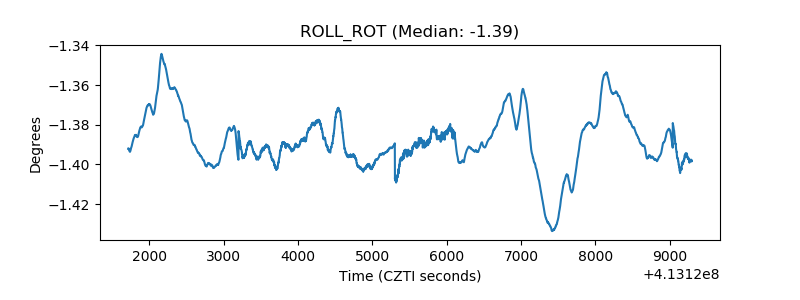 |
| _Roll_DEC | 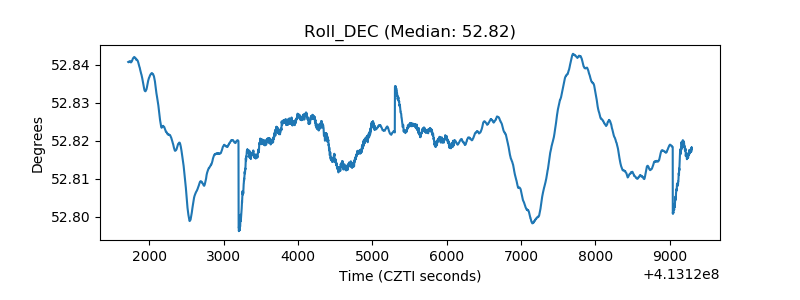 |
| _Roll_RA | 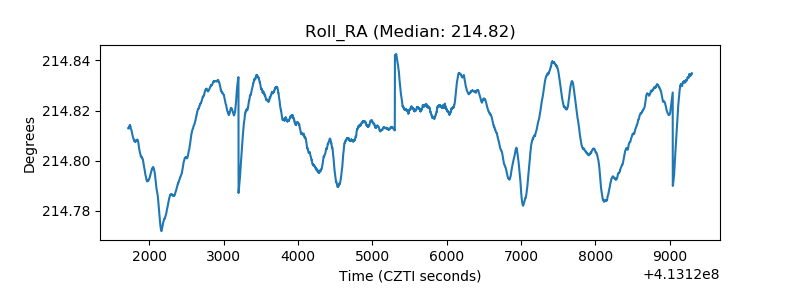 |
| Veto Counter | 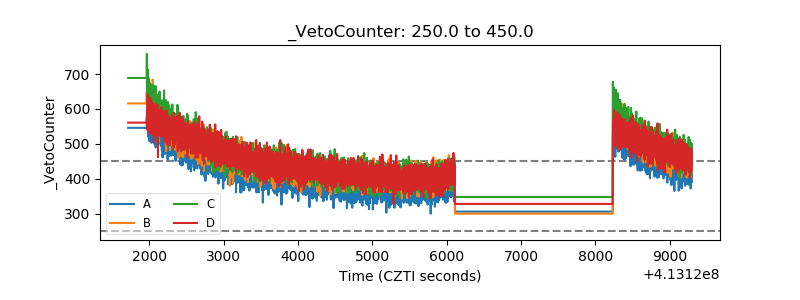 |