| Param | Original file | Final file |
|---|---|---|
| Filename | modeM0/AS1A12_022T01_9000005494_39752cztM0_level2.fits | modeM0/AS1A12_022T01_9000005494_39752cztM0_level2_quad_clean.evt |
| Size (bytes) | 592,804,800 | 156,790,080 |
| Size | 565.3 MB | 149.5 MB |
| Events in quadrant A | 5,661,615 | 1,073,678 |
| Events in quadrant B | 4,556,600 | 1,108,012 |
| Events in quadrant C | 4,616,042 | 1,048,478 |
| Events in quadrant D | 6,442,949 | 921,761 |
| Mode SS | |||
|---|---|---|---|
| Quadrant | BADHDUFLAG | Total packets | Discarded packets |
| A | 0 | 174 | 0 |
| B | 0 | 174 | 0 |
| C | 0 | 174 | 0 |
| D | 0 | 174 | 0 |
| Mode M0 | |||
|---|---|---|---|
| Quadrant | BADHDUFLAG | Total packets | Discarded packets |
| A | 0 | 22138 | 3 |
| B | 0 | 18929 | 2 |
| C | 0 | 18686 | 2 |
| D | 0 | 24909 | 2 |
| Mode M9 | |||
|---|---|---|---|
| Quadrant | BADHDUFLAG | Total packets | Discarded packets |
| A | 0 | 43 | 0 |
| B | 0 | 43 | 0 |
| C | 0 | 43 | 0 |
| D | 0 | 43 | 0 |
| Quadrant | Total seconds | Saturated seconds | Saturation percentage |
|---|---|---|---|
| A | 8591 | 295 | 3.433826% |
| B | 8591 | 105 | 1.222209% |
| C | 8591 | 34 | 0.395763% |
| D | 8591 | 639 | 7.438017% |
Noise dominated data is calculated using 1-second bins in cleaned event files. If a bin has >2000 counts, and if more than 50% of those come from <1% of pixels, then it is considered to be noise-dominated and hence unusable.
| Quadrant | # 1 sec bins | Bins with >0 counts | Bins with >2000 counts | High rate bins dominated by noise | Noise dominated (total time) | Noise dominated (detector-on time) | Marked lightcurve |
|---|---|---|---|---|---|---|---|
| A | 12836 | 8593 | 233 | 233 | 1.82% | 2.71% | 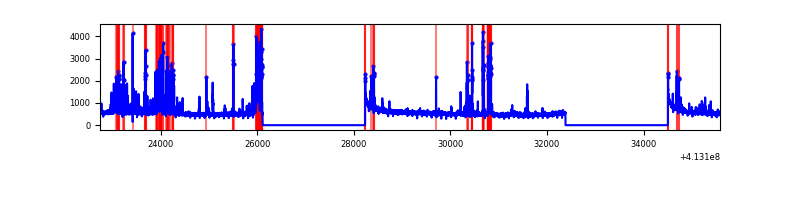 |
| B | 12836 | 8593 | 75 | 75 | 0.58% | 0.87% | 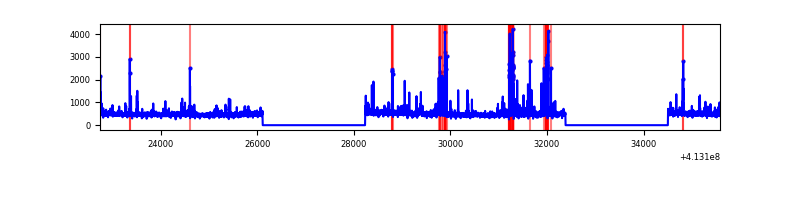 |
| C | 12836 | 8593 | 25 | 25 | 0.19% | 0.29% | 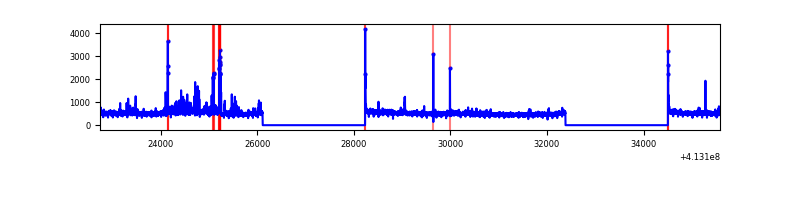 |
| D | 12836 | 8593 | 521 | 521 | 4.06% | 6.06% | 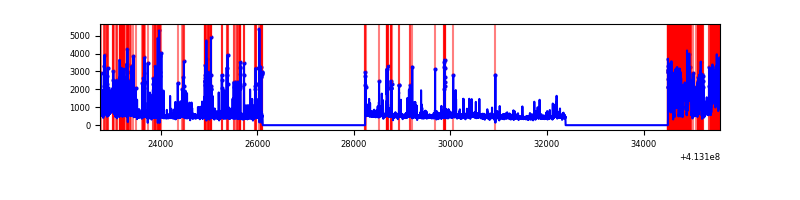 |
Top three noisy pixels from each quadrant. If the there are fewer than three noisy pixels in the level2.evt file, extra rows are filled as -1
| Pixel properties | Quadrant properties | ||||||
|---|---|---|---|---|---|---|---|
| Quadrant | DetID | PixID | Counts | Sigma | Mean | Median | Sigma |
| A | 15 | 174 | 708659 | 3533.82 | 997 | 980 | 200.3 |
| A | 10 | 83 | 660773 | 3294.7 | 997 | 980 | 200.3 |
| A | 13 | 248 | 359005 | 1787.81 | 997 | 980 | 200.3 |
| B | 5 | 172 | 208785 | 1111.95 | 998 | 974 | 186.9 |
| B | 4 | 170 | 149341 | 793.88 | 998 | 974 | 186.9 |
| B | 5 | 255 | 113178 | 600.38 | 998 | 974 | 186.9 |
| C | 15 | 214 | 348370 | 1523.18 | 986 | 995 | 228.1 |
| C | 15 | 208 | 279165 | 1219.72 | 986 | 995 | 228.1 |
| C | 9 | 187 | 93786 | 406.87 | 986 | 995 | 228.1 |
| D | 12 | 227 | 2185816 | 9309.83 | 964 | 935 | 234.7 |
| D | 2 | 250 | 123757 | 523.35 | 964 | 935 | 234.7 |
| D | 13 | 249 | 120393 | 509.01 | 964 | 935 | 234.7 |
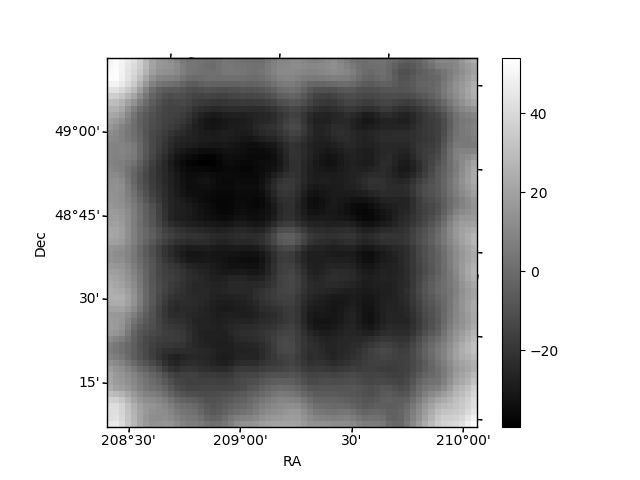
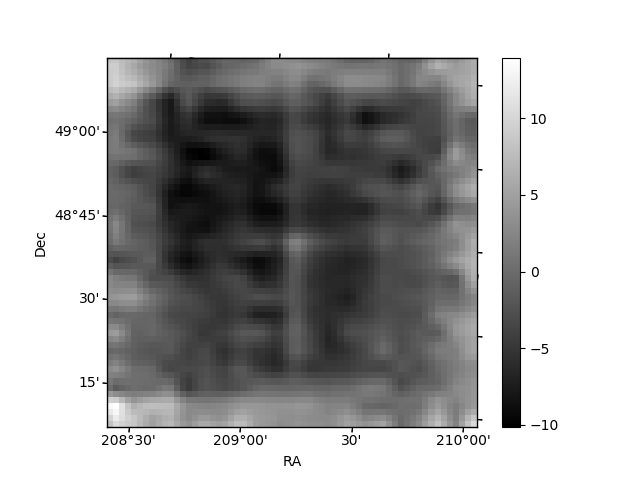
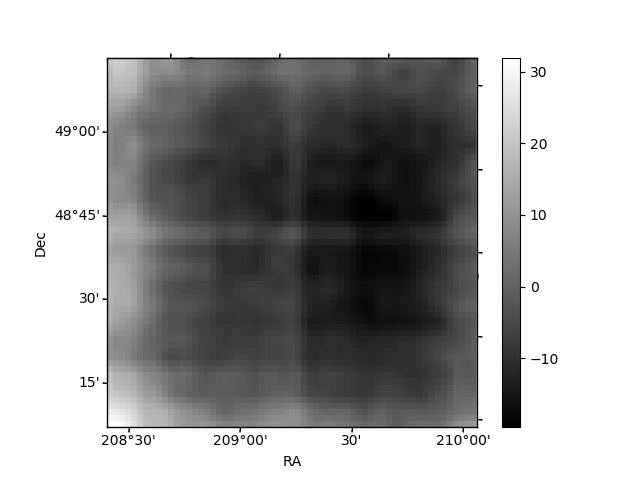
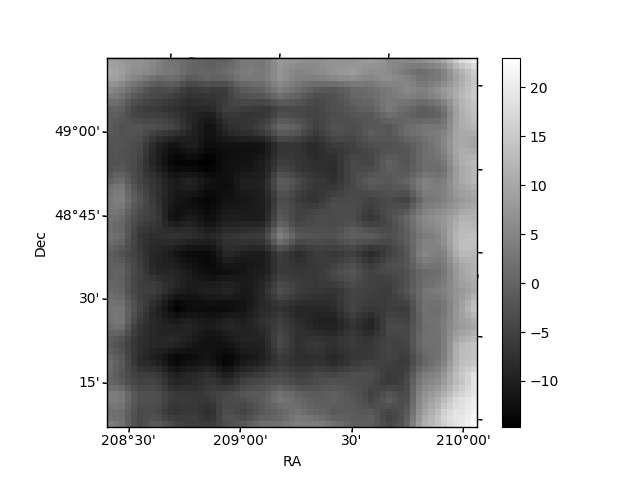
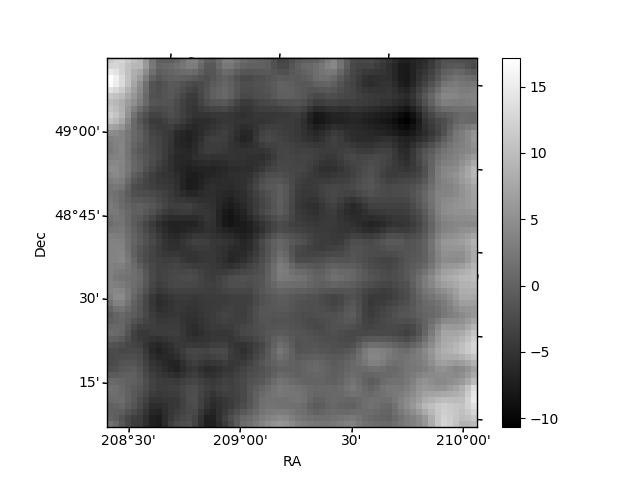
Histogram calculated using DETX and DETY for each event in the final _common_clean file
| Quadrant A | 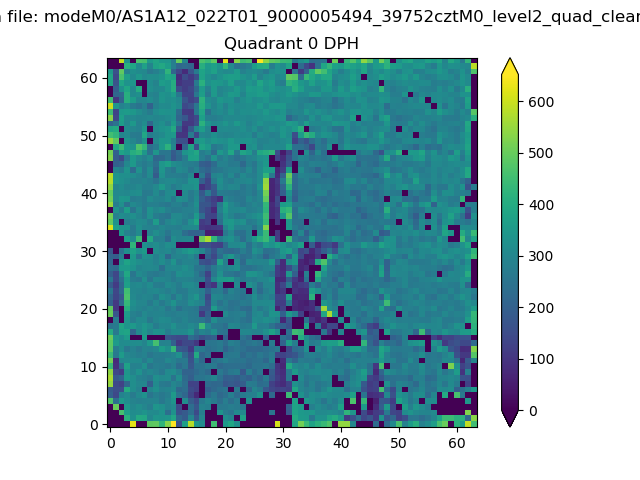 |
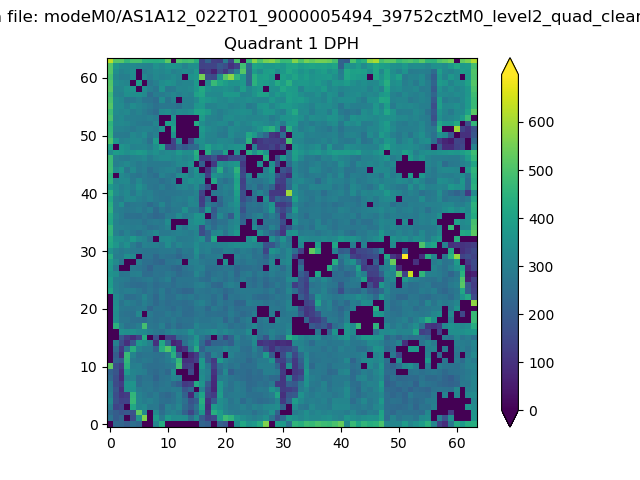 |
Quadrant B |
|---|---|---|---|
| Quadrant D | 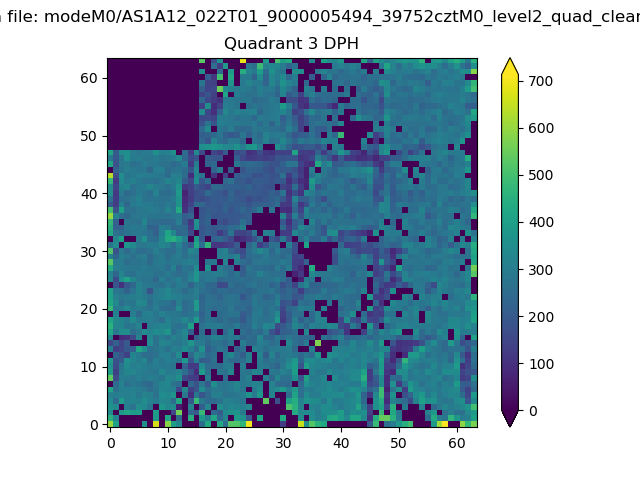 |
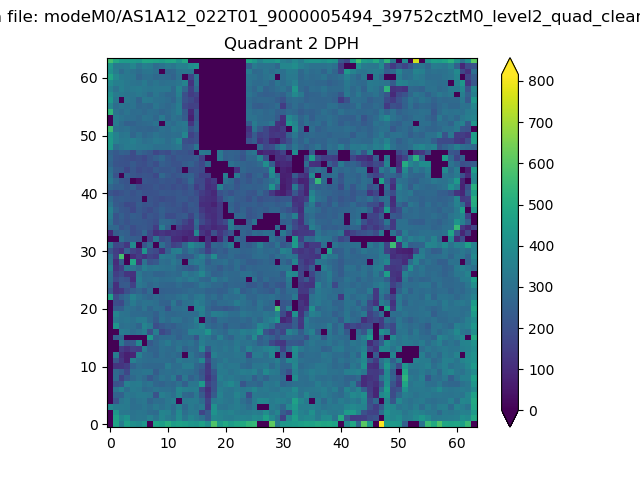 |
Quadrant C |
| Plot type | Count rate plots | Images |
|---|---|---|
| Comparison with Poisson distribution Blue bars denote a histogram of data divided into 1 sec bins. Red curve is a Poisson curve with rate = median count rate of data. |
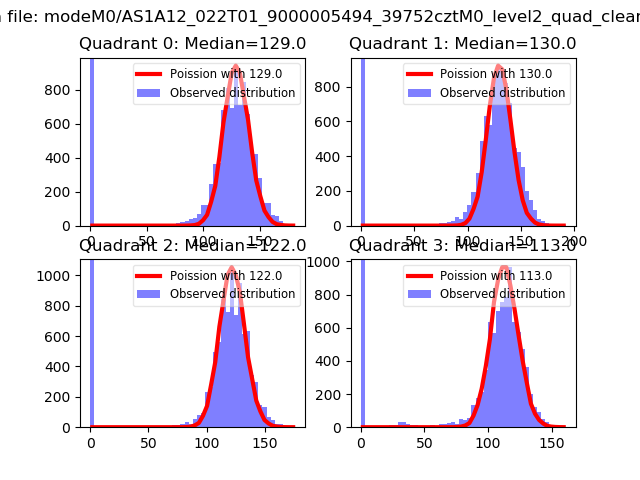 |
 |
| Quadrant-wise count rates Data is divided into 100 sec bins |
 |
|
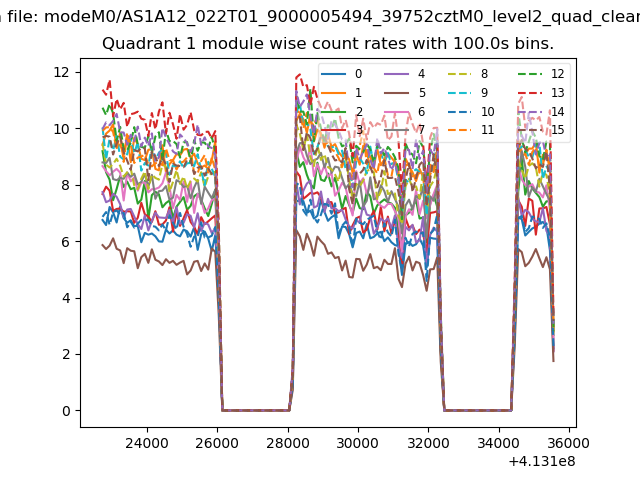
| Module-wise count rates for Quadrant A Data is divided into 100 sec bins |
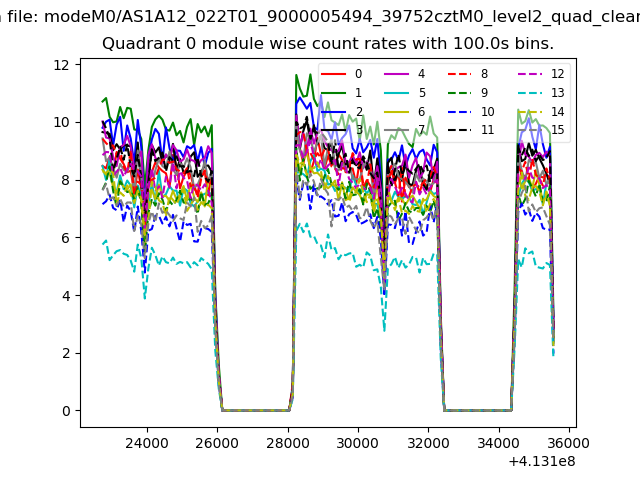 |
 |
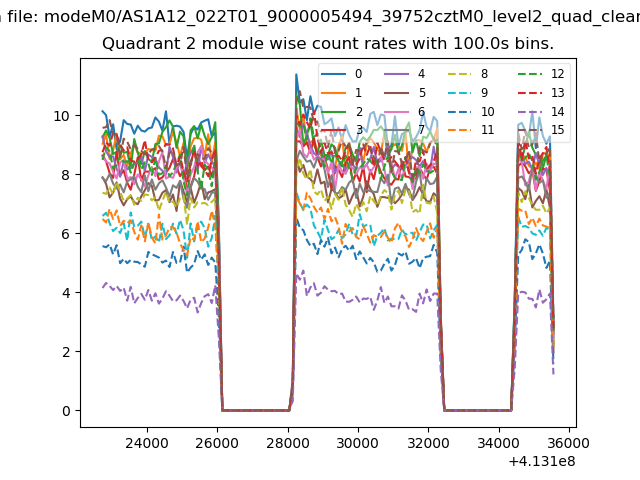
| Module-wise count rates for Quadrant B Data is divided into 100 sec bins |
 |
 |
| Module-wise count rates for Quadrant C Data is divided into 100 sec bins |
 |
 |
| Module-wise count rates for Quadrant D Data is divided into 100 sec bins |
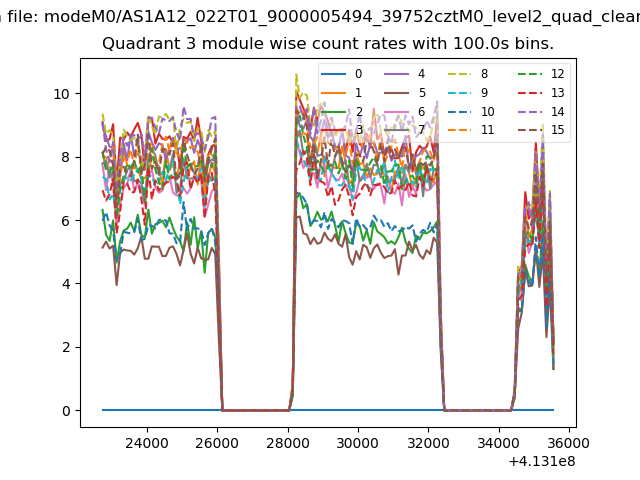 |
 |
| Parameter | Plot |
|---|---|
| CZT HV Monitor | 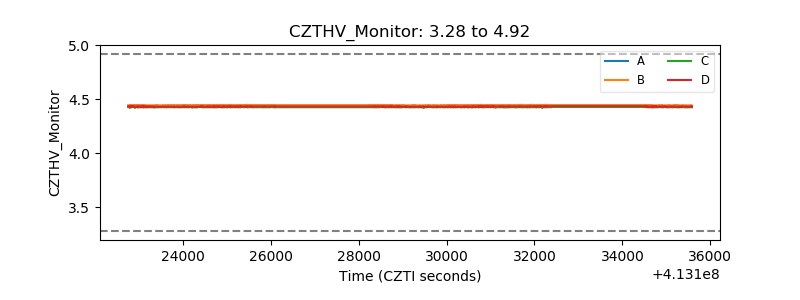 |
| D_VDD | 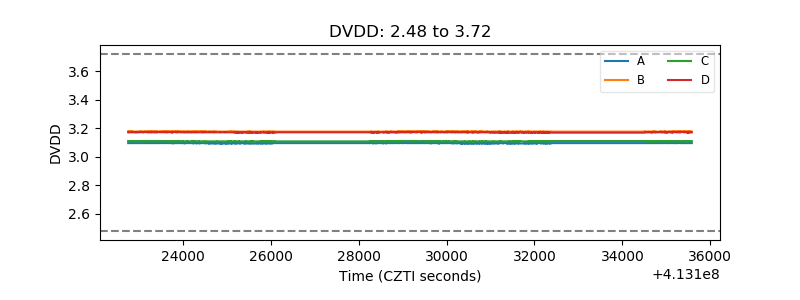 |
| Temperature 1 | 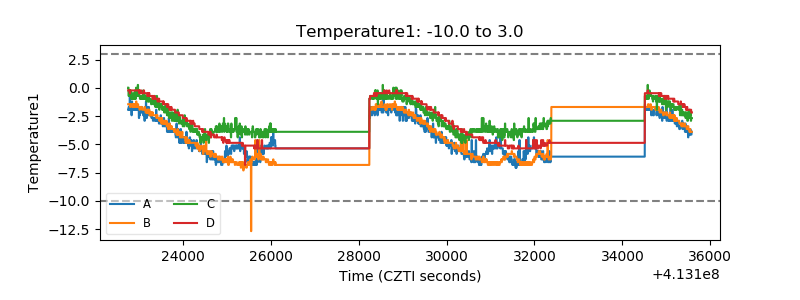 |
| Veto HV Monitor | 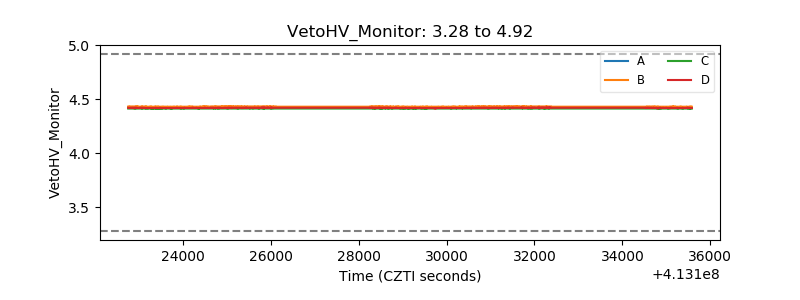 |
| Veto LLD | 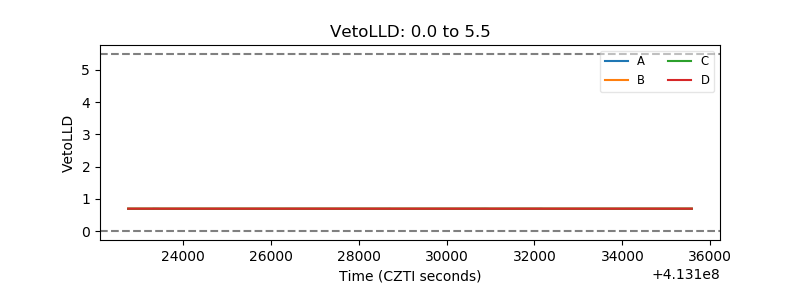 |
| Alpha Counter | 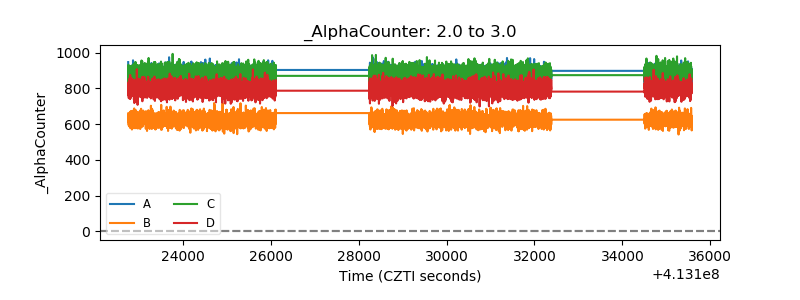 |
| _CPM_Rate | 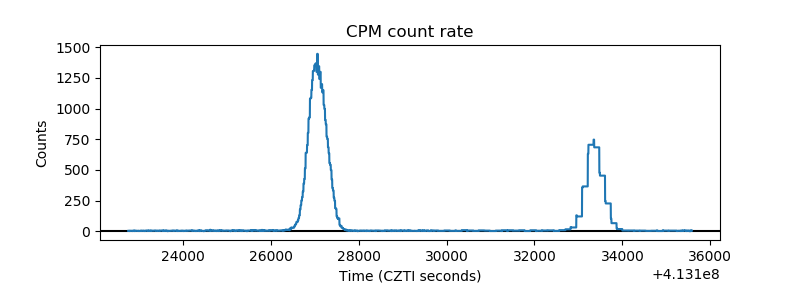 |
| CZT Counter | 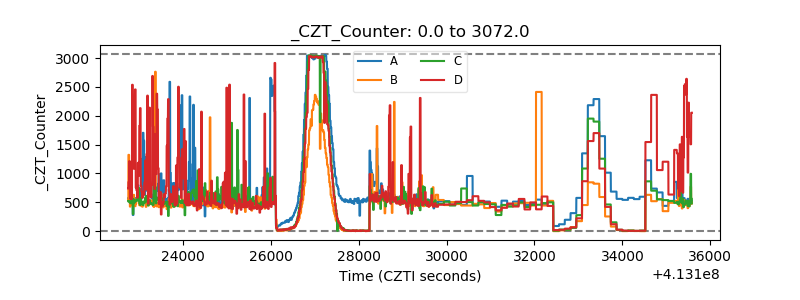 |
| +2.5 Volts monitor | 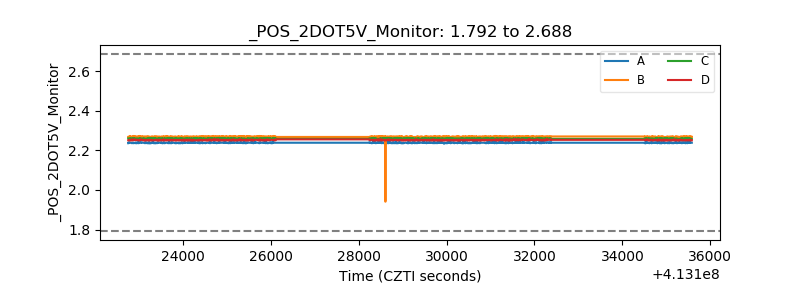 |
| +5 Volts monitor |  |
| _ROLL_ROT | 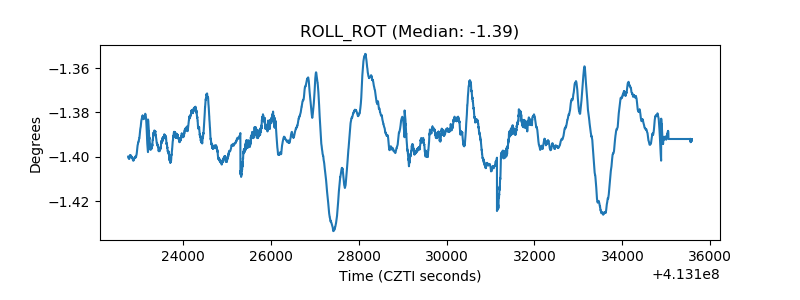 |
| _Roll_DEC | 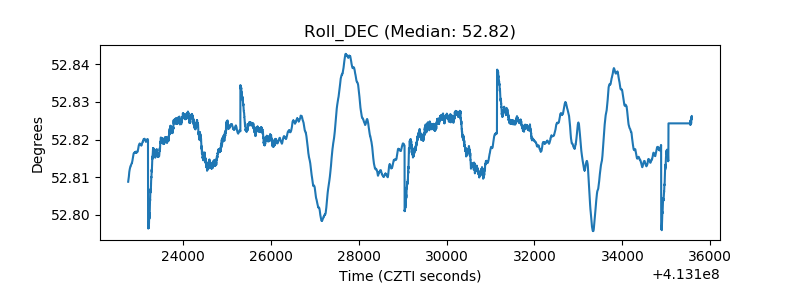 |
| _Roll_RA | 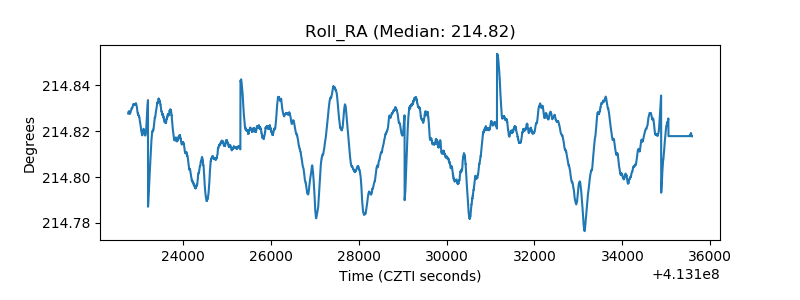 |
| Veto Counter | 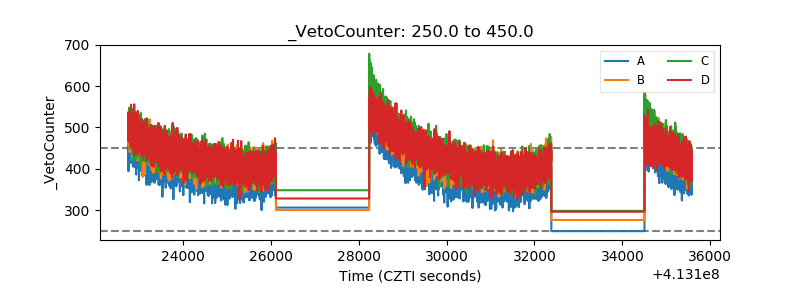 |