| Param | Original file | Final file |
|---|---|---|
| Filename | modeM0/AS1A12_022T01_9000005494_39753cztM0_level2.fits | modeM0/AS1A12_022T01_9000005494_39753cztM0_level2_quad_clean.evt |
| Size (bytes) | 476,749,440 | 83,381,760 |
| Size | 454.7 MB | 79.5 MB |
| Events in quadrant A | 3,255,961 | 597,220 |
| Events in quadrant B | 2,438,104 | 623,464 |
| Events in quadrant C | 2,764,169 | 588,957 |
| Events in quadrant D | 8,794,582 | 358,521 |
| Mode SS | |||
|---|---|---|---|
| Quadrant | BADHDUFLAG | Total packets | Discarded packets |
| A | 0 | 106 | 0 |
| B | 0 | 106 | 0 |
| C | 0 | 106 | 0 |
| D | 0 | 106 | 0 |
| Mode M0 | |||
|---|---|---|---|
| Quadrant | BADHDUFLAG | Total packets | Discarded packets |
| A | 0 | 12882 | 3 |
| B | 0 | 10569 | 2 |
| C | 0 | 11232 | 2 |
| D | 0 | 29670 | 2 |
| Mode M9 | |||
|---|---|---|---|
| Quadrant | BADHDUFLAG | Total packets | Discarded packets |
| A | 0 | 21 | 0 |
| B | 0 | 21 | 0 |
| C | 0 | 21 | 0 |
| D | 0 | 22 | 0 |
| Quadrant | Total seconds | Saturated seconds | Saturation percentage |
|---|---|---|---|
| A | 5079 | 182 | 3.583383% |
| B | 5079 | 16 | 0.315023% |
| C | 5079 | 27 | 0.531601% |
| D | 5079 | 2026 | 39.889742% |
Noise dominated data is calculated using 1-second bins in cleaned event files. If a bin has >2000 counts, and if more than 50% of those come from <1% of pixels, then it is considered to be noise-dominated and hence unusable.
| Quadrant | # 1 sec bins | Bins with >0 counts | Bins with >2000 counts | High rate bins dominated by noise | Noise dominated (total time) | Noise dominated (detector-on time) | Marked lightcurve |
|---|---|---|---|---|---|---|---|
| A | 7111 | 5080 | 146 | 146 | 2.05% | 2.87% | 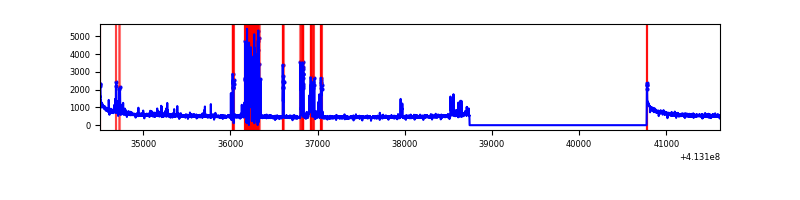 |
| B | 7111 | 5080 | 4 | 4 | 0.06% | 0.08% | 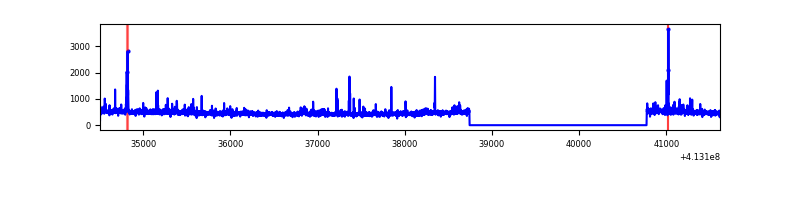 |
| C | 7111 | 5080 | 15 | 15 | 0.21% | 0.30% | 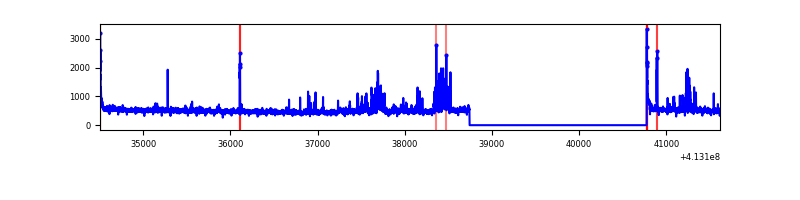 |
| D | 7111 | 5080 | 1910 | 1910 | 26.86% | 37.60% | 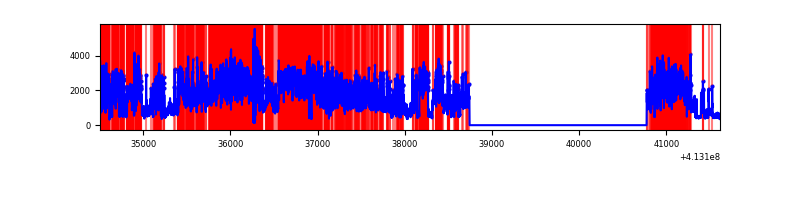 |
Top three noisy pixels from each quadrant. If the there are fewer than three noisy pixels in the level2.evt file, extra rows are filled as -1
| Pixel properties | Quadrant properties | ||||||
|---|---|---|---|---|---|---|---|
| Quadrant | DetID | PixID | Counts | Sigma | Mean | Median | Sigma |
| A | 15 | 174 | 519918 | 4520.79 | 563 | 553 | 114.9 |
| A | 10 | 83 | 459776 | 3997.29 | 563 | 553 | 114.9 |
| A | 13 | 248 | 53868 | 464.08 | 563 | 553 | 114.9 |
| B | 0 | 190 | 50171 | 451.04 | 574 | 558 | 110.0 |
| B | 5 | 255 | 47935 | 430.72 | 574 | 558 | 110.0 |
| B | 4 | 170 | 33661 | 300.95 | 574 | 558 | 110.0 |
| C | 15 | 214 | 210088 | 1606.07 | 562 | 567 | 130.5 |
| C | 9 | 187 | 187294 | 1431.34 | 562 | 567 | 130.5 |
| C | 15 | 208 | 86846 | 661.37 | 562 | 567 | 130.5 |
| D | 12 | 227 | 6663870 | 56954.27 | 479 | 466 | 117.0 |
| D | 13 | 249 | 70785 | 601.04 | 479 | 466 | 117.0 |
| D | 5 | 32 | 66408 | 563.63 | 479 | 466 | 117.0 |
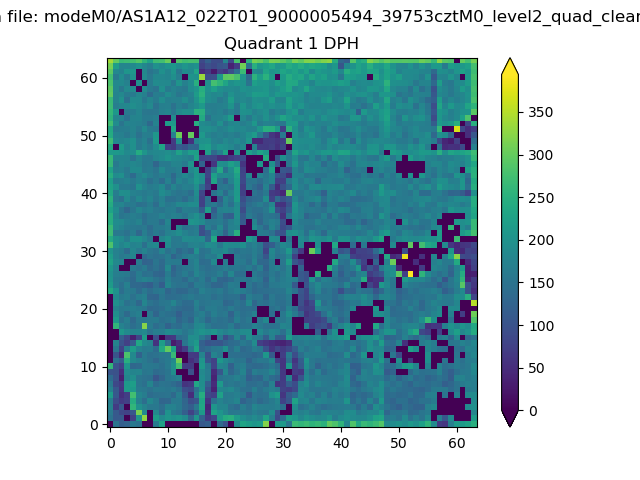
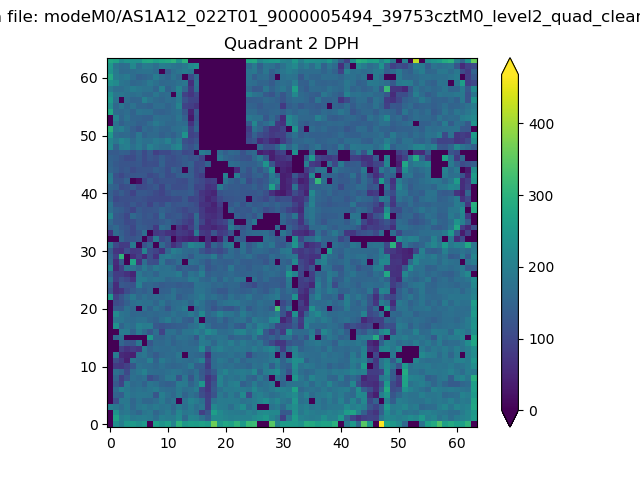
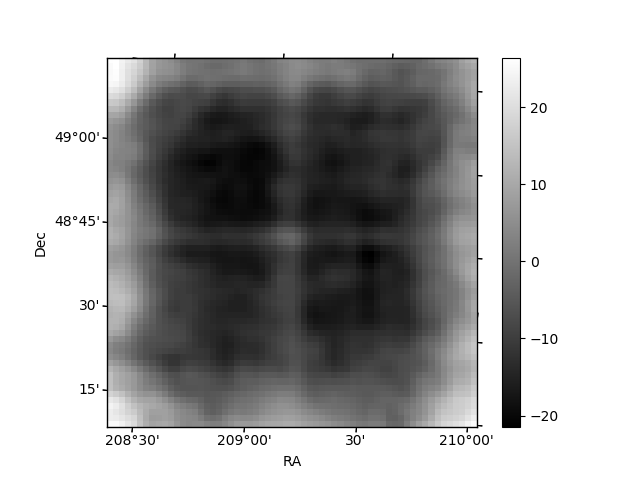
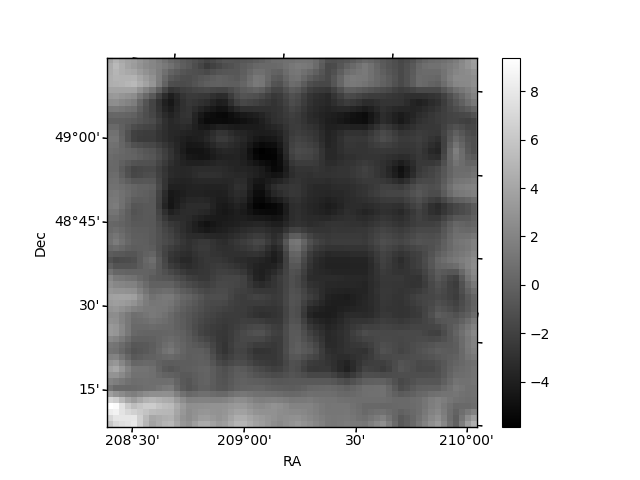
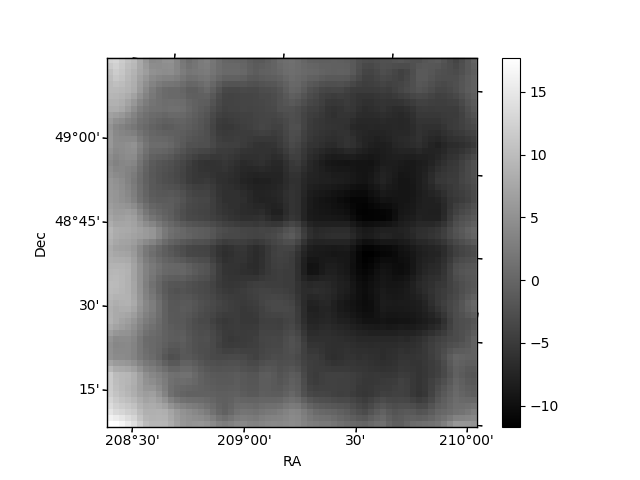
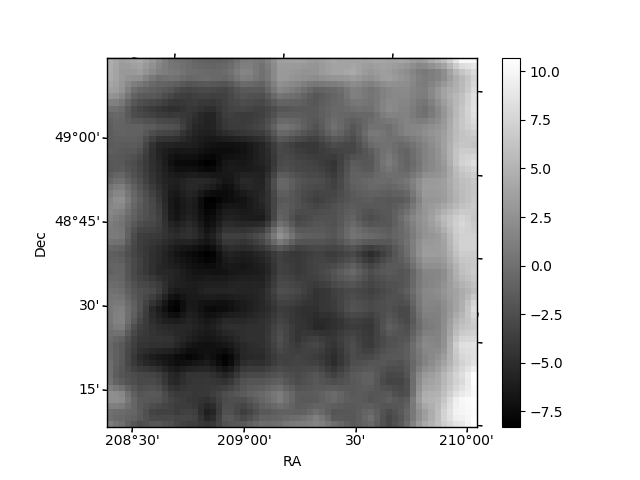
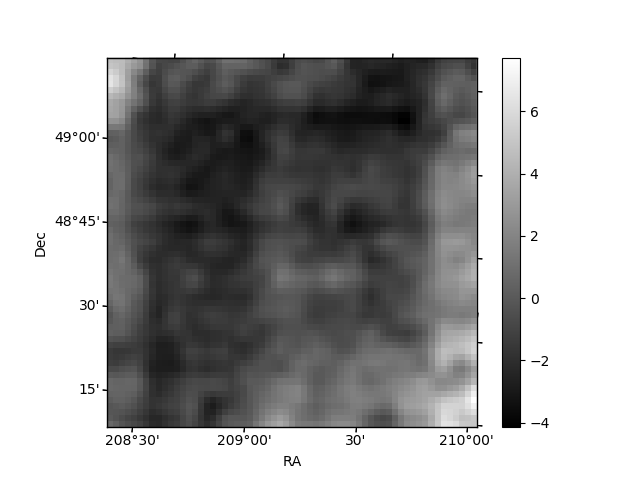
Histogram calculated using DETX and DETY for each event in the final _common_clean file
| Quadrant A |  |
 |
Quadrant B |
|---|---|---|---|
| Quadrant D | 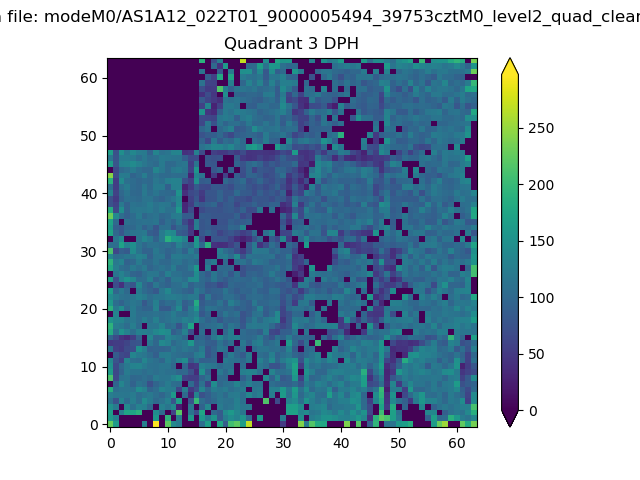 |
 |
Quadrant C |
| Plot type | Count rate plots | Images |
|---|---|---|
| Comparison with Poisson distribution Blue bars denote a histogram of data divided into 1 sec bins. Red curve is a Poisson curve with rate = median count rate of data. |
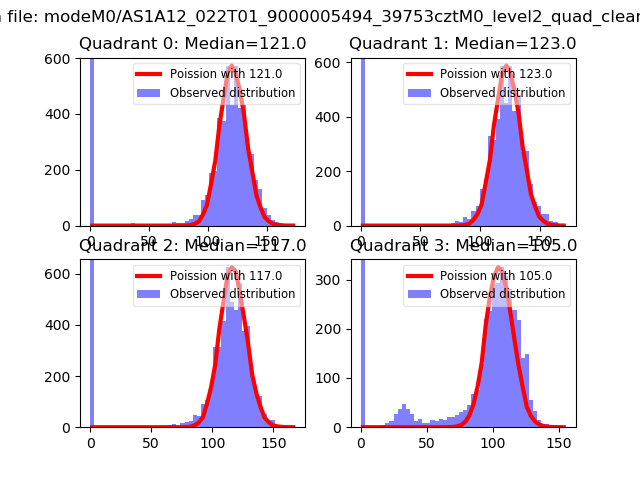 |
 |
| Quadrant-wise count rates Data is divided into 100 sec bins |
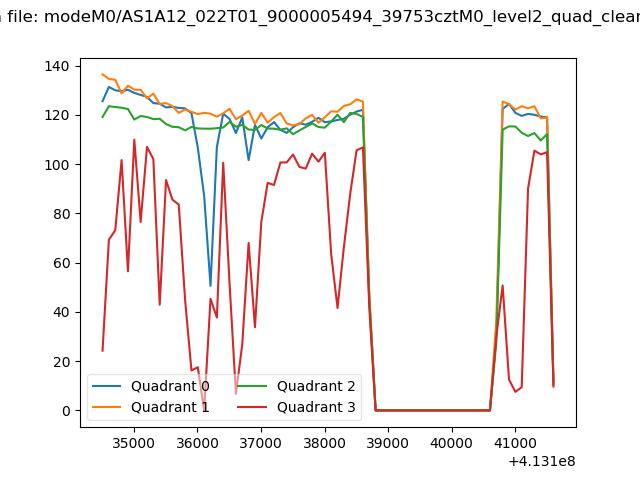 |
|
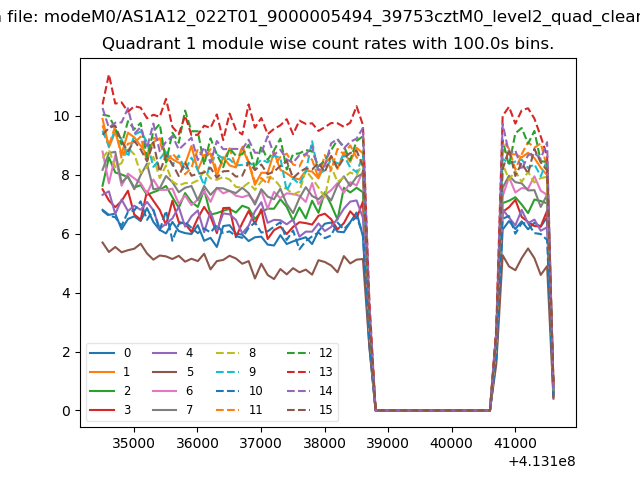
| Module-wise count rates for Quadrant A Data is divided into 100 sec bins |
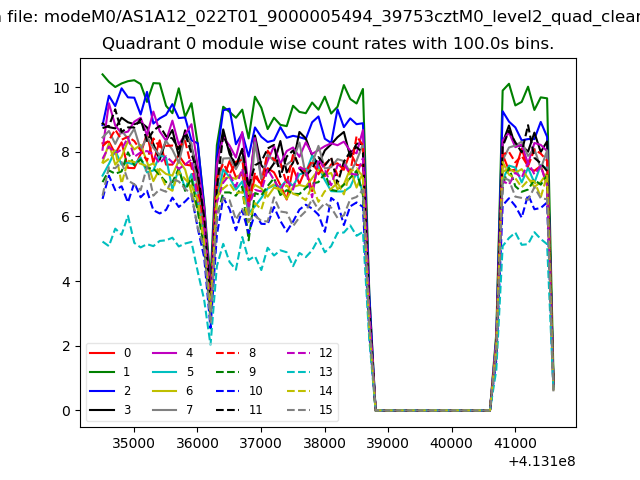 |
 |
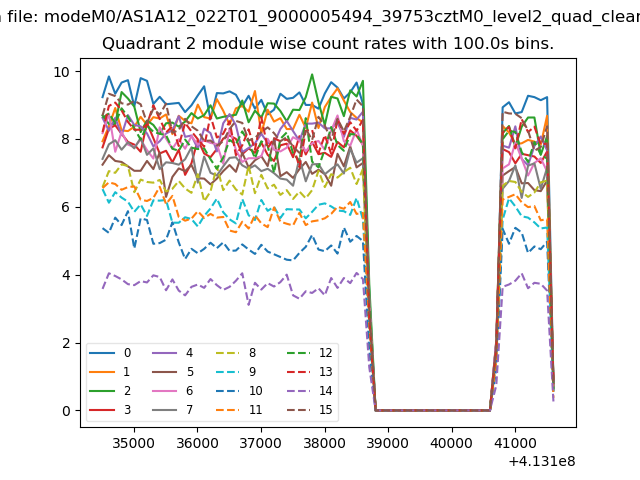
| Module-wise count rates for Quadrant B Data is divided into 100 sec bins |
 |
 |
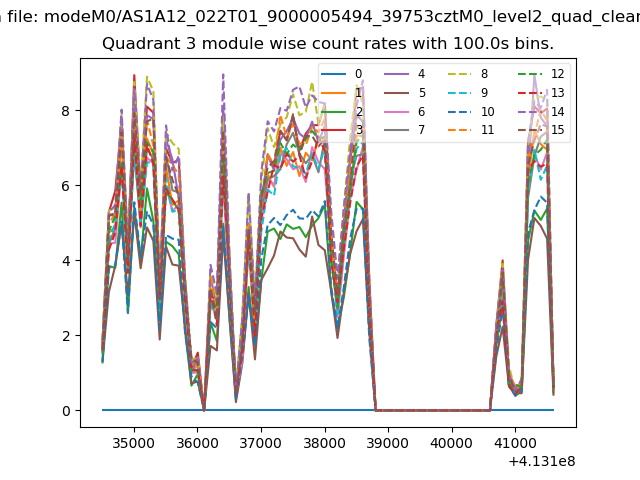
| Module-wise count rates for Quadrant C Data is divided into 100 sec bins |
 |
 |
| Module-wise count rates for Quadrant D Data is divided into 100 sec bins |
 |
 |
| Parameter | Plot |
|---|---|
| CZT HV Monitor | 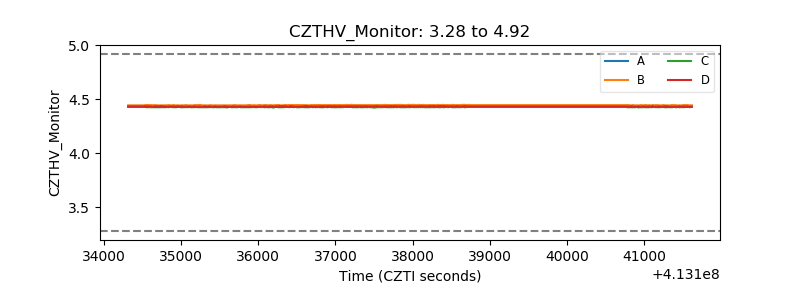 |
| D_VDD | 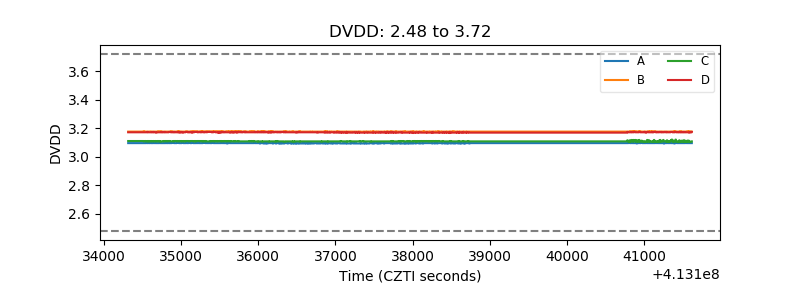 |
| Temperature 1 | 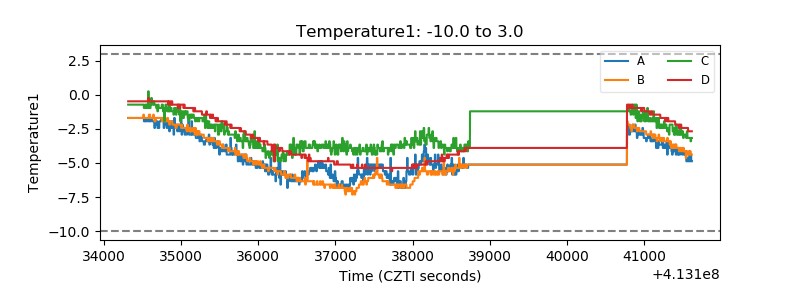 |
| Veto HV Monitor | 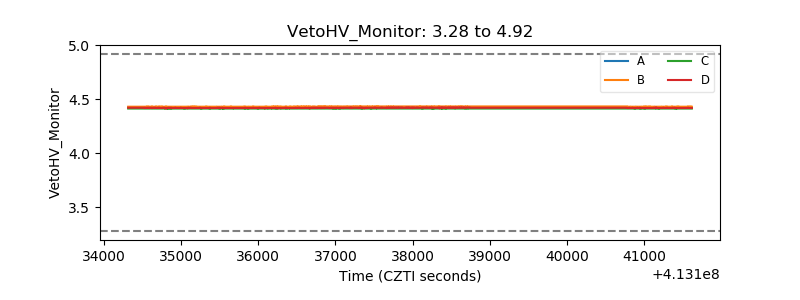 |
| Veto LLD | 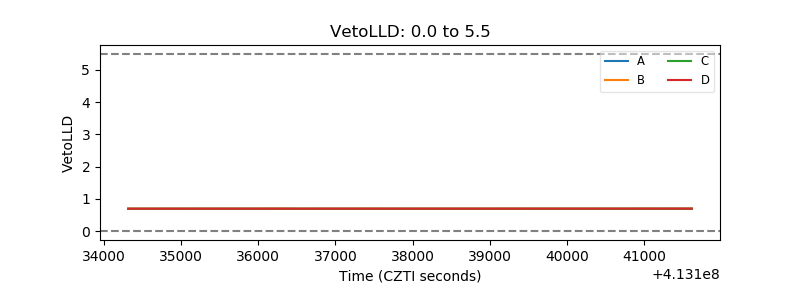 |
| Alpha Counter | 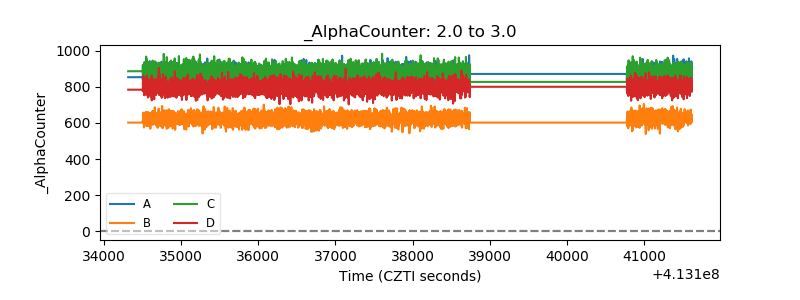 |
| _CPM_Rate | 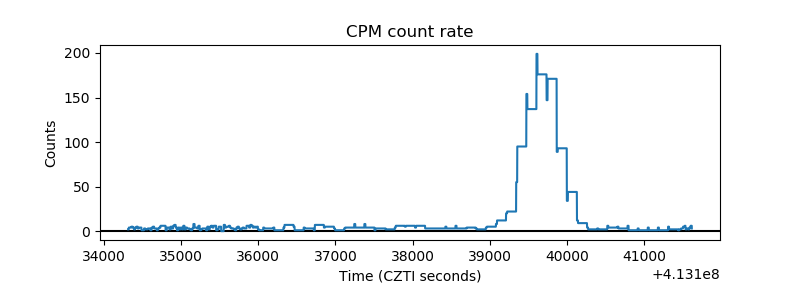 |
| CZT Counter | 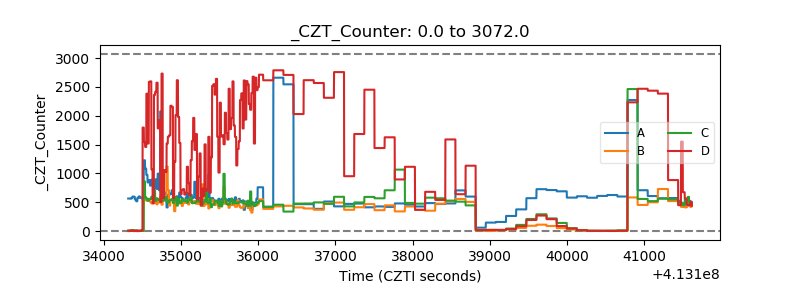 |
| +2.5 Volts monitor | 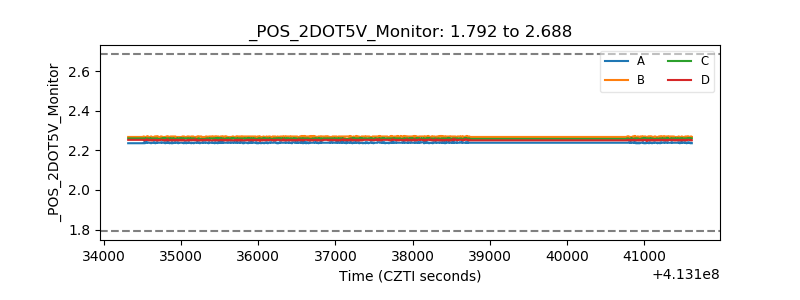 |
| +5 Volts monitor | 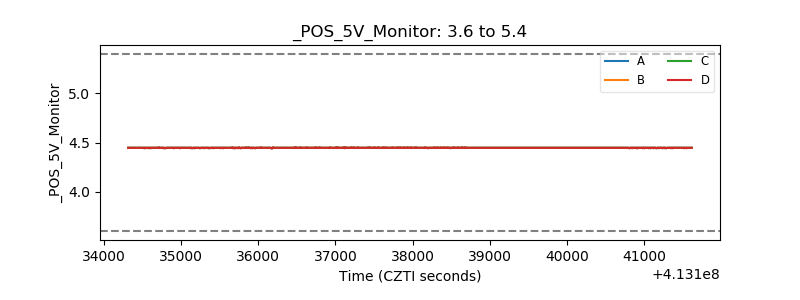 |
| _ROLL_ROT | 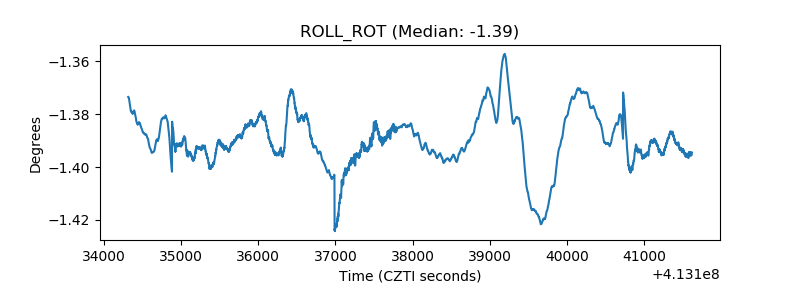 |
| _Roll_DEC | 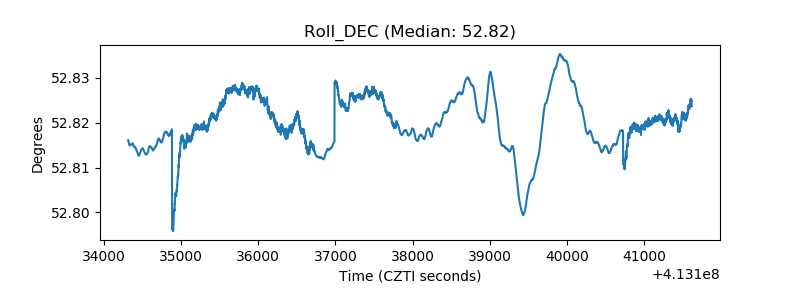 |
| _Roll_RA | 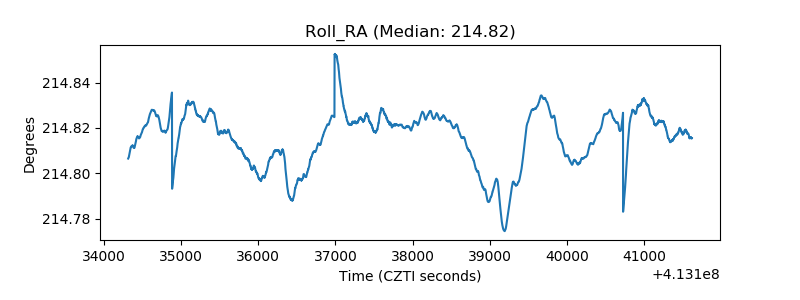 |
| Veto Counter | 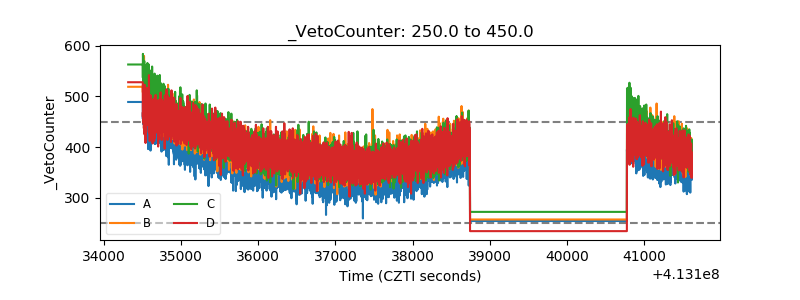 |