| Param | Original file | Final file |
|---|---|---|
| Filename | modeM0/AS1A12_022T01_9000005494_39755cztM0_level2.fits | modeM0/AS1A12_022T01_9000005494_39755cztM0_level2_quad_clean.evt |
| Size (bytes) | 361,437,120 | 93,499,200 |
| Size | 344.7 MB | 89.2 MB |
| Events in quadrant A | 3,614,140 | 632,622 |
| Events in quadrant B | 2,661,180 | 650,066 |
| Events in quadrant C | 2,864,043 | 620,409 |
| Events in quadrant D | 3,798,383 | 531,985 |
| Mode SS | |||
|---|---|---|---|
| Quadrant | BADHDUFLAG | Total packets | Discarded packets |
| A | 0 | 114 | 0 |
| B | 0 | 114 | 0 |
| C | 0 | 114 | 0 |
| D | 0 | 114 | 0 |
| Mode M0 | |||
|---|---|---|---|
| Quadrant | BADHDUFLAG | Total packets | Discarded packets |
| A | 0 | 14595 | 2 |
| B | 0 | 11817 | 1 |
| C | 0 | 12140 | 1 |
| D | 0 | 15403 | 1 |
| Mode M9 | |||
|---|---|---|---|
| Quadrant | BADHDUFLAG | Total packets | Discarded packets |
| A | 0 | 26 | 0 |
| B | 0 | 26 | 0 |
| C | 0 | 26 | 0 |
| D | 0 | 27 | 0 |
| Quadrant | Total seconds | Saturated seconds | Saturation percentage |
|---|---|---|---|
| A | 5668 | 133 | 2.346507% |
| B | 5668 | 22 | 0.388144% |
| C | 5668 | 14 | 0.247001% |
| D | 5668 | 453 | 7.992237% |
Noise dominated data is calculated using 1-second bins in cleaned event files. If a bin has >2000 counts, and if more than 50% of those come from <1% of pixels, then it is considered to be noise-dominated and hence unusable.
| Quadrant | # 1 sec bins | Bins with >0 counts | Bins with >2000 counts | High rate bins dominated by noise | Noise dominated (total time) | Noise dominated (detector-on time) | Marked lightcurve |
|---|---|---|---|---|---|---|---|
| A | 7131 | 5669 | 54 | 54 | 0.76% | 0.95% | 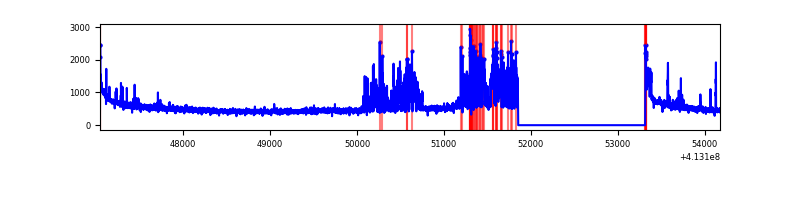 |
| B | 7131 | 5669 | 9 | 9 | 0.13% | 0.16% | 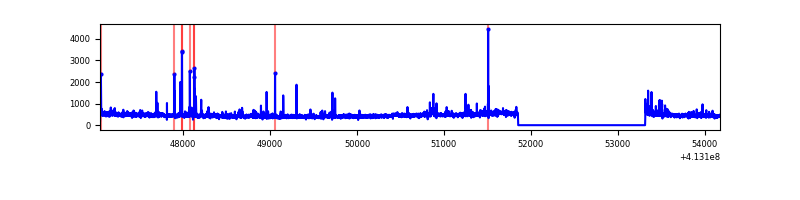 |
| C | 7131 | 5669 | 5 | 5 | 0.07% | 0.09% | 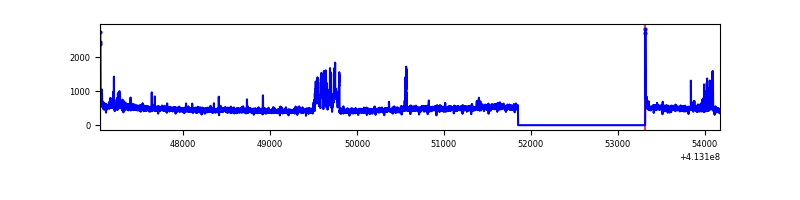 |
| D | 7131 | 5668 | 364 | 364 | 5.10% | 6.42% | 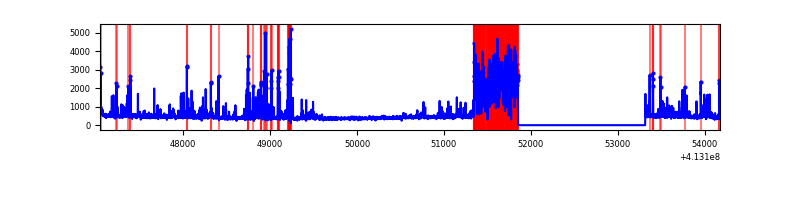 |
Top three noisy pixels from each quadrant. If the there are fewer than three noisy pixels in the level2.evt file, extra rows are filled as -1
| Pixel properties | Quadrant properties | ||||||
|---|---|---|---|---|---|---|---|
| Quadrant | DetID | PixID | Counts | Sigma | Mean | Median | Sigma |
| A | 6 | 10 | 677025 | 5392.27 | 615 | 604 | 125.4 |
| A | 10 | 83 | 466651 | 3715.22 | 615 | 604 | 125.4 |
| A | 15 | 174 | 36345 | 284.92 | 615 | 604 | 125.4 |
| B | 5 | 255 | 62934 | 526.52 | 615 | 598 | 118.4 |
| B | 4 | 170 | 58480 | 488.9 | 615 | 598 | 118.4 |
| B | 0 | 190 | 34232 | 284.09 | 615 | 598 | 118.4 |
| C | 15 | 214 | 233771 | 1659.69 | 602 | 604 | 140.5 |
| C | 3 | 233 | 152059 | 1078.06 | 602 | 604 | 140.5 |
| C | 15 | 208 | 54093 | 380.74 | 602 | 604 | 140.5 |
| D | 2 | 250 | 1043412 | 7455.5 | 569 | 552 | 139.9 |
| D | 12 | 227 | 258889 | 1846.88 | 569 | 552 | 139.9 |
| D | 13 | 249 | 102708 | 730.32 | 569 | 552 | 139.9 |
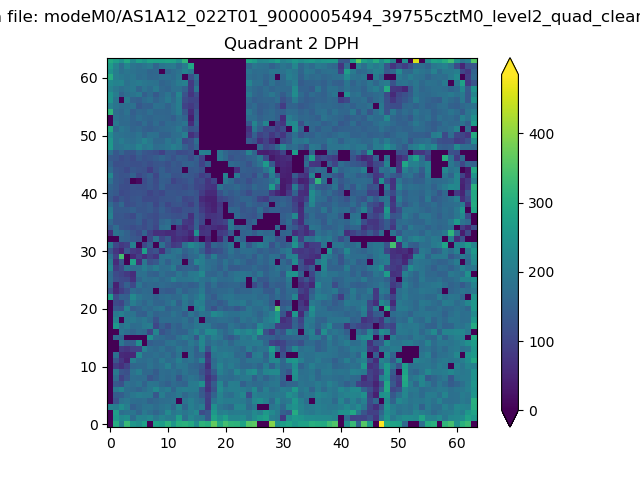
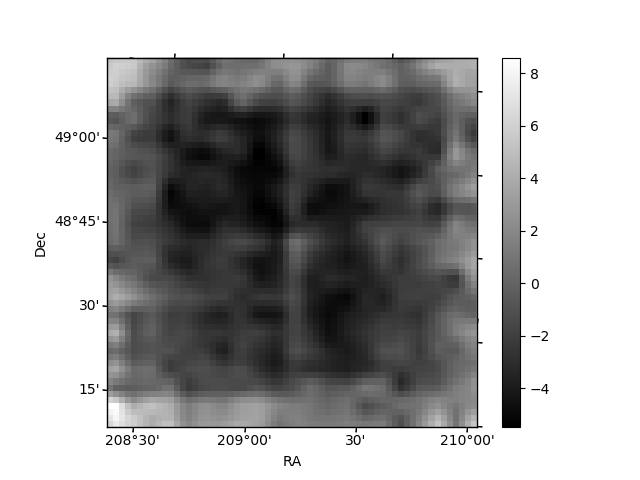
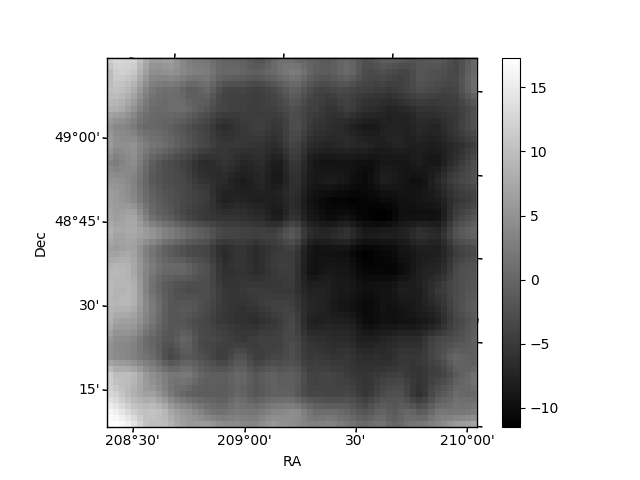
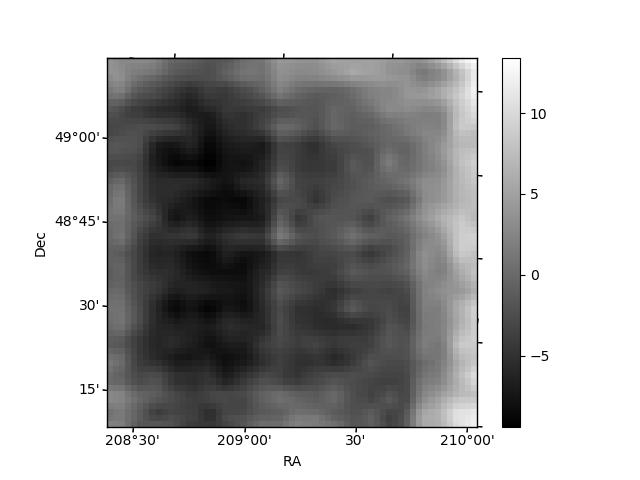
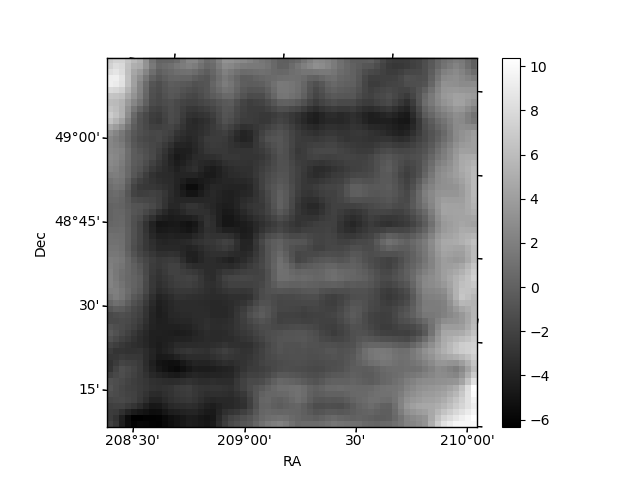
Histogram calculated using DETX and DETY for each event in the final _common_clean file
| Quadrant A | 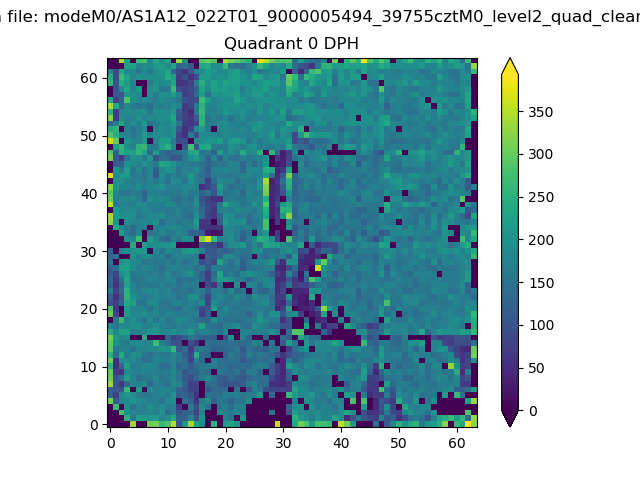 |
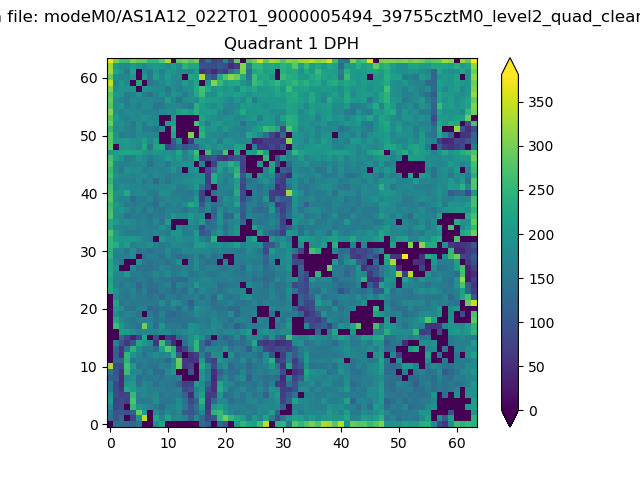 |
Quadrant B |
|---|---|---|---|
| Quadrant D | 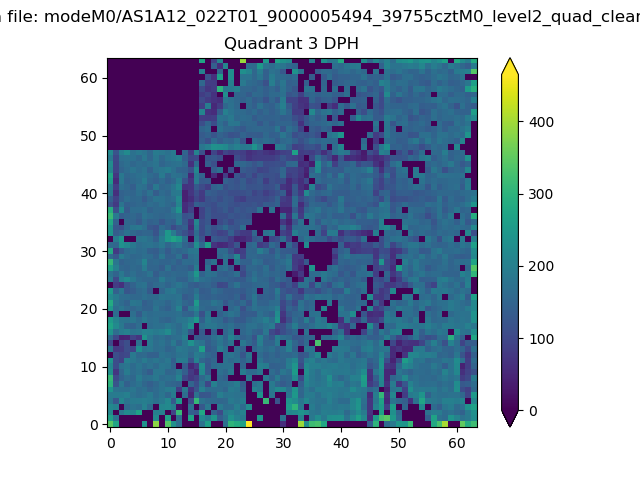 |
 |
Quadrant C |
| Plot type | Count rate plots | Images |
|---|---|---|
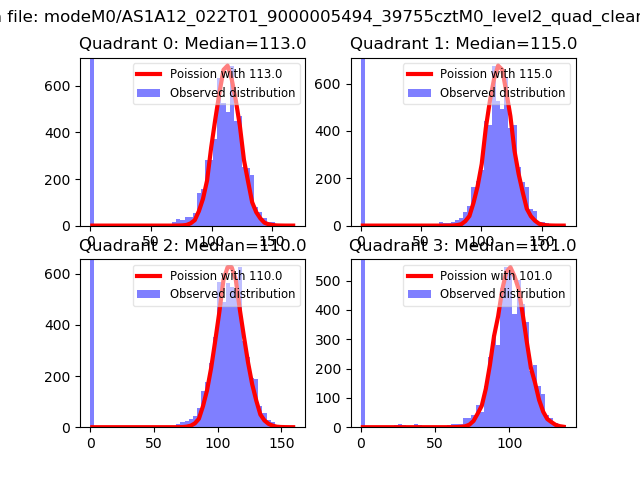
| Comparison with Poisson distribution Blue bars denote a histogram of data divided into 1 sec bins. Red curve is a Poisson curve with rate = median count rate of data. |
 |
 |
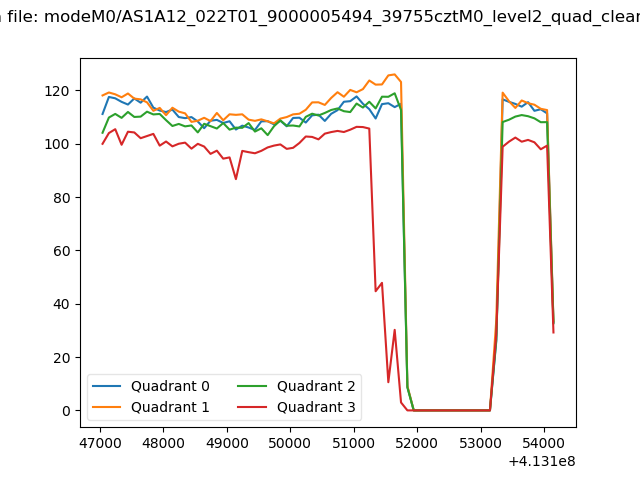
| Quadrant-wise count rates Data is divided into 100 sec bins |
 |
|
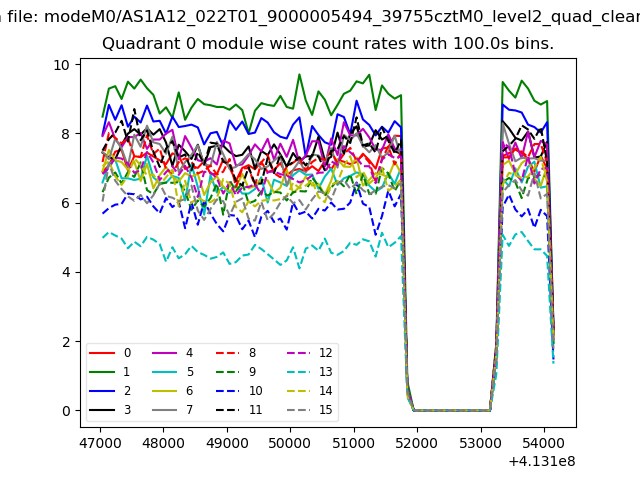
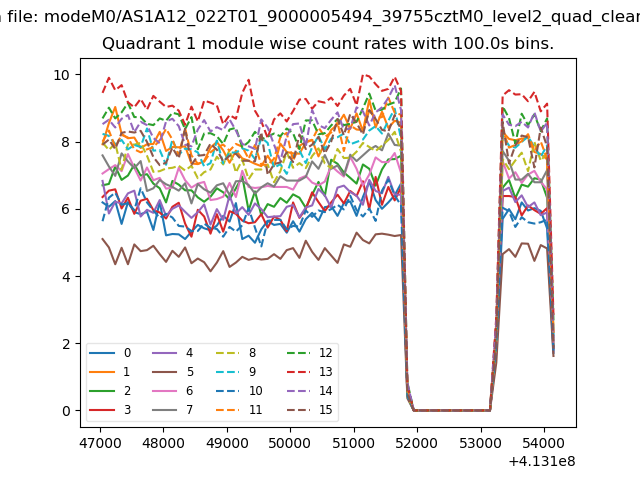
| Module-wise count rates for Quadrant A Data is divided into 100 sec bins |
 |
 |
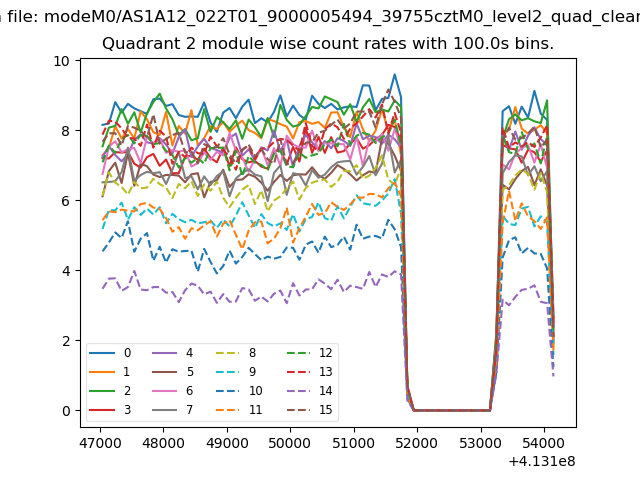
| Module-wise count rates for Quadrant B Data is divided into 100 sec bins |
 |
 |
| Module-wise count rates for Quadrant C Data is divided into 100 sec bins |
 |
 |
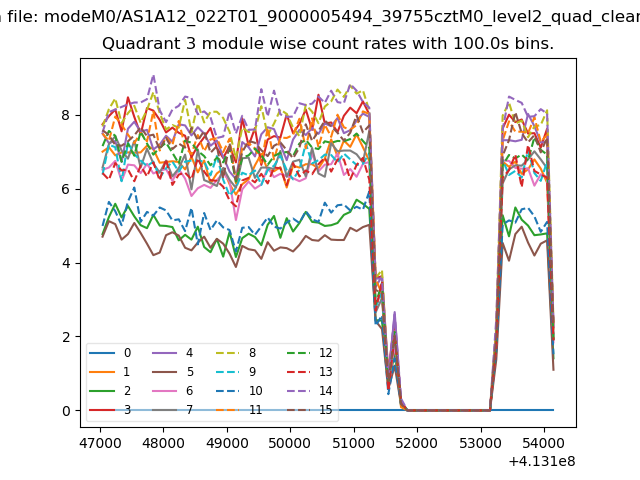
| Module-wise count rates for Quadrant D Data is divided into 100 sec bins |
 |
 |
| Parameter | Plot |
|---|---|
| CZT HV Monitor | 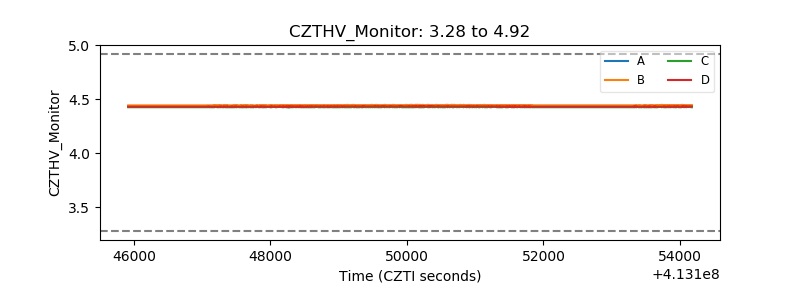 |
| D_VDD | 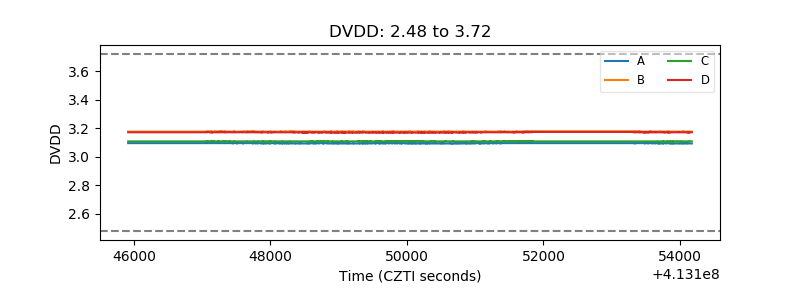 |
| Temperature 1 | 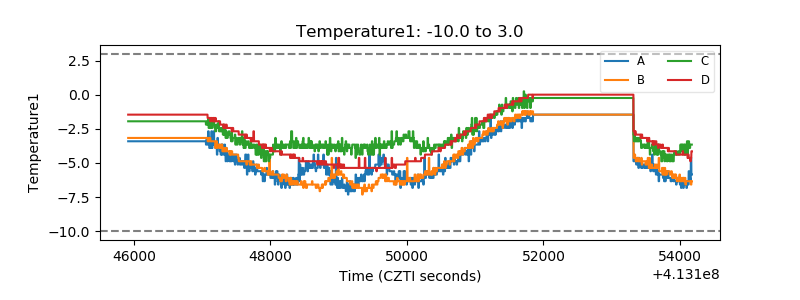 |
| Veto HV Monitor | 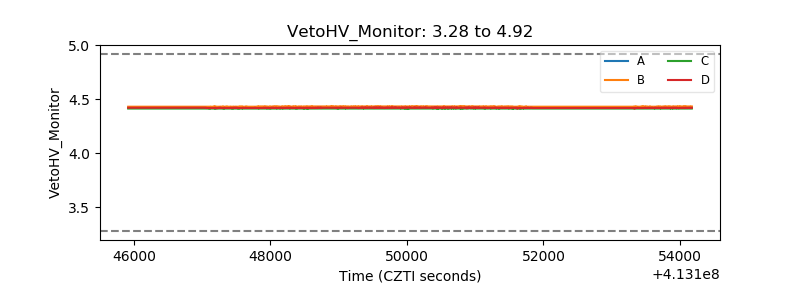 |
| Veto LLD | 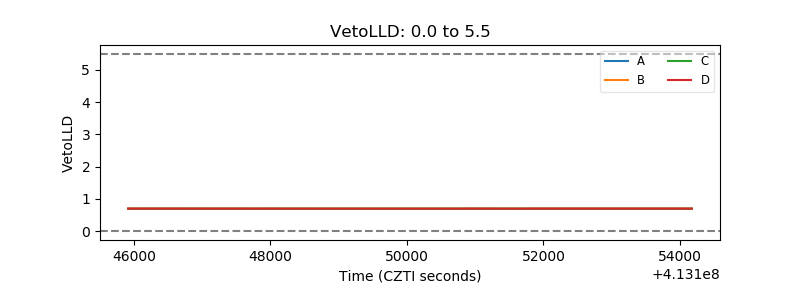 |
| Alpha Counter | 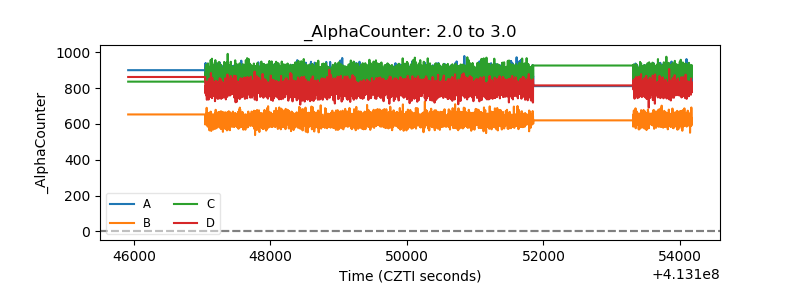 |
| _CPM_Rate | 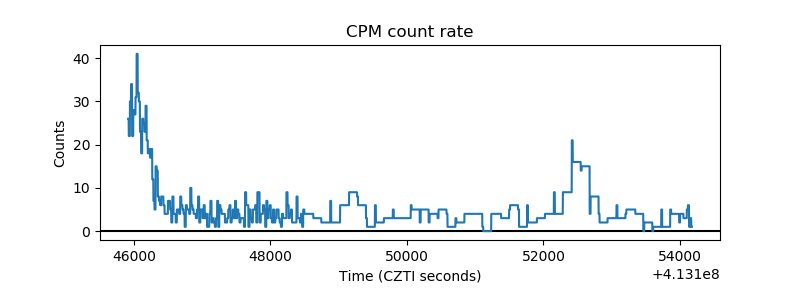 |
| CZT Counter | 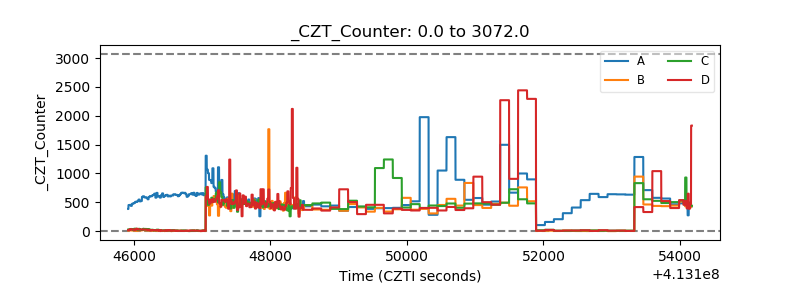 |
| +2.5 Volts monitor |  |
| +5 Volts monitor | 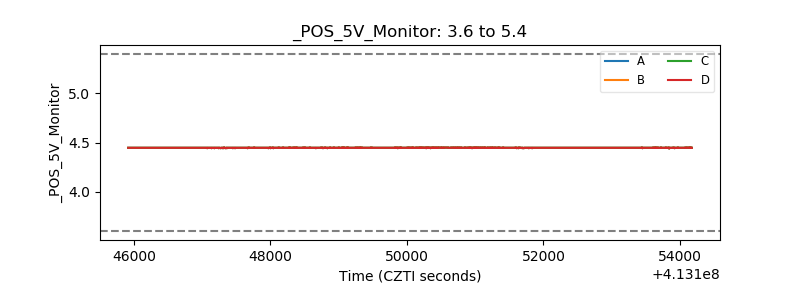 |
| _ROLL_ROT | 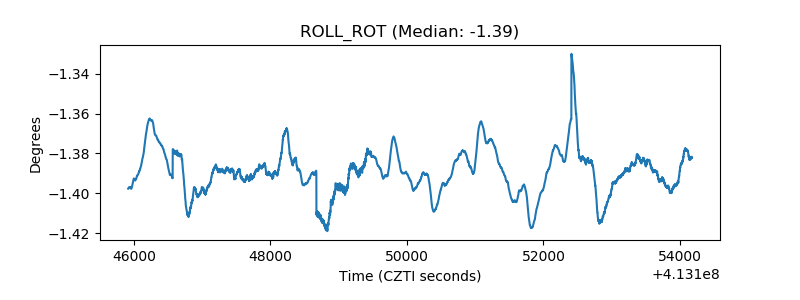 |
| _Roll_DEC | 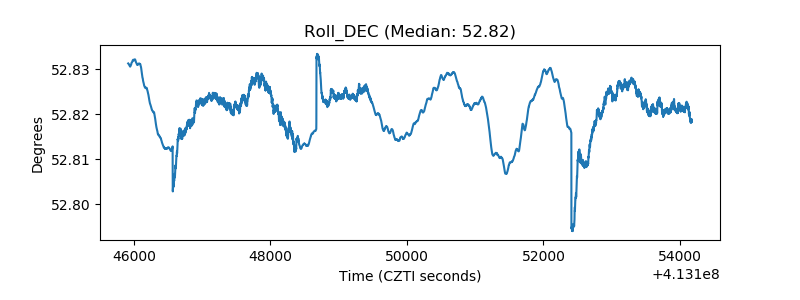 |
| _Roll_RA | 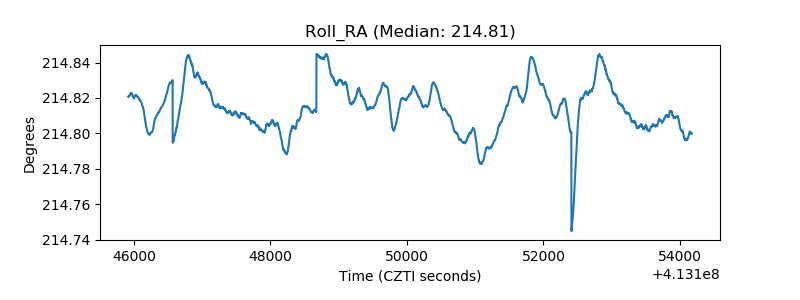 |
| Veto Counter | 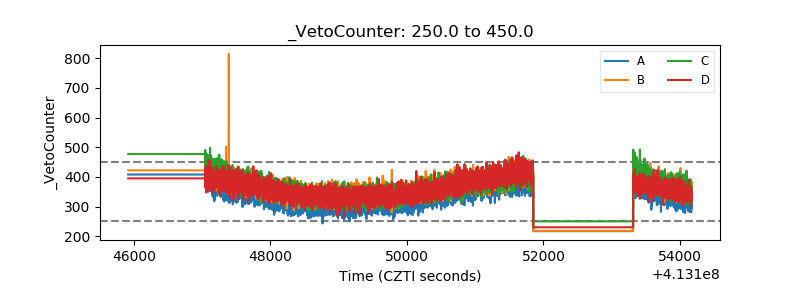 |