| Param | Original file | Final file |
|---|---|---|
| Filename | modeM0/AS1A12_022T01_9000005494_39756cztM0_level2.fits | modeM0/AS1A12_022T01_9000005494_39756cztM0_level2_quad_clean.evt |
| Size (bytes) | 393,984,000 | 103,921,920 |
| Size | 375.7 MB | 99.1 MB |
| Events in quadrant A | 3,645,207 | 703,267 |
| Events in quadrant B | 3,014,498 | 720,447 |
| Events in quadrant C | 3,146,480 | 690,047 |
| Events in quadrant D | 4,285,211 | 590,786 |
| Mode SS | |||
|---|---|---|---|
| Quadrant | BADHDUFLAG | Total packets | Discarded packets |
| A | 0 | 132 | 0 |
| B | 0 | 132 | 0 |
| C | 0 | 132 | 0 |
| D | 0 | 132 | 0 |
| Mode M0 | |||
|---|---|---|---|
| Quadrant | BADHDUFLAG | Total packets | Discarded packets |
| A | 0 | 15074 | 2 |
| B | 0 | 13314 | 1 |
| C | 0 | 13460 | 1 |
| D | 0 | 17252 | 1 |
| Mode M9 | |||
|---|---|---|---|
| Quadrant | BADHDUFLAG | Total packets | Discarded packets |
| A | 0 | 28 | 0 |
| B | 0 | 28 | 0 |
| C | 0 | 28 | 0 |
| D | 0 | 28 | 0 |
| Quadrant | Total seconds | Saturated seconds | Saturation percentage |
|---|---|---|---|
| A | 6330 | 91 | 1.437599% |
| B | 6330 | 29 | 0.458136% |
| C | 6330 | 13 | 0.205371% |
| D | 6330 | 487 | 7.693523% |
Noise dominated data is calculated using 1-second bins in cleaned event files. If a bin has >2000 counts, and if more than 50% of those come from <1% of pixels, then it is considered to be noise-dominated and hence unusable.
| Quadrant | # 1 sec bins | Bins with >0 counts | Bins with >2000 counts | High rate bins dominated by noise | Noise dominated (total time) | Noise dominated (detector-on time) | Marked lightcurve |
|---|---|---|---|---|---|---|---|
| A | 9104 | 6332 | 32 | 32 | 0.35% | 0.51% | 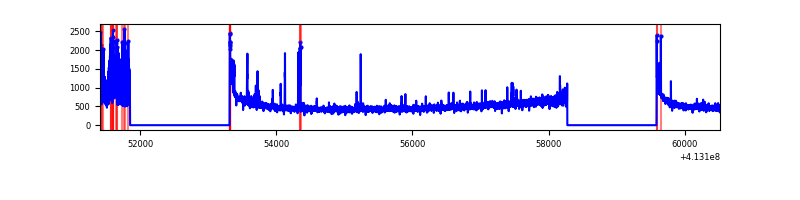 |
| B | 9104 | 6332 | 14 | 14 | 0.15% | 0.22% | 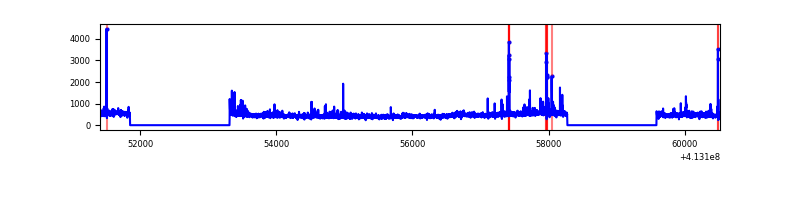 |
| C | 9104 | 6332 | 4 | 4 | 0.04% | 0.06% | 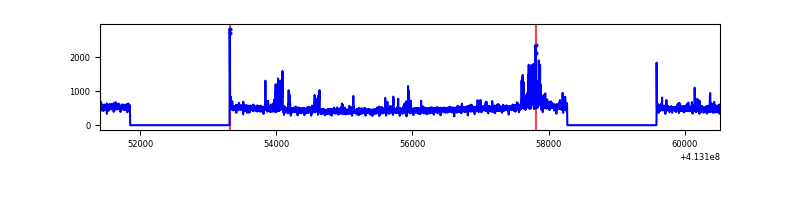 |
| D | 9104 | 6331 | 380 | 380 | 4.17% | 6.00% | 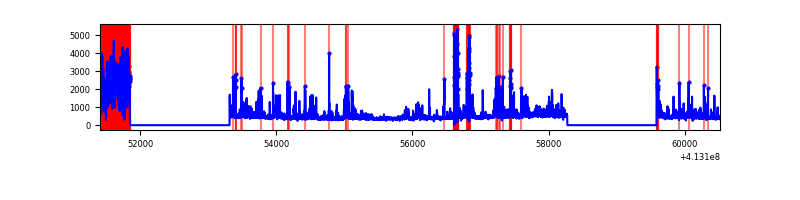 |
Top three noisy pixels from each quadrant. If the there are fewer than three noisy pixels in the level2.evt file, extra rows are filled as -1
| Pixel properties | Quadrant properties | ||||||
|---|---|---|---|---|---|---|---|
| Quadrant | DetID | PixID | Counts | Sigma | Mean | Median | Sigma |
| A | 10 | 83 | 506667 | 3642.87 | 694 | 681 | 138.9 |
| A | 6 | 10 | 298189 | 2141.92 | 694 | 681 | 138.9 |
| A | 9 | 143 | 60895 | 433.51 | 694 | 681 | 138.9 |
| B | 5 | 255 | 91820 | 678.98 | 691 | 671 | 134.2 |
| B | 0 | 190 | 60408 | 444.99 | 691 | 671 | 134.2 |
| B | 4 | 170 | 47320 | 347.5 | 691 | 671 | 134.2 |
| C | 15 | 214 | 261393 | 1643.56 | 676 | 678 | 158.6 |
| C | 15 | 208 | 212847 | 1337.52 | 676 | 678 | 158.6 |
| C | 0 | 10 | 17964 | 108.97 | 676 | 678 | 158.6 |
| D | 2 | 250 | 884582 | 5641.37 | 641 | 621 | 156.7 |
| D | 12 | 227 | 471576 | 3005.6 | 641 | 621 | 156.7 |
| D | 12 | 233 | 171795 | 1092.42 | 641 | 621 | 156.7 |
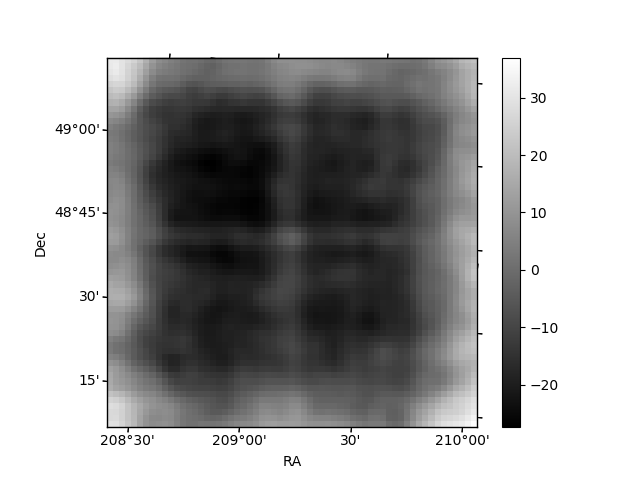
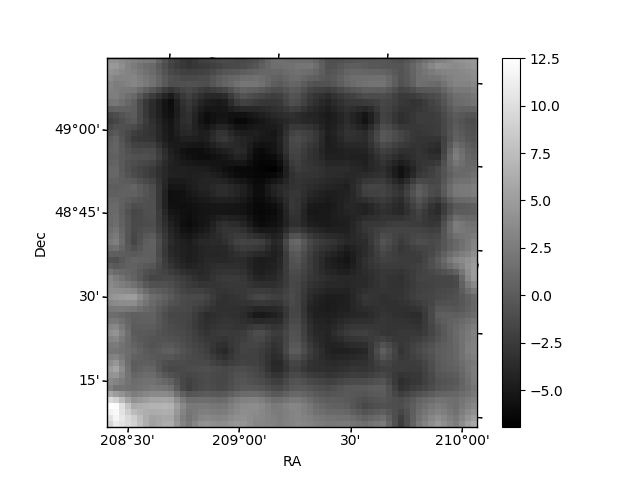
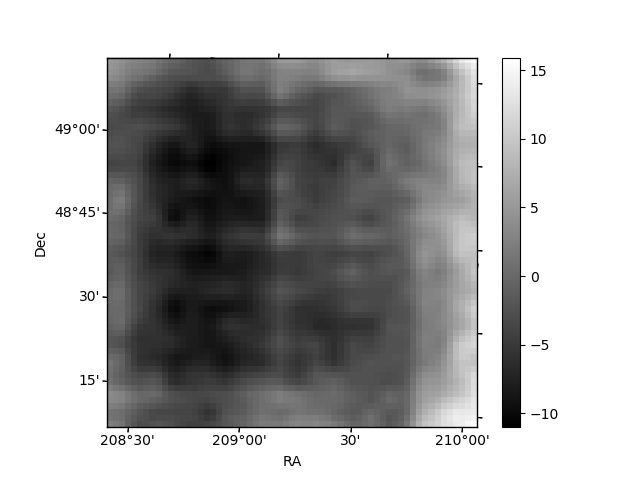
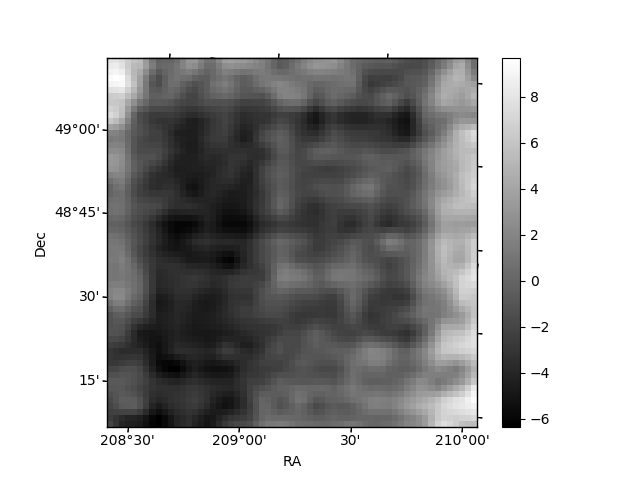
Histogram calculated using DETX and DETY for each event in the final _common_clean file
| Quadrant A | 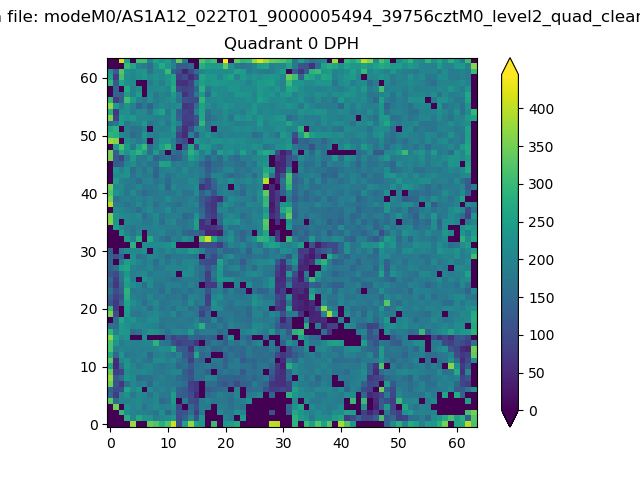 |
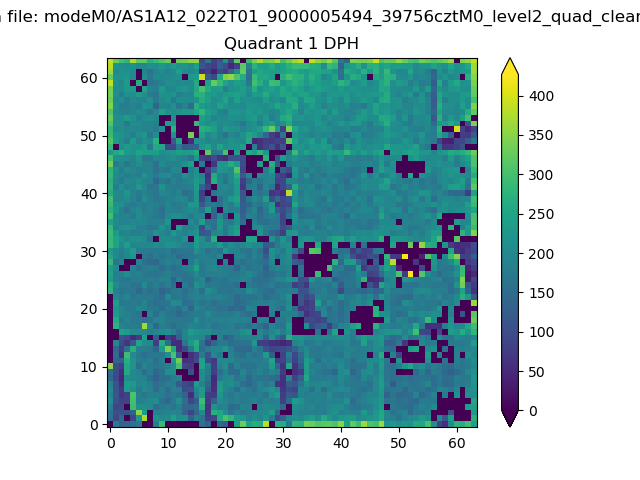 |
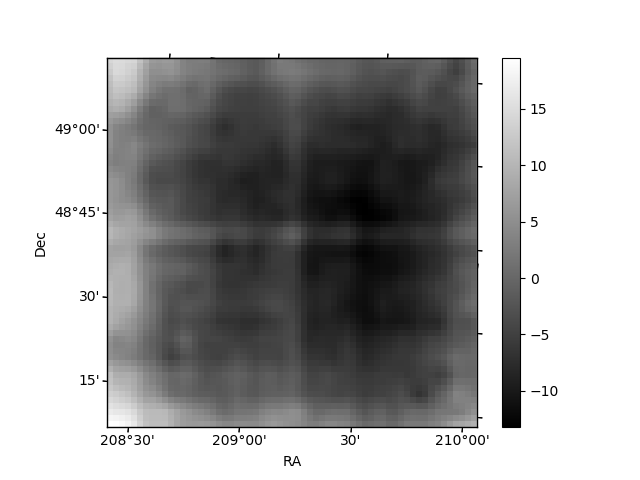
Quadrant B |
|---|---|---|---|
| Quadrant D | 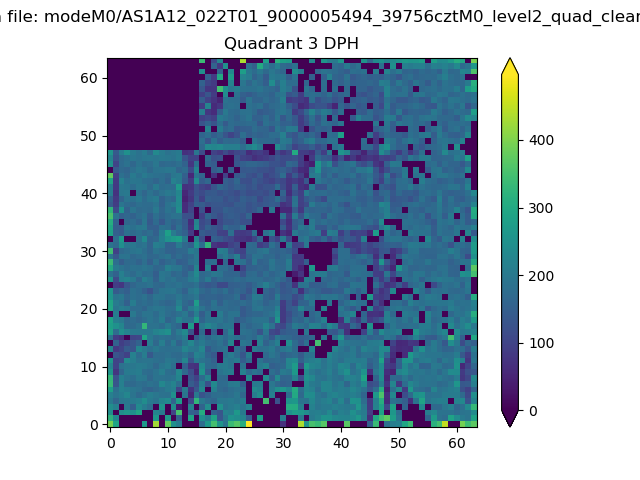 |
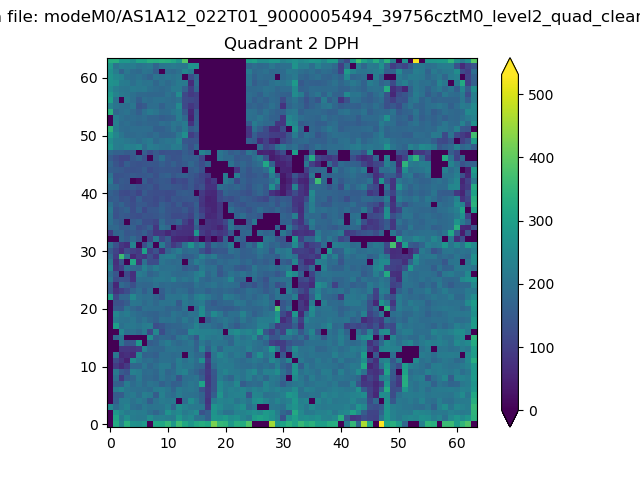 |
Quadrant C |
| Plot type | Count rate plots | Images |
|---|---|---|
| Comparison with Poisson distribution Blue bars denote a histogram of data divided into 1 sec bins. Red curve is a Poisson curve with rate = median count rate of data. |
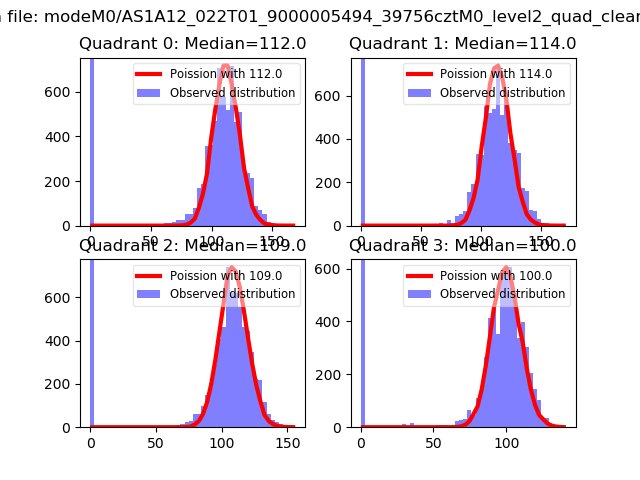 |
 |
| Quadrant-wise count rates Data is divided into 100 sec bins |
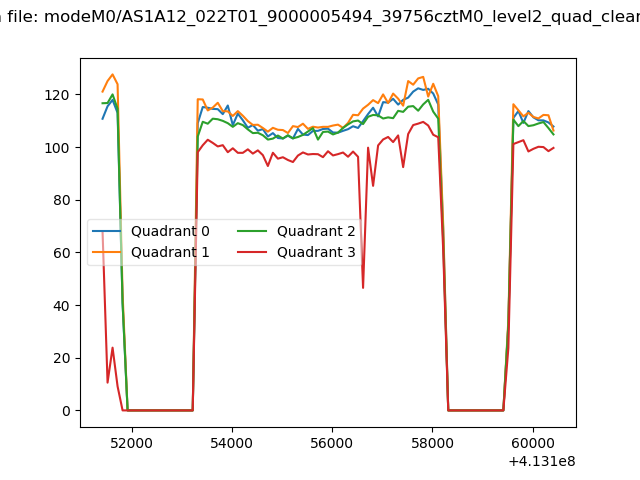 |
|
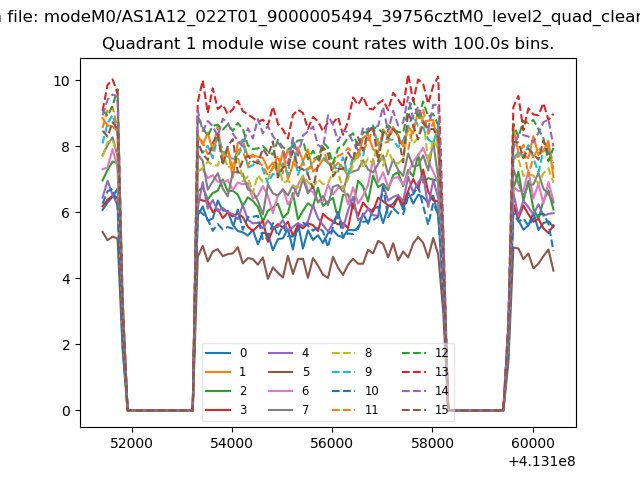
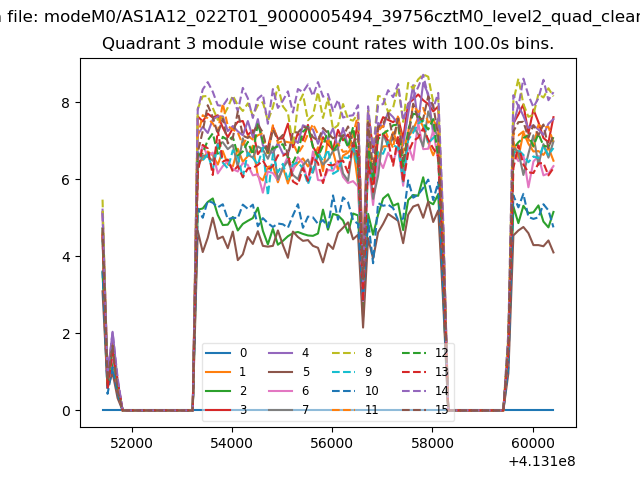
| Module-wise count rates for Quadrant A Data is divided into 100 sec bins |
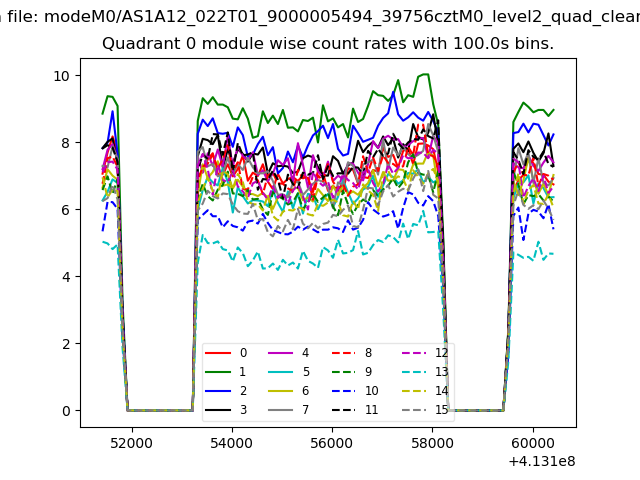 |
 |
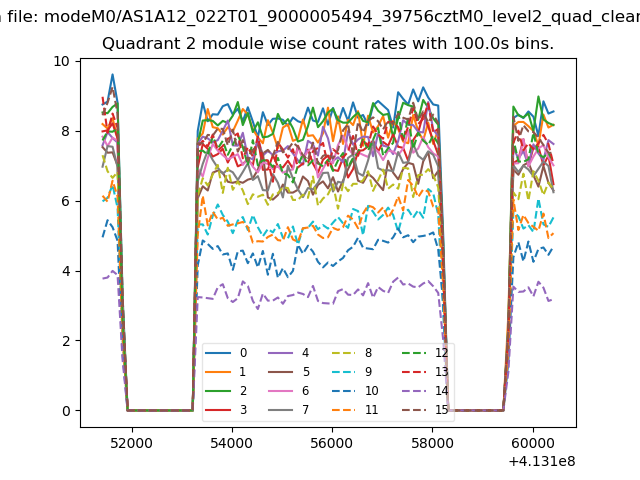
| Module-wise count rates for Quadrant B Data is divided into 100 sec bins |
 |
 |
| Module-wise count rates for Quadrant C Data is divided into 100 sec bins |
 |
 |
| Module-wise count rates for Quadrant D Data is divided into 100 sec bins |
 |
 |
| Parameter | Plot |
|---|---|
| CZT HV Monitor | 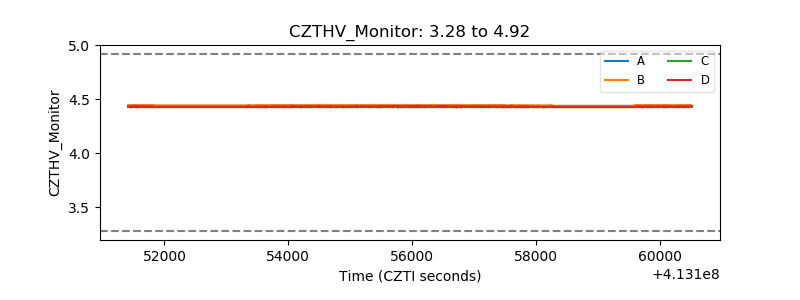 |
| D_VDD | 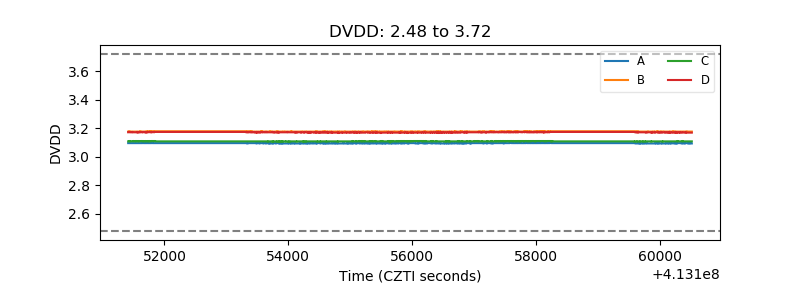 |
| Temperature 1 | 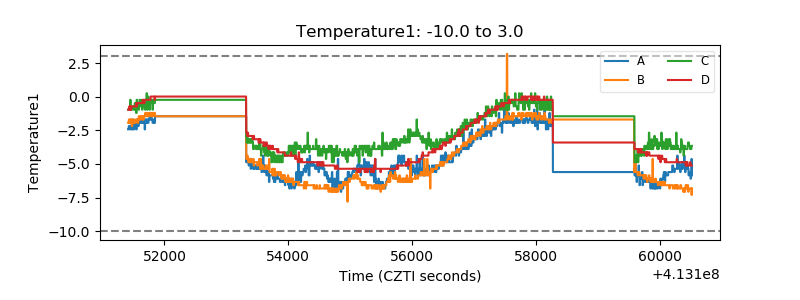 |
| Veto HV Monitor | 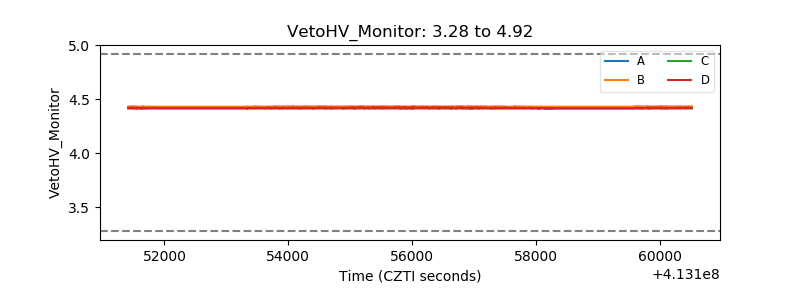 |
| Veto LLD | 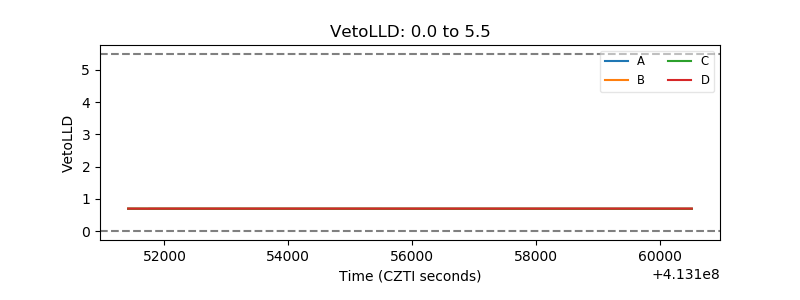 |
| Alpha Counter | 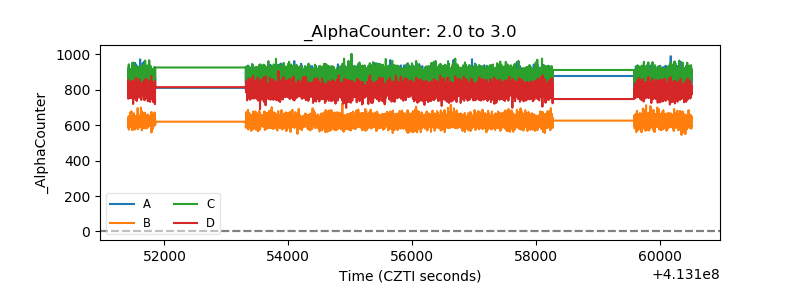 |
| _CPM_Rate | 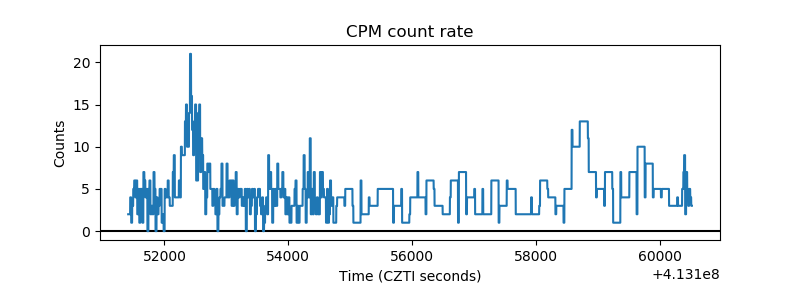 |
| CZT Counter | 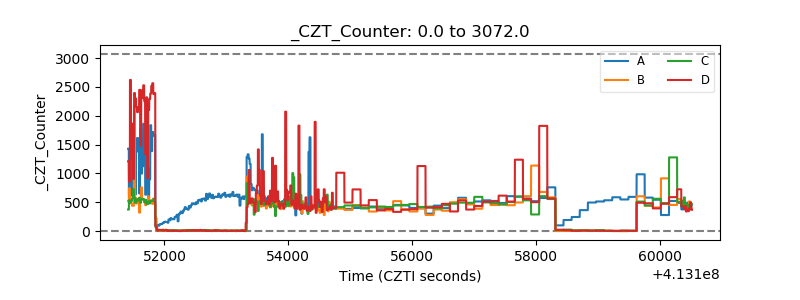 |
| +2.5 Volts monitor | 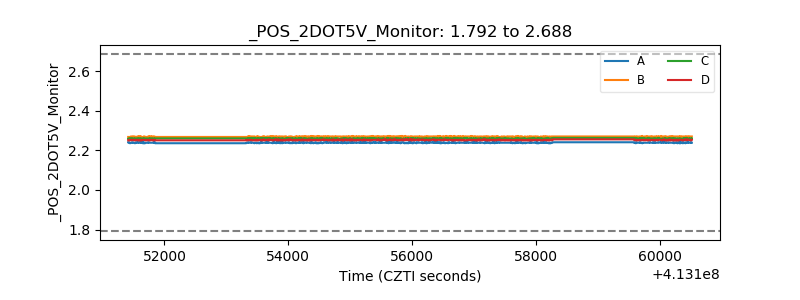 |
| +5 Volts monitor | 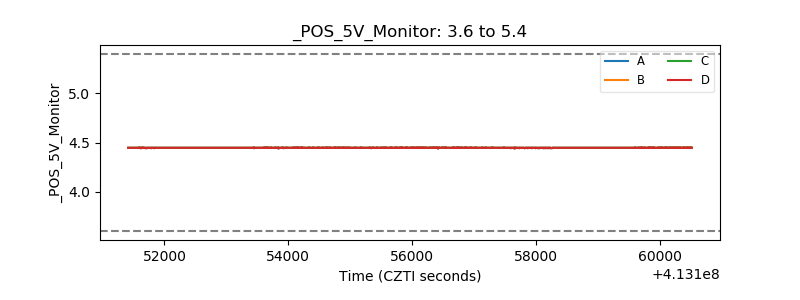 |
| _ROLL_ROT | 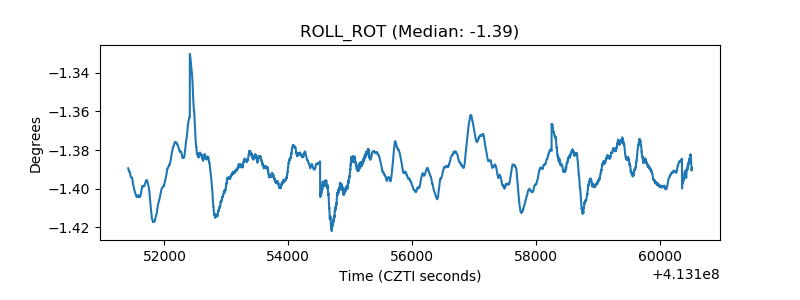 |
| _Roll_DEC | 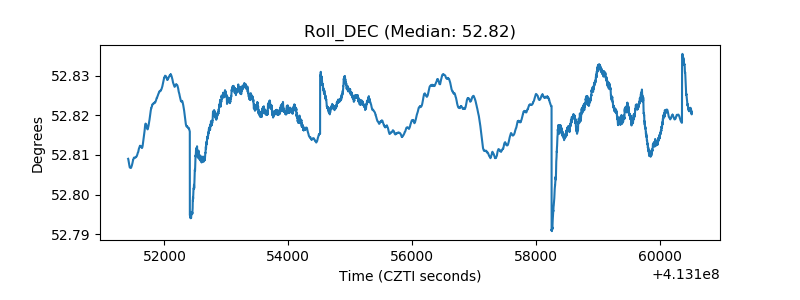 |
| _Roll_RA | 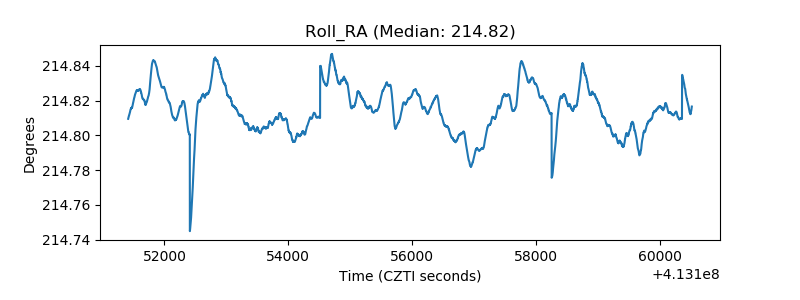 |
| Veto Counter | 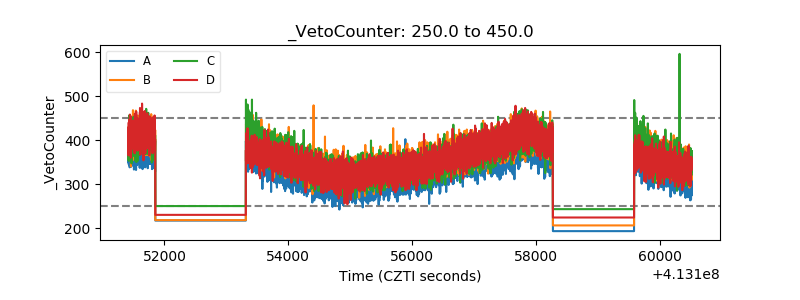 |