| Param | Original file | Final file |
|---|---|---|
| Filename | modeM0/AS1A12_022T01_9000005494_39759cztM0_level2.fits | modeM0/AS1A12_022T01_9000005494_39759cztM0_level2_quad_clean.evt |
| Size (bytes) | 890,225,280 | 255,398,400 |
| Size | 849.0 MB | 243.6 MB |
| Events in quadrant A | 8,295,415 | 1,703,906 |
| Events in quadrant B | 7,272,503 | 1,750,975 |
| Events in quadrant C | 8,167,916 | 1,665,126 |
| Events in quadrant D | 8,003,720 | 1,532,107 |
| Mode SS | |||
|---|---|---|---|
| Quadrant | BADHDUFLAG | Total packets | Discarded packets |
| A | 0 | 320 | 0 |
| B | 0 | 320 | 0 |
| C | 0 | 320 | 0 |
| D | 0 | 320 | 0 |
| Mode M0 | |||
|---|---|---|---|
| Quadrant | BADHDUFLAG | Total packets | Discarded packets |
| A | 0 | 34731 | 5 |
| B | 0 | 32819 | 4 |
| C | 0 | 34512 | 4 |
| D | 0 | 35313 | 4 |
| Mode M9 | |||
|---|---|---|---|
| Quadrant | BADHDUFLAG | Total packets | Discarded packets |
| A | 0 | 53 | 0 |
| B | 0 | 53 | 0 |
| C | 0 | 53 | 0 |
| D | 0 | 53 | 0 |
| Quadrant | Total seconds | Saturated seconds | Saturation percentage |
|---|---|---|---|
| A | 15658 | 95 | 0.606719% |
| B | 15658 | 60 | 0.383191% |
| C | 15658 | 51 | 0.325712% |
| D | 15658 | 166 | 1.060161% |
Noise dominated data is calculated using 1-second bins in cleaned event files. If a bin has >2000 counts, and if more than 50% of those come from <1% of pixels, then it is considered to be noise-dominated and hence unusable.
| Quadrant | # 1 sec bins | Bins with >0 counts | Bins with >2000 counts | High rate bins dominated by noise | Noise dominated (total time) | Noise dominated (detector-on time) | Marked lightcurve |
|---|---|---|---|---|---|---|---|
| A | 19776 | 15661 | 59 | 59 | 0.30% | 0.38% | 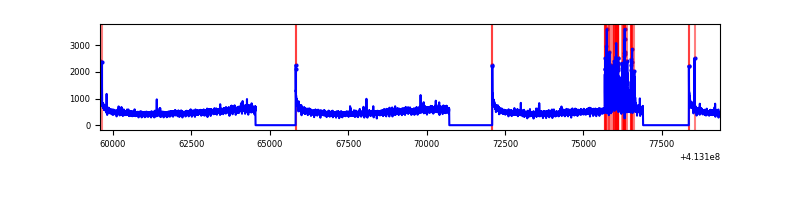 |
| B | 19776 | 15661 | 25 | 25 | 0.13% | 0.16% | 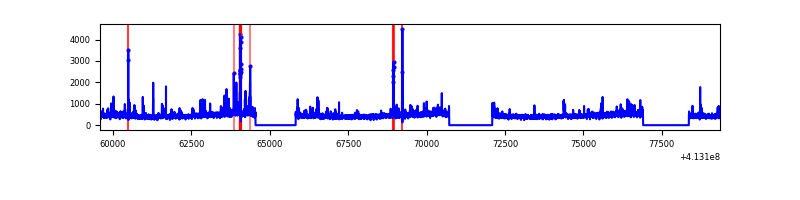 |
| C | 19776 | 15661 | 40 | 40 | 0.20% | 0.26% | 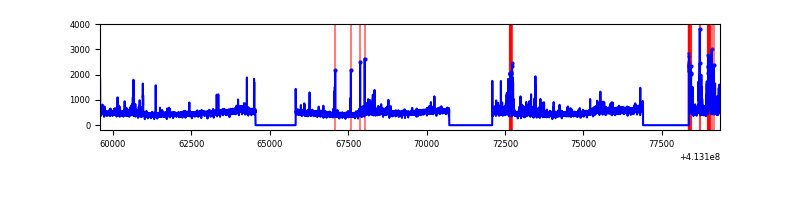 |
| D | 19776 | 15661 | 131 | 131 | 0.66% | 0.84% | 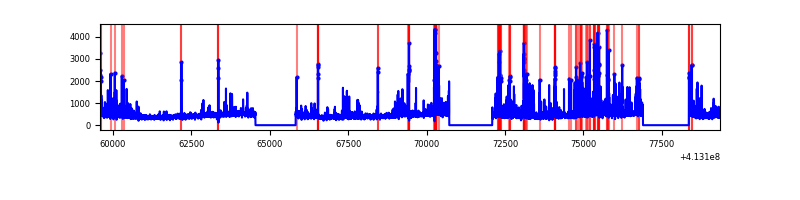 |
Top three noisy pixels from each quadrant. If the there are fewer than three noisy pixels in the level2.evt file, extra rows are filled as -1
| Pixel properties | Quadrant properties | ||||||
|---|---|---|---|---|---|---|---|
| Quadrant | DetID | PixID | Counts | Sigma | Mean | Median | Sigma |
| A | 10 | 83 | 1159238 | 3373.96 | 1703 | 1666 | 343.1 |
| A | 13 | 248 | 414747 | 1204.0 | 1703 | 1666 | 343.1 |
| A | 6 | 10 | 70812 | 201.54 | 1703 | 1666 | 343.1 |
| B | 5 | 255 | 166082 | 508.88 | 1693 | 1643 | 323.1 |
| B | 5 | 172 | 149498 | 457.56 | 1693 | 1643 | 323.1 |
| B | 0 | 190 | 132577 | 405.19 | 1693 | 1643 | 323.1 |
| C | 15 | 214 | 646210 | 1685.85 | 1653 | 1661 | 382.3 |
| C | 9 | 187 | 615065 | 1604.39 | 1653 | 1661 | 382.3 |
| C | 15 | 208 | 327236 | 851.56 | 1653 | 1661 | 382.3 |
| D | 12 | 227 | 1020408 | 2543.56 | 1650 | 1602 | 400.5 |
| D | 13 | 249 | 210490 | 521.51 | 1650 | 1602 | 400.5 |
| D | 2 | 250 | 148113 | 365.78 | 1650 | 1602 | 400.5 |
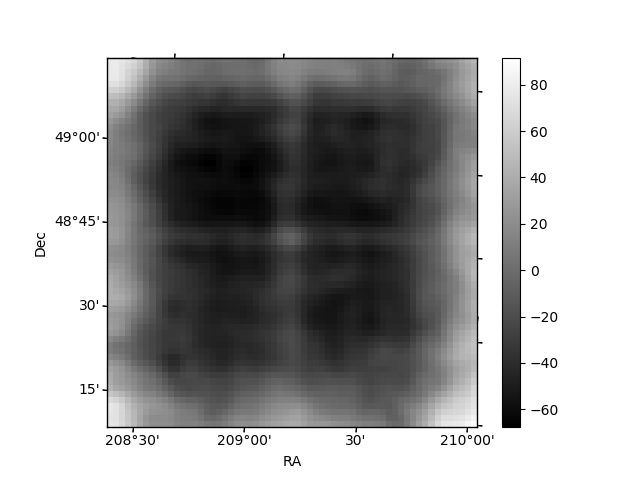
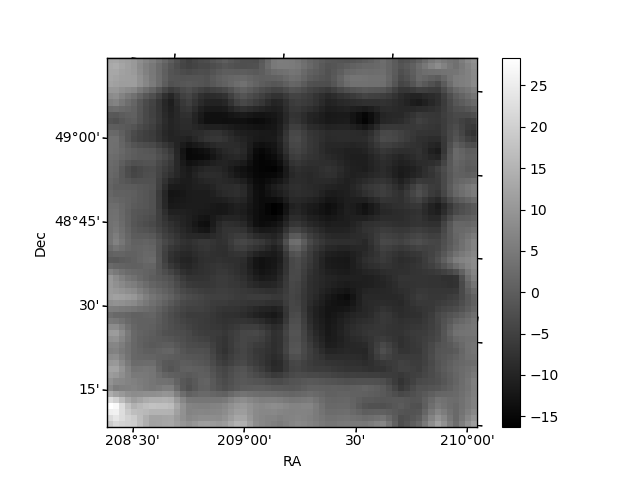
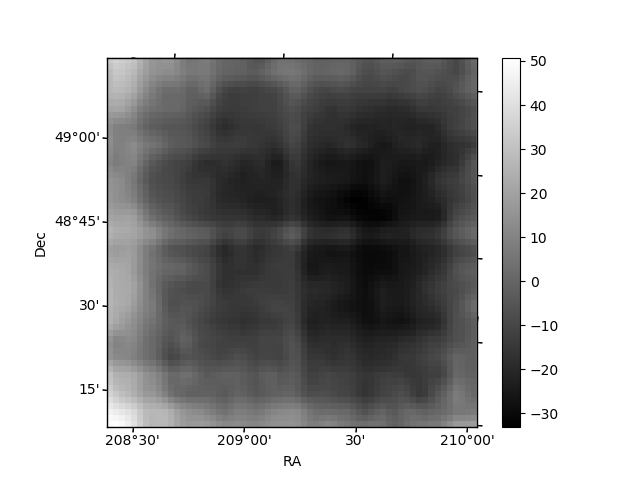
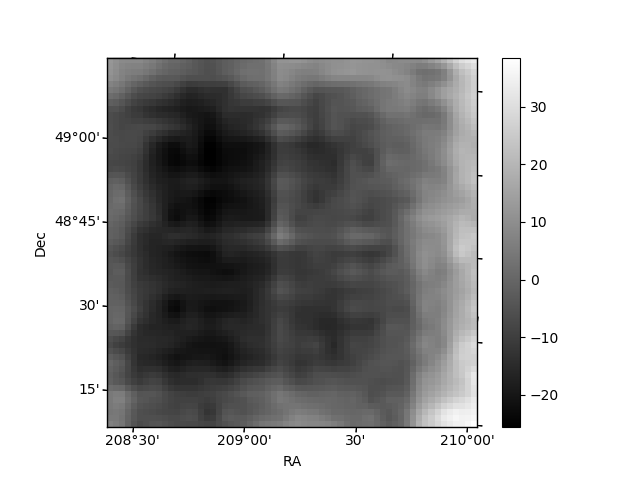
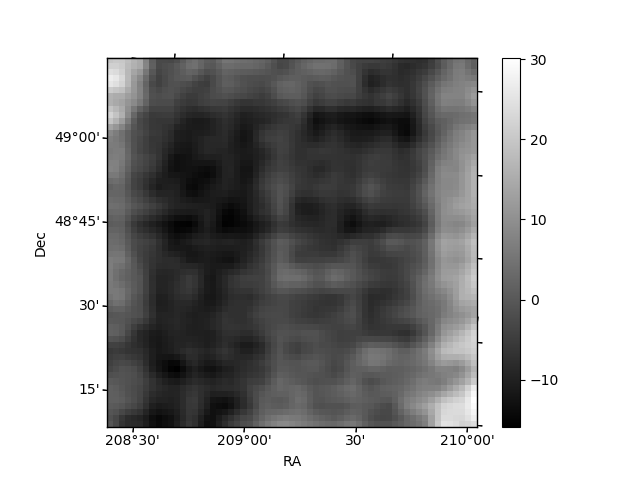
Histogram calculated using DETX and DETY for each event in the final _common_clean file
| Quadrant A | 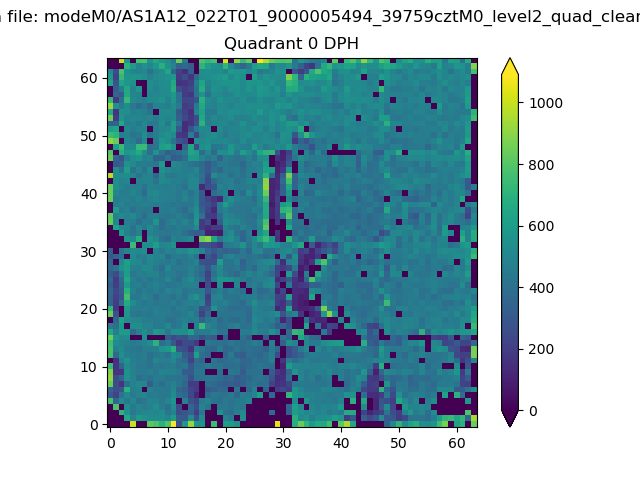 |
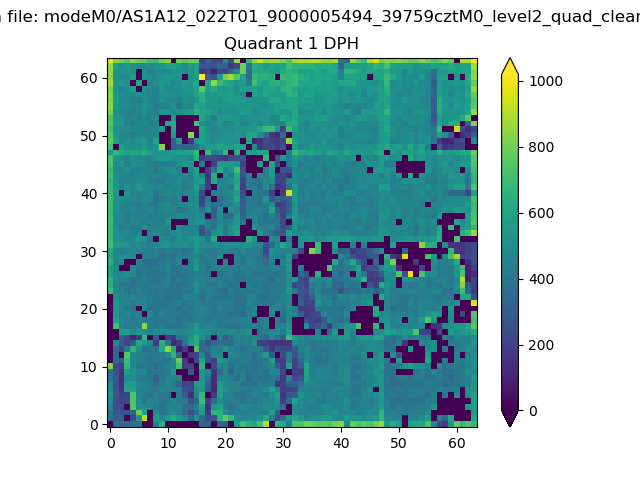 |
Quadrant B |
|---|---|---|---|
| Quadrant D | 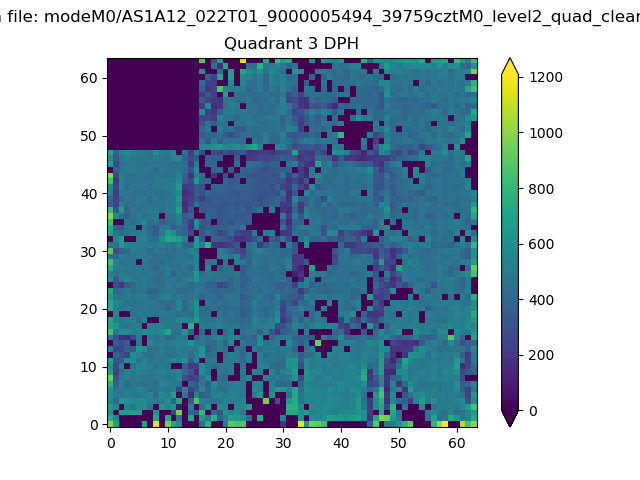 |
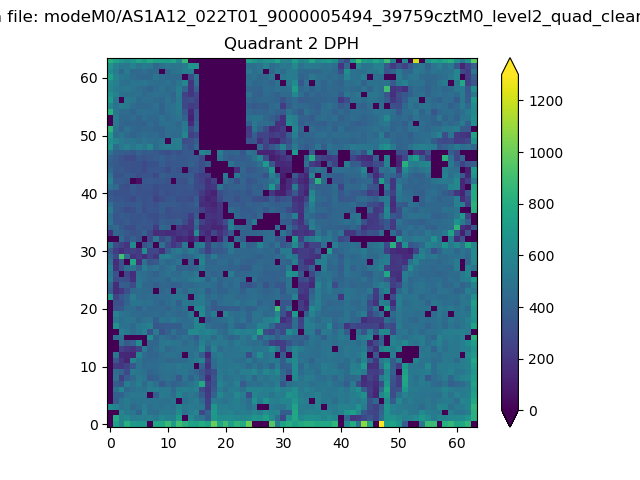 |
Quadrant C |
| Plot type | Count rate plots | Images |
|---|---|---|
| Comparison with Poisson distribution Blue bars denote a histogram of data divided into 1 sec bins. Red curve is a Poisson curve with rate = median count rate of data. |
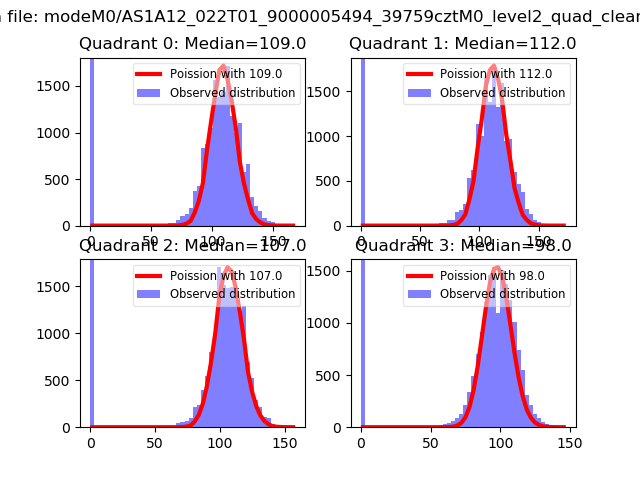 |
 |
| Quadrant-wise count rates Data is divided into 100 sec bins |
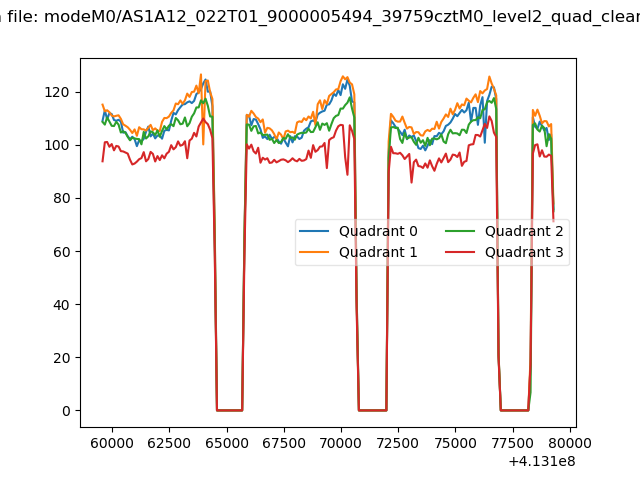 |
|
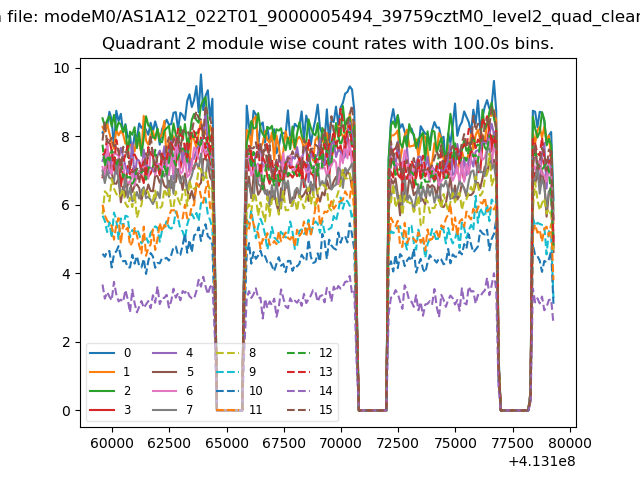
| Module-wise count rates for Quadrant A Data is divided into 100 sec bins |
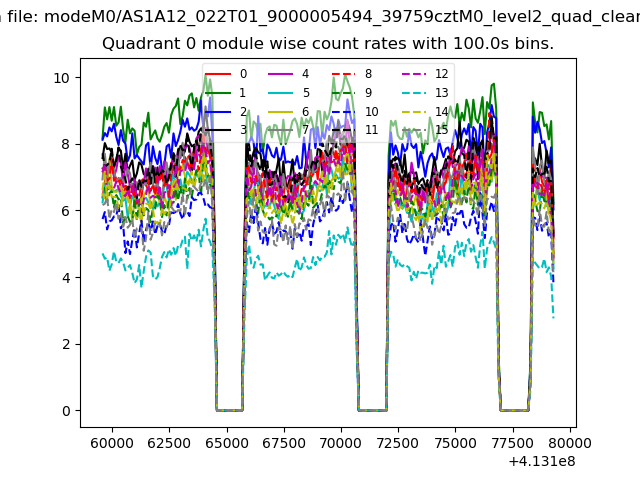 |
 |
| Module-wise count rates for Quadrant B Data is divided into 100 sec bins |
 |
 |
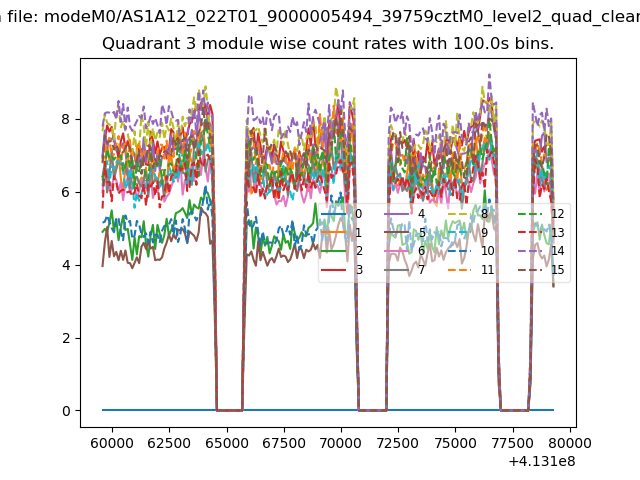
| Module-wise count rates for Quadrant C Data is divided into 100 sec bins |
 |
 |
| Module-wise count rates for Quadrant D Data is divided into 100 sec bins |
 |
 |
| Parameter | Plot |
|---|---|
| CZT HV Monitor | 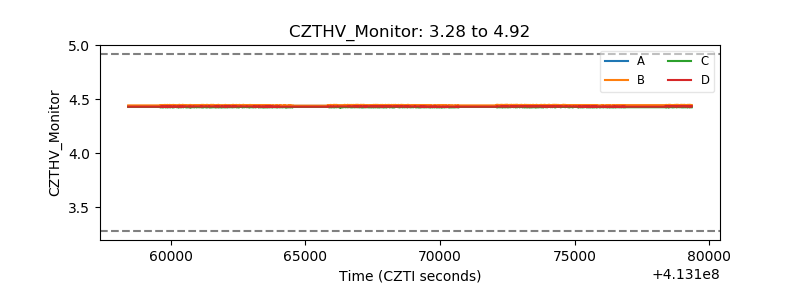 |
| D_VDD | 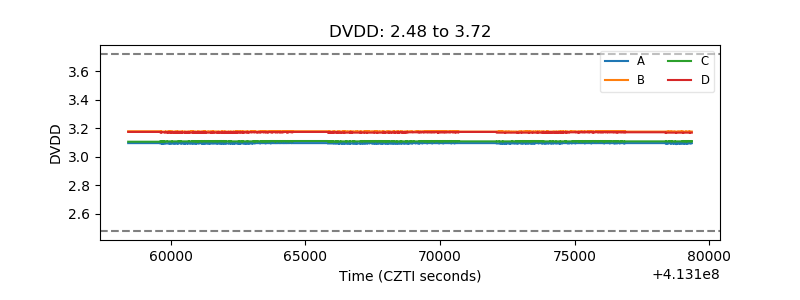 |
| Temperature 1 | 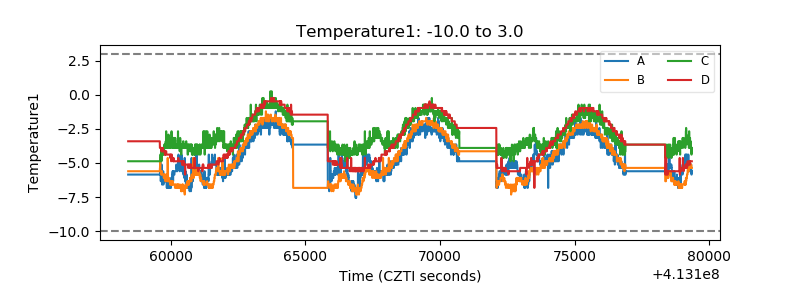 |
| Veto HV Monitor |  |
| Veto LLD | 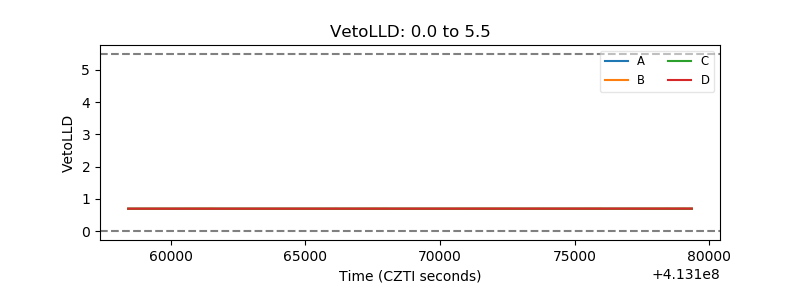 |
| Alpha Counter | 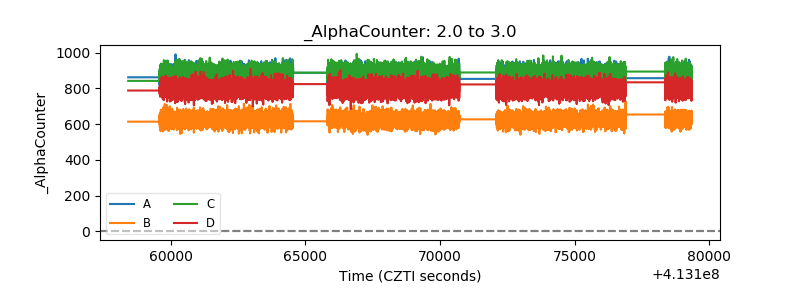 |
| _CPM_Rate | 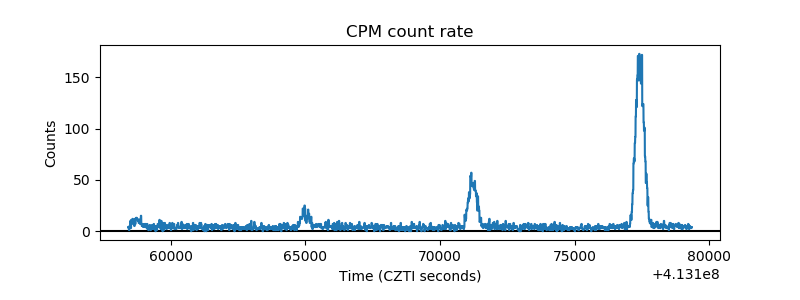 |
| CZT Counter | 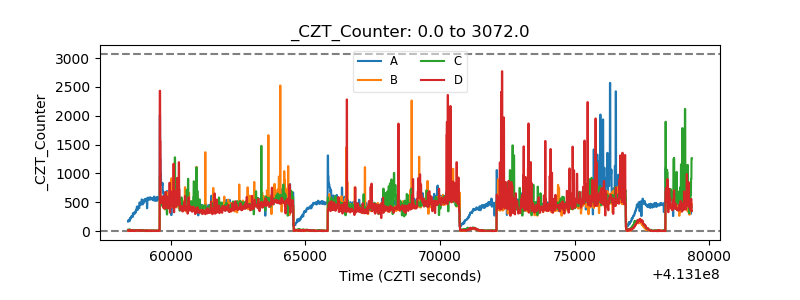 |
| +2.5 Volts monitor | 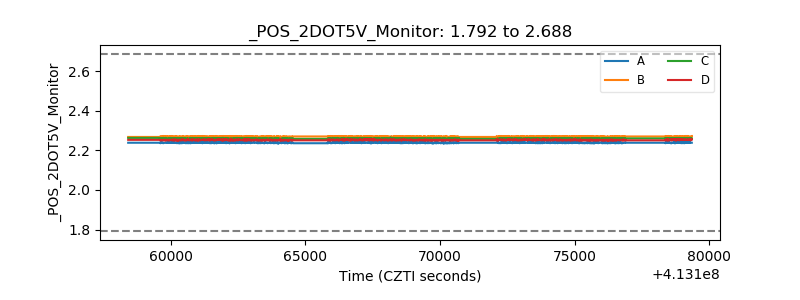 |
| +5 Volts monitor | 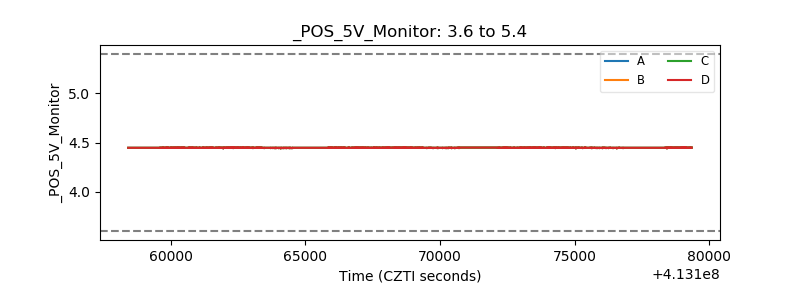 |
| _ROLL_ROT | 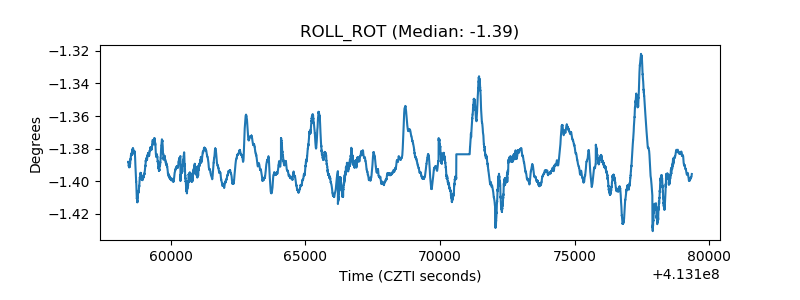 |
| _Roll_DEC | 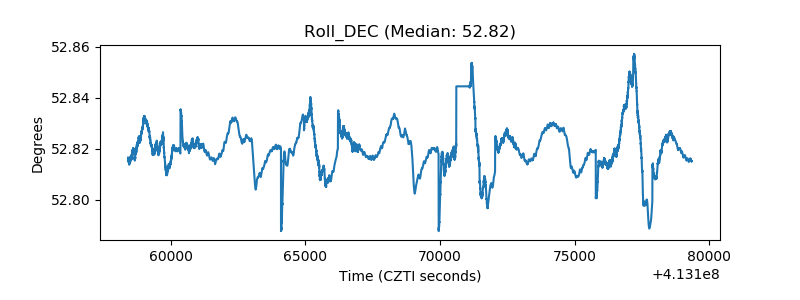 |
| _Roll_RA | 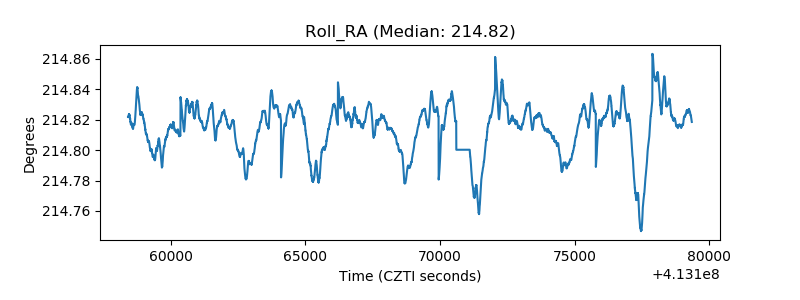 |
| Veto Counter | 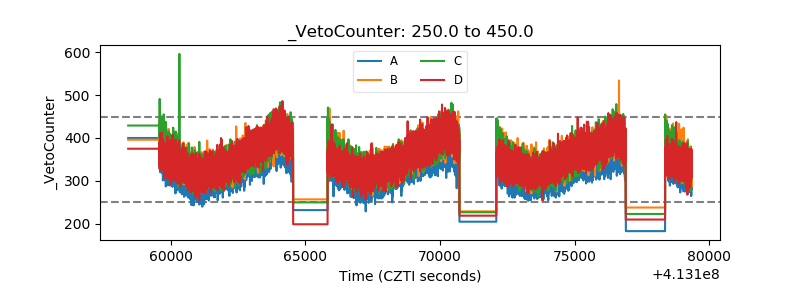 |