| Param | Original file | Final file |
|---|---|---|
| Filename | modeM0/AS1A12_022T01_9000005494_39763cztM0_level2.fits | modeM0/AS1A12_022T01_9000005494_39763cztM0_level2_quad_clean.evt |
| Size (bytes) | 313,810,560 | 90,578,880 |
| Size | 299.3 MB | 86.4 MB |
| Events in quadrant A | 2,812,087 | 622,863 |
| Events in quadrant B | 2,639,936 | 631,147 |
| Events in quadrant C | 2,710,801 | 587,296 |
| Events in quadrant D | 3,049,387 | 538,468 |
| Mode SS | |||
|---|---|---|---|
| Quadrant | BADHDUFLAG | Total packets | Discarded packets |
| A | 0 | 106 | 0 |
| B | 0 | 106 | 0 |
| C | 0 | 106 | 0 |
| D | 0 | 106 | 0 |
| Mode M0 | |||
|---|---|---|---|
| Quadrant | BADHDUFLAG | Total packets | Discarded packets |
| A | 0 | 11425 | 3 |
| B | 0 | 11155 | 2 |
| C | 0 | 11237 | 2 |
| D | 0 | 12431 | 2 |
| Mode M9 | |||
|---|---|---|---|
| Quadrant | BADHDUFLAG | Total packets | Discarded packets |
| A | 0 | 20 | 0 |
| B | 0 | 20 | 0 |
| C | 0 | 20 | 0 |
| D | 0 | 21 | 0 |
| Quadrant | Total seconds | Saturated seconds | Saturation percentage |
|---|---|---|---|
| A | 5182 | 21 | 0.405249% |
| B | 5182 | 41 | 0.791200% |
| C | 5182 | 45 | 0.868391% |
| D | 5182 | 159 | 3.068313% |
Noise dominated data is calculated using 1-second bins in cleaned event files. If a bin has >2000 counts, and if more than 50% of those come from <1% of pixels, then it is considered to be noise-dominated and hence unusable.
| Quadrant | # 1 sec bins | Bins with >0 counts | Bins with >2000 counts | High rate bins dominated by noise | Noise dominated (total time) | Noise dominated (detector-on time) | Marked lightcurve |
|---|---|---|---|---|---|---|---|
| A | 7065 | 5183 | 9 | 9 | 0.13% | 0.17% | 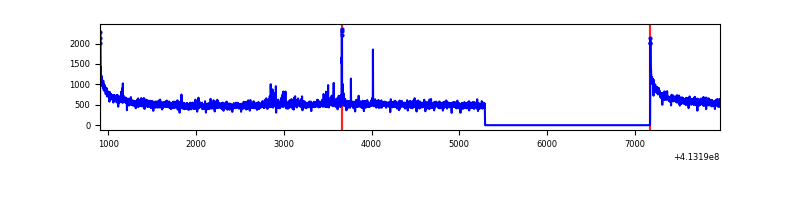 |
| B | 7065 | 5183 | 22 | 22 | 0.31% | 0.42% | 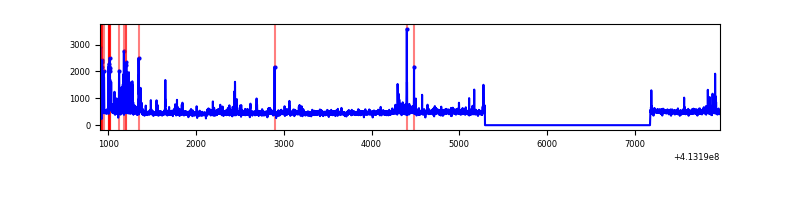 |
| C | 7065 | 5183 | 30 | 30 | 0.42% | 0.58% | 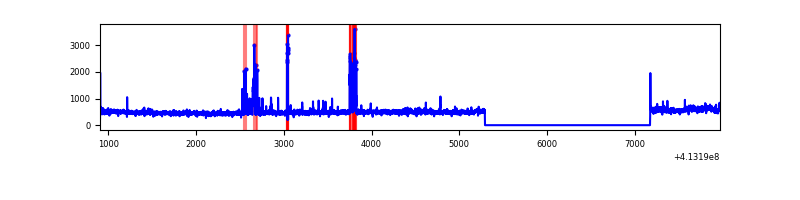 |
| D | 7065 | 5183 | 148 | 148 | 2.09% | 2.86% | 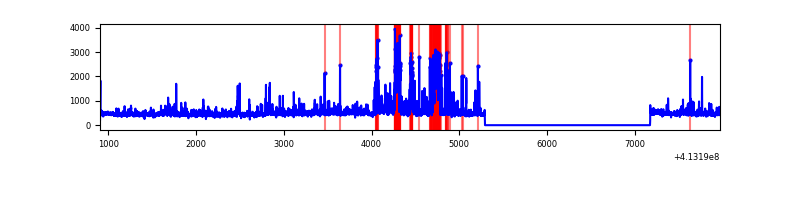 |
Top three noisy pixels from each quadrant. If the there are fewer than three noisy pixels in the level2.evt file, extra rows are filled as -1
| Pixel properties | Quadrant properties | ||||||
|---|---|---|---|---|---|---|---|
| Quadrant | DetID | PixID | Counts | Sigma | Mean | Median | Sigma |
| A | 10 | 83 | 443964 | 3655.44 | 596 | 585 | 121.3 |
| A | 15 | 174 | 22787 | 183.04 | 596 | 585 | 121.3 |
| A | 0 | 8 | 14923 | 118.21 | 596 | 585 | 121.3 |
| B | 5 | 255 | 199274 | 1762.19 | 585 | 570 | 112.8 |
| B | 5 | 172 | 55719 | 489.08 | 585 | 570 | 112.8 |
| B | 0 | 190 | 40584 | 354.86 | 585 | 570 | 112.8 |
| C | 15 | 214 | 217586 | 1638.23 | 569 | 572 | 132.5 |
| C | 14 | 254 | 188525 | 1418.85 | 569 | 572 | 132.5 |
| C | 15 | 208 | 74728 | 559.8 | 569 | 572 | 132.5 |
| D | 12 | 227 | 357855 | 2577.41 | 570 | 554 | 138.6 |
| D | 13 | 249 | 196302 | 1412.04 | 570 | 554 | 138.6 |
| D | 12 | 233 | 82293 | 589.63 | 570 | 554 | 138.6 |
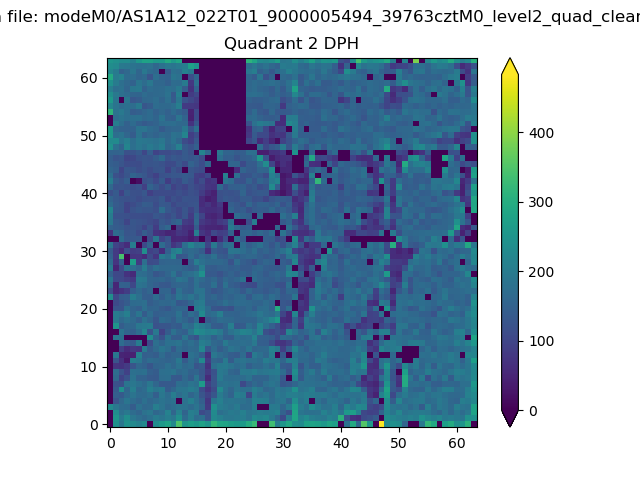
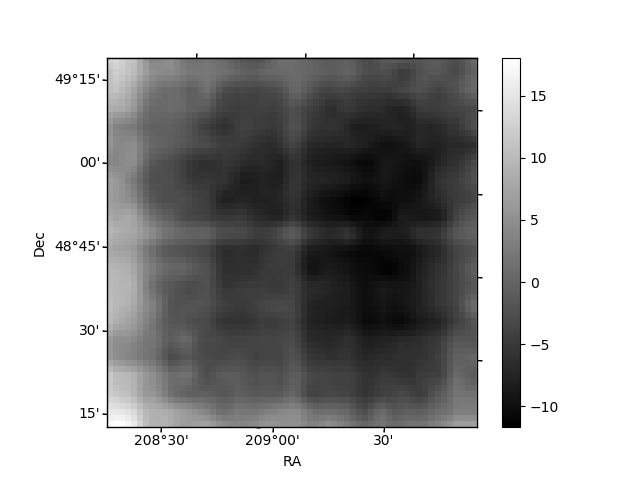
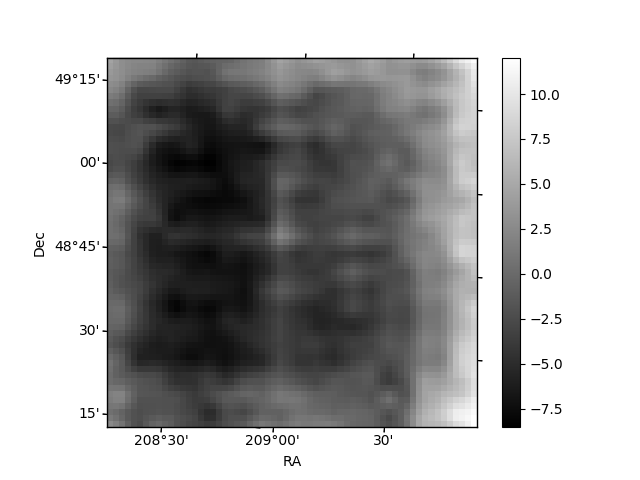
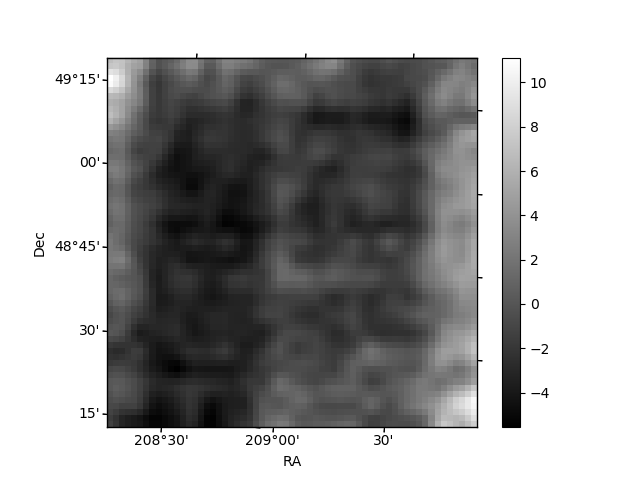
Histogram calculated using DETX and DETY for each event in the final _common_clean file
| Quadrant A | 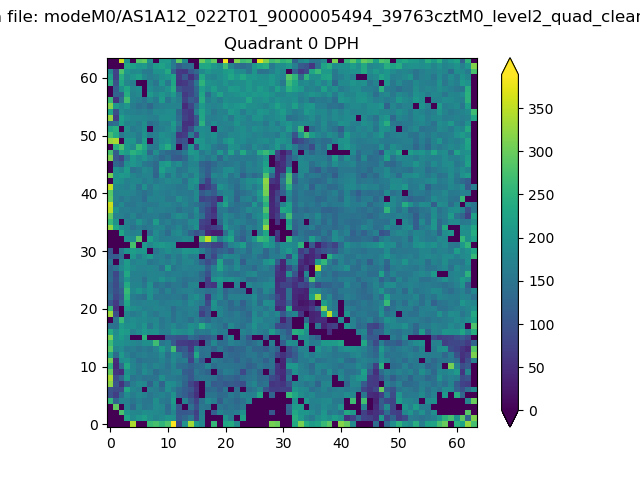 |
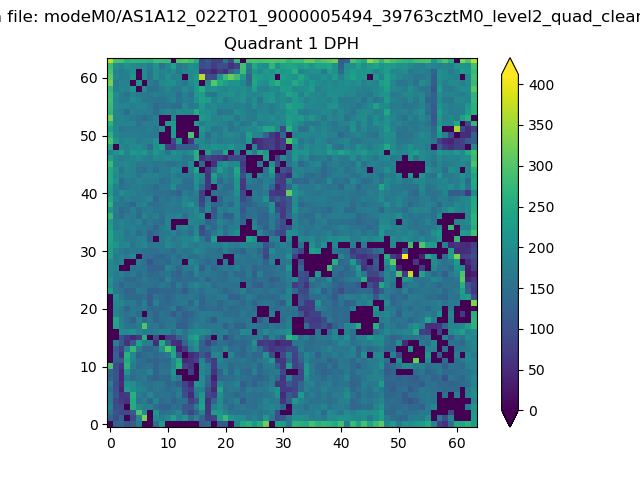 |
Quadrant B |
|---|---|---|---|
| Quadrant D | 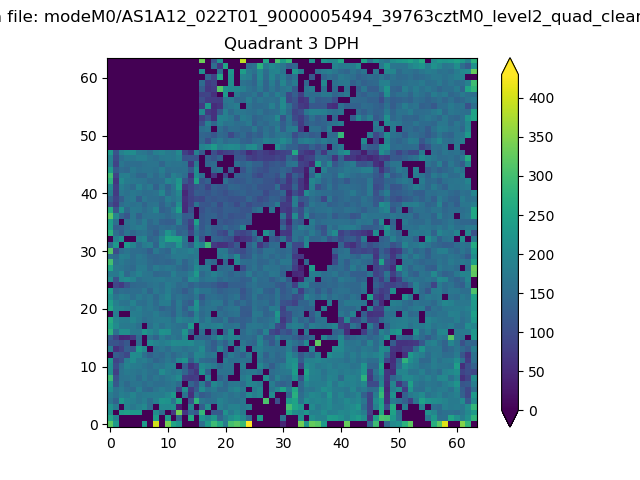 |
 |
Quadrant C |
| Plot type | Count rate plots | Images |
|---|---|---|
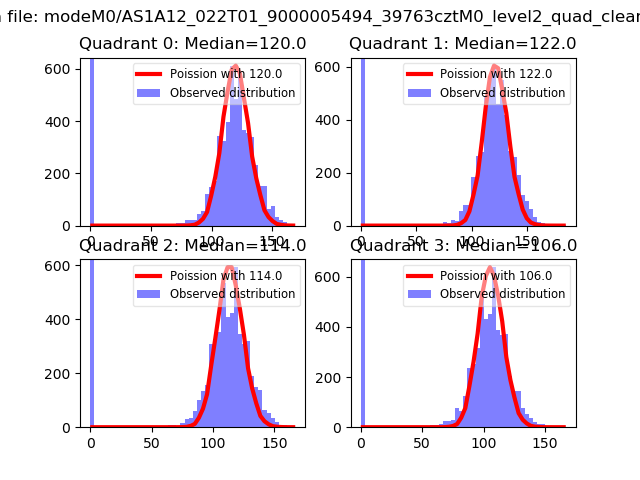
| Comparison with Poisson distribution Blue bars denote a histogram of data divided into 1 sec bins. Red curve is a Poisson curve with rate = median count rate of data. |
 |
 |
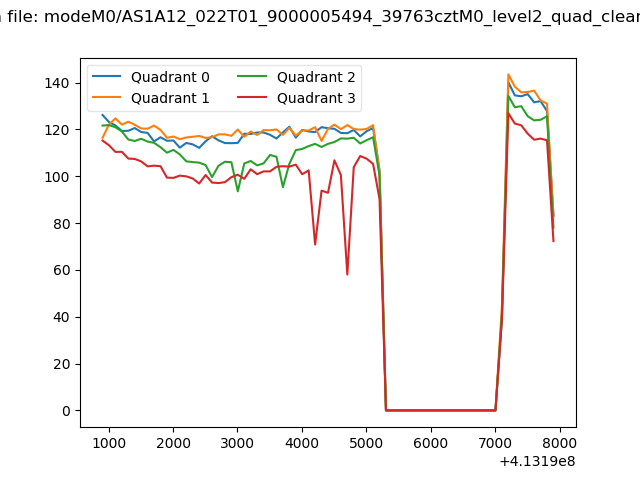
| Quadrant-wise count rates Data is divided into 100 sec bins |
 |
|
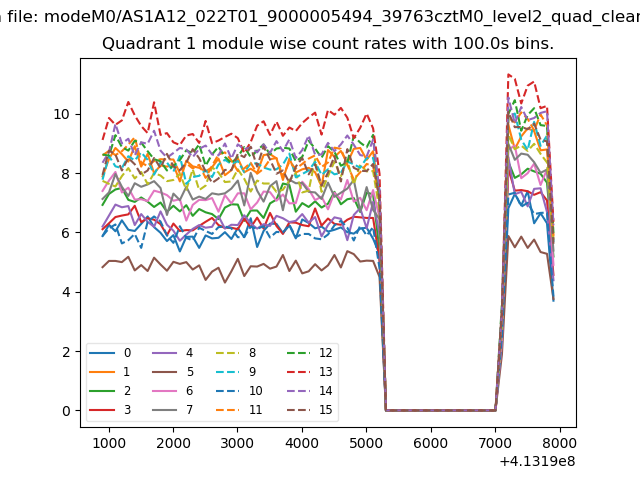
| Module-wise count rates for Quadrant A Data is divided into 100 sec bins |
 |
 |
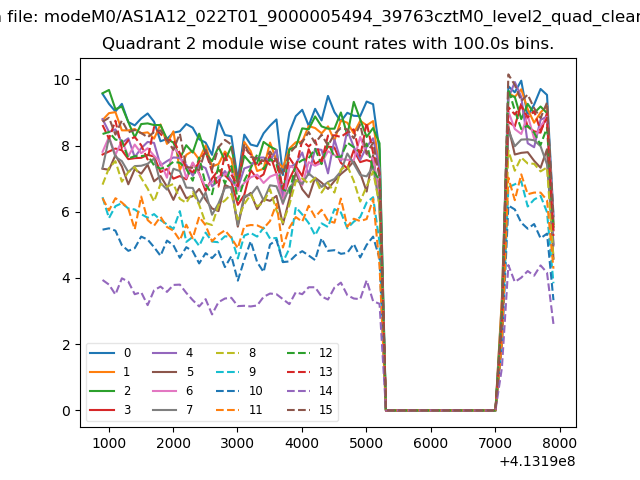
| Module-wise count rates for Quadrant B Data is divided into 100 sec bins |
 |
 |
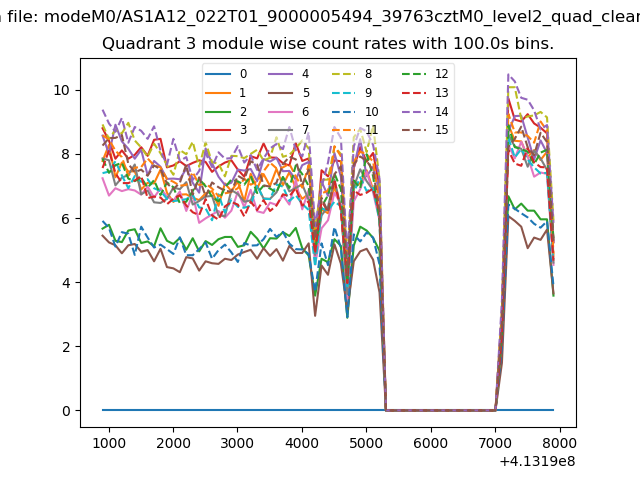
| Module-wise count rates for Quadrant C Data is divided into 100 sec bins |
 |
 |
| Module-wise count rates for Quadrant D Data is divided into 100 sec bins |
 |
 |
| Parameter | Plot |
|---|---|
| CZT HV Monitor | 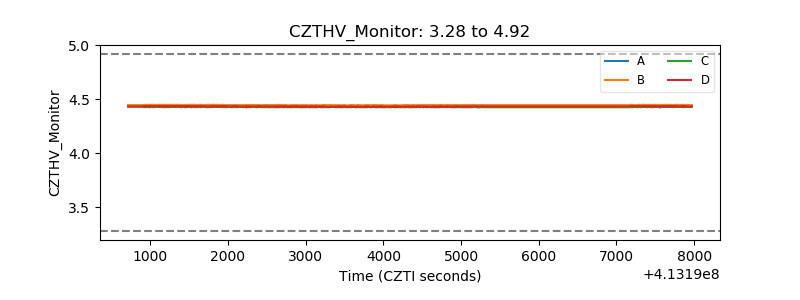 |
| D_VDD | 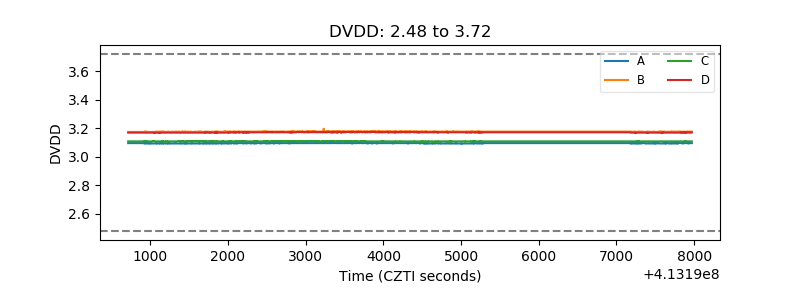 |
| Temperature 1 | 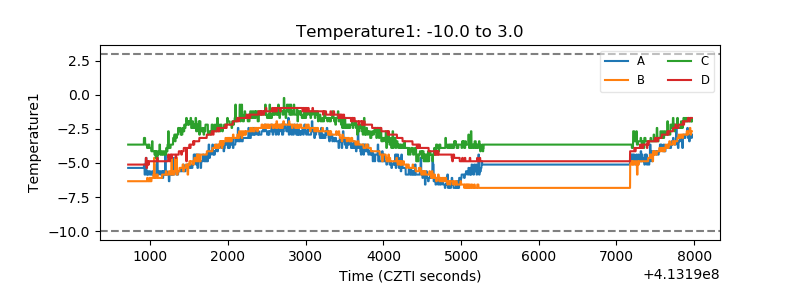 |
| Veto HV Monitor | 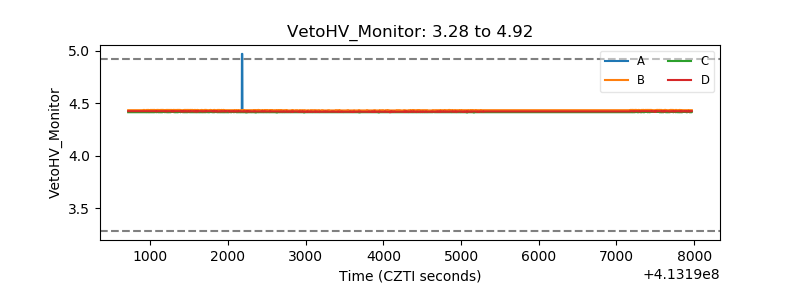 |
| Veto LLD | 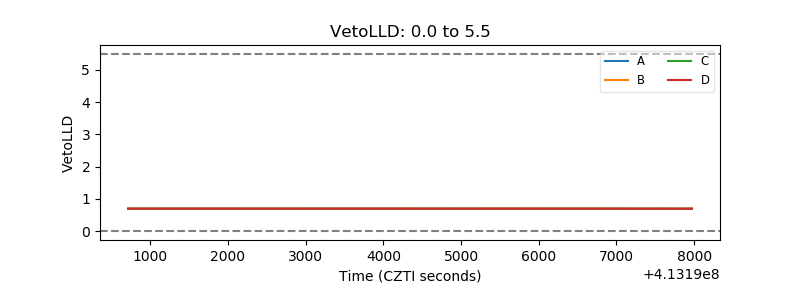 |
| Alpha Counter | 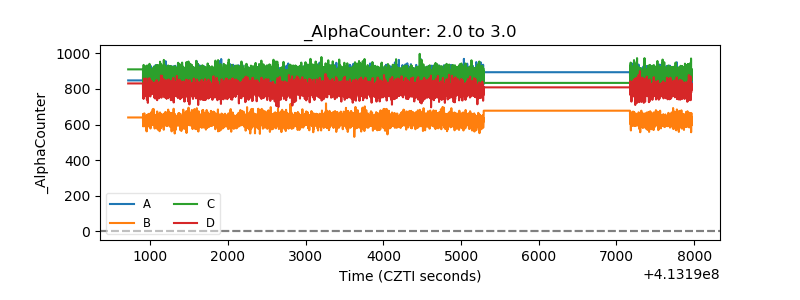 |
| _CPM_Rate | 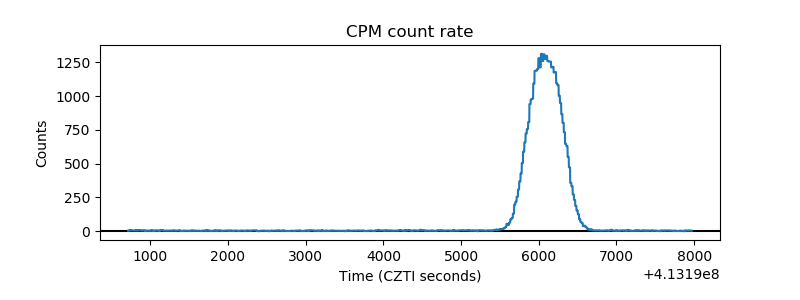 |
| CZT Counter | 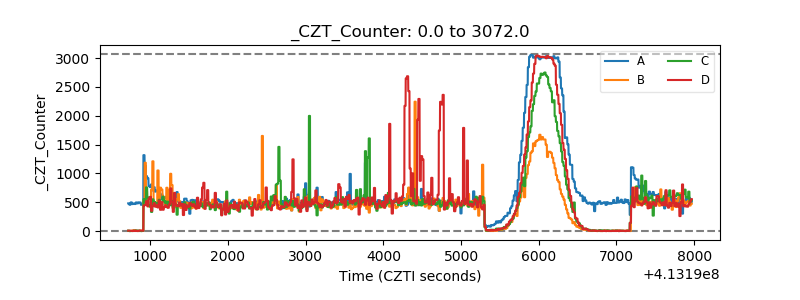 |
| +2.5 Volts monitor | 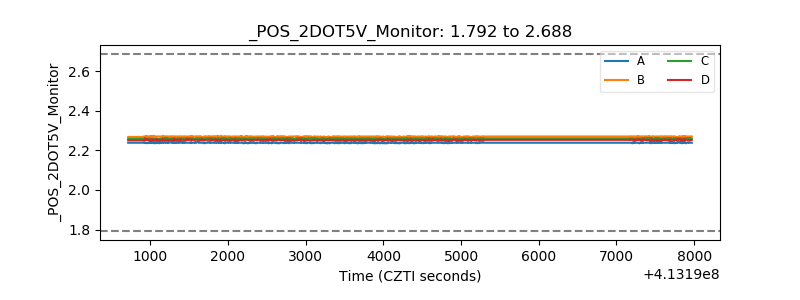 |
| +5 Volts monitor |  |
| _ROLL_ROT | 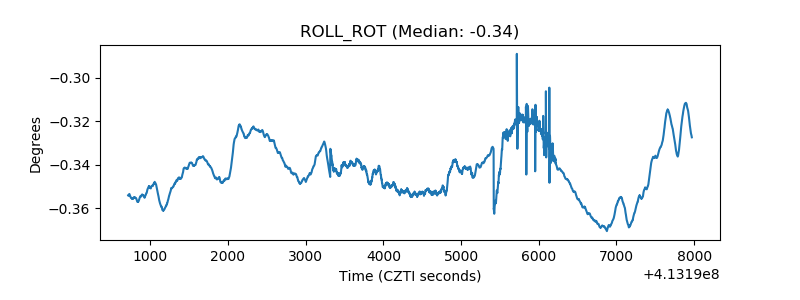 |
| _Roll_DEC | 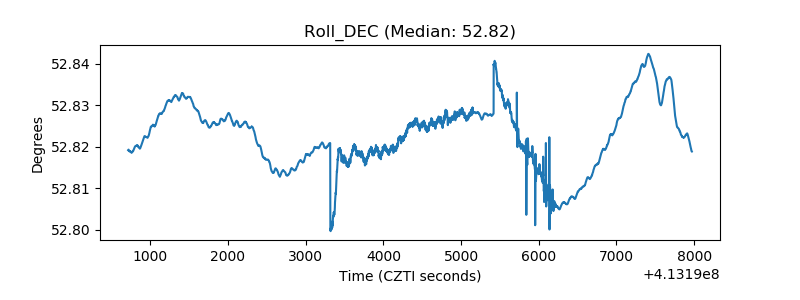 |
| _Roll_RA | 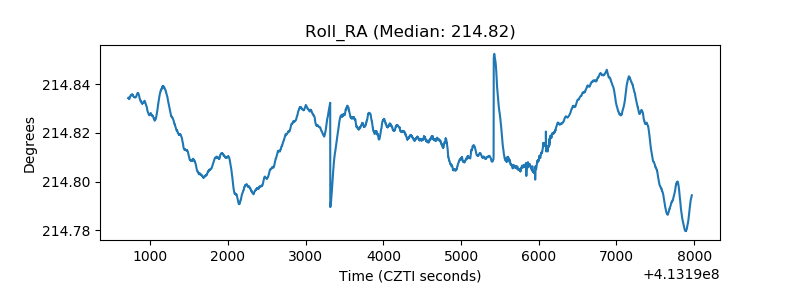 |
| Veto Counter | 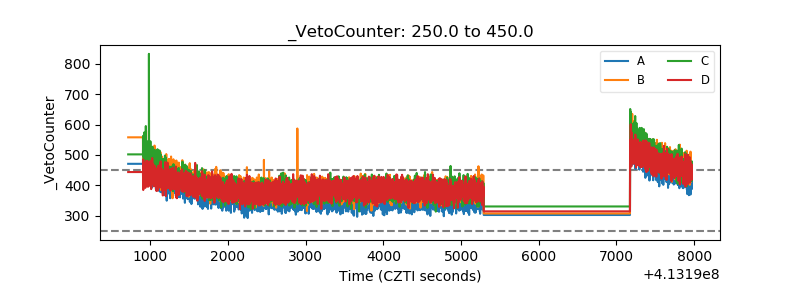 |