| Param | Original file | Final file |
|---|---|---|
| Filename | modeM0/AS1A12_022T01_9000005494_39764cztM0_level2.fits | modeM0/AS1A12_022T01_9000005494_39764cztM0_level2_quad_clean.evt |
| Size (bytes) | 312,523,200 | 93,211,200 |
| Size | 298.0 MB | 88.9 MB |
| Events in quadrant A | 3,012,242 | 644,524 |
| Events in quadrant B | 2,676,243 | 650,513 |
| Events in quadrant C | 2,748,262 | 606,018 |
| Events in quadrant D | 2,737,903 | 566,759 |
| Mode SS | |||
|---|---|---|---|
| Quadrant | BADHDUFLAG | Total packets | Discarded packets |
| A | 0 | 104 | 0 |
| B | 0 | 104 | 0 |
| C | 0 | 104 | 0 |
| D | 0 | 104 | 0 |
| Mode M0 | |||
|---|---|---|---|
| Quadrant | BADHDUFLAG | Total packets | Discarded packets |
| A | 0 | 12021 | 3 |
| B | 0 | 10996 | 2 |
| C | 0 | 11230 | 2 |
| D | 0 | 11285 | 2 |
| Mode M9 | |||
|---|---|---|---|
| Quadrant | BADHDUFLAG | Total packets | Discarded packets |
| A | 0 | 20 | 0 |
| B | 0 | 20 | 0 |
| C | 0 | 20 | 0 |
| D | 0 | 21 | 0 |
| Quadrant | Total seconds | Saturated seconds | Saturation percentage |
|---|---|---|---|
| A | 5059 | 29 | 0.573236% |
| B | 5059 | 38 | 0.751137% |
| C | 5059 | 5 | 0.098834% |
| D | 5059 | 41 | 0.810437% |
Noise dominated data is calculated using 1-second bins in cleaned event files. If a bin has >2000 counts, and if more than 50% of those come from <1% of pixels, then it is considered to be noise-dominated and hence unusable.
| Quadrant | # 1 sec bins | Bins with >0 counts | Bins with >2000 counts | High rate bins dominated by noise | Noise dominated (total time) | Noise dominated (detector-on time) | Marked lightcurve |
|---|---|---|---|---|---|---|---|
| A | 7062 | 5060 | 13 | 13 | 0.18% | 0.26% | 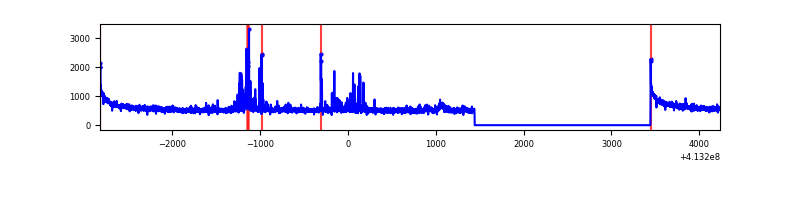 |
| B | 7062 | 5060 | 23 | 23 | 0.33% | 0.45% | 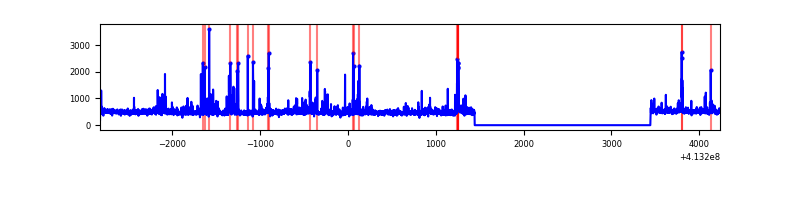 |
| C | 7062 | 5060 | 3 | 3 | 0.04% | 0.06% | 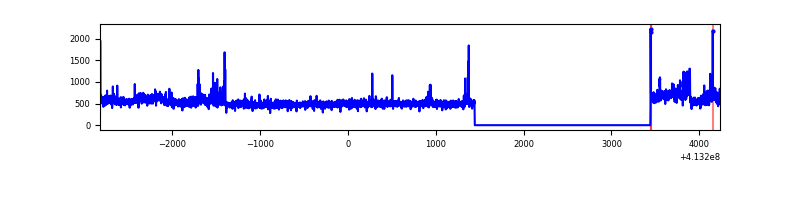 |
| D | 7062 | 5060 | 39 | 39 | 0.55% | 0.77% | 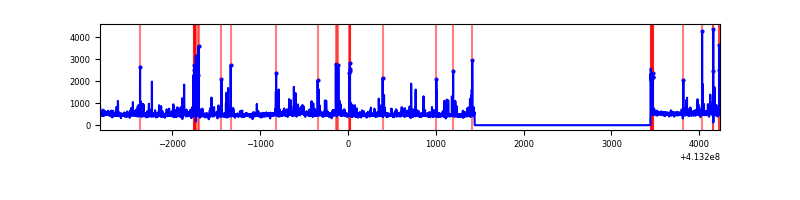 |
Top three noisy pixels from each quadrant. If the there are fewer than three noisy pixels in the level2.evt file, extra rows are filled as -1
| Pixel properties | Quadrant properties | ||||||
|---|---|---|---|---|---|---|---|
| Quadrant | DetID | PixID | Counts | Sigma | Mean | Median | Sigma |
| A | 10 | 83 | 455591 | 3737.54 | 605 | 595 | 121.7 |
| A | 13 | 248 | 155656 | 1273.74 | 605 | 595 | 121.7 |
| A | 0 | 8 | 35850 | 289.6 | 605 | 595 | 121.7 |
| B | 5 | 255 | 172065 | 1512.1 | 592 | 578 | 113.4 |
| B | 5 | 172 | 102310 | 897.03 | 592 | 578 | 113.4 |
| B | 0 | 230 | 43514 | 378.59 | 592 | 578 | 113.4 |
| C | 15 | 208 | 252373 | 1872.14 | 579 | 582 | 134.5 |
| C | 15 | 214 | 212913 | 1578.74 | 579 | 582 | 134.5 |
| C | 0 | 10 | 9657 | 67.48 | 579 | 582 | 134.5 |
| D | 12 | 227 | 141784 | 983.7 | 586 | 567 | 143.6 |
| D | 13 | 249 | 104388 | 723.21 | 586 | 567 | 143.6 |
| D | 7 | 38 | 65329 | 451.12 | 586 | 567 | 143.6 |
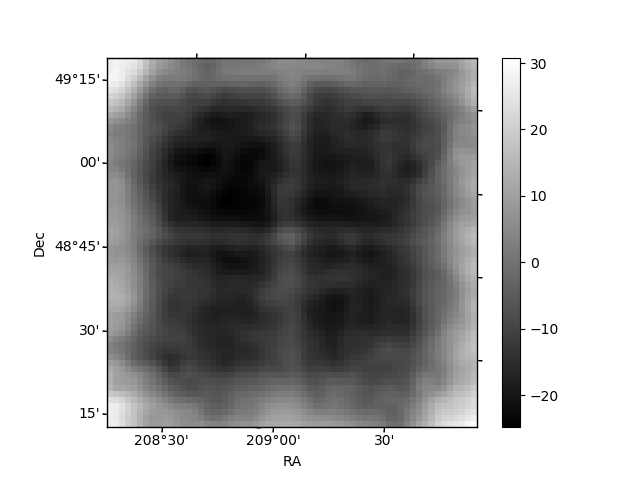
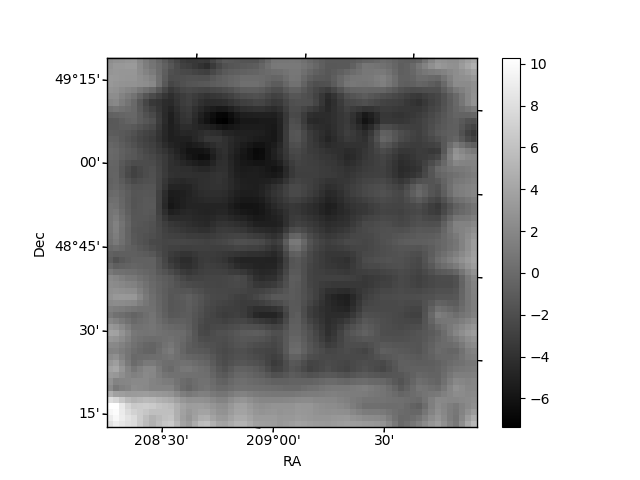
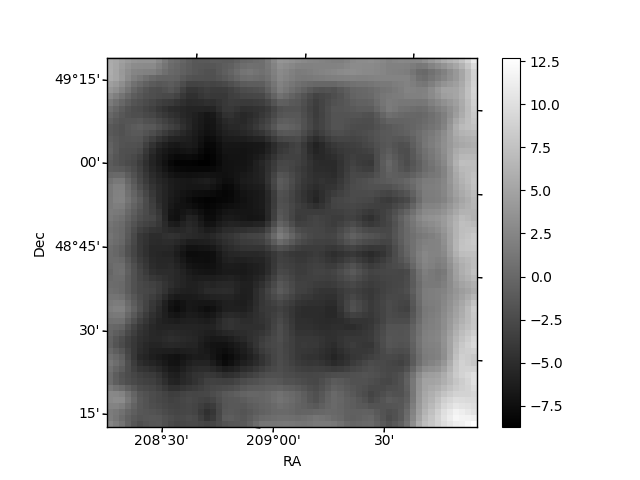
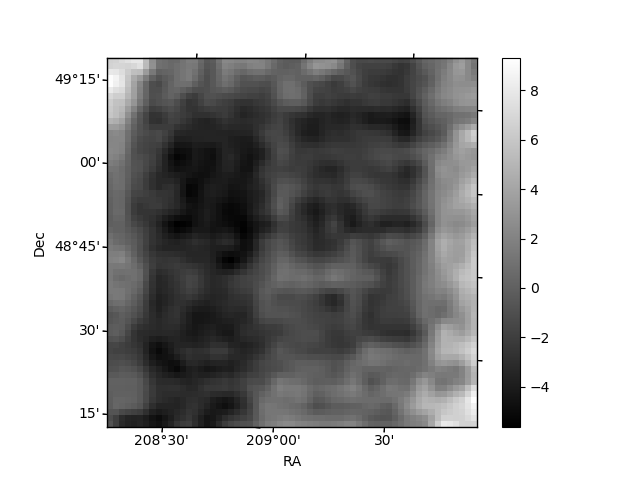
Histogram calculated using DETX and DETY for each event in the final _common_clean file
| Quadrant A | 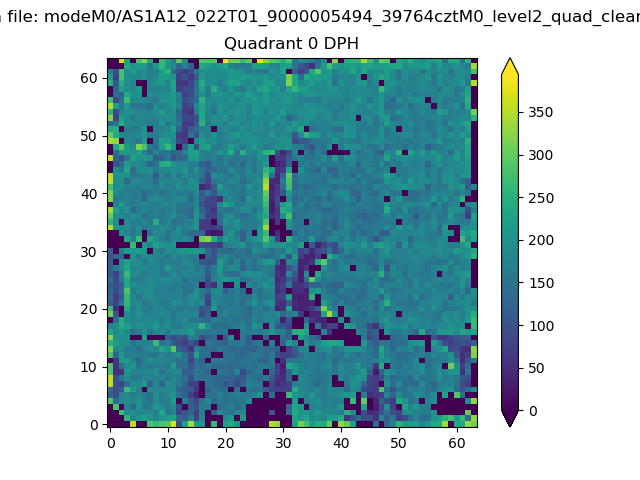 |
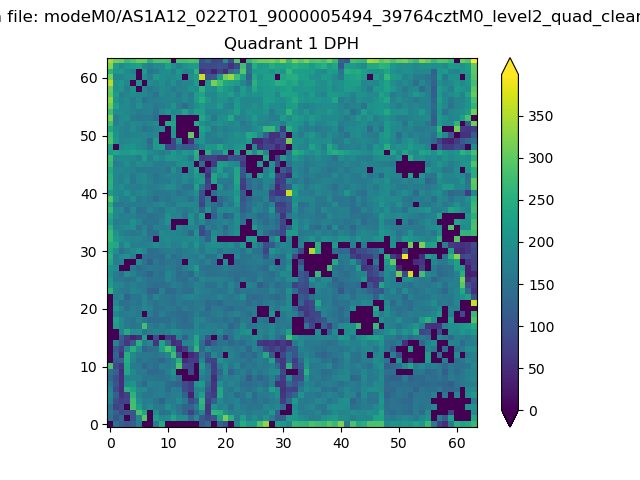 |
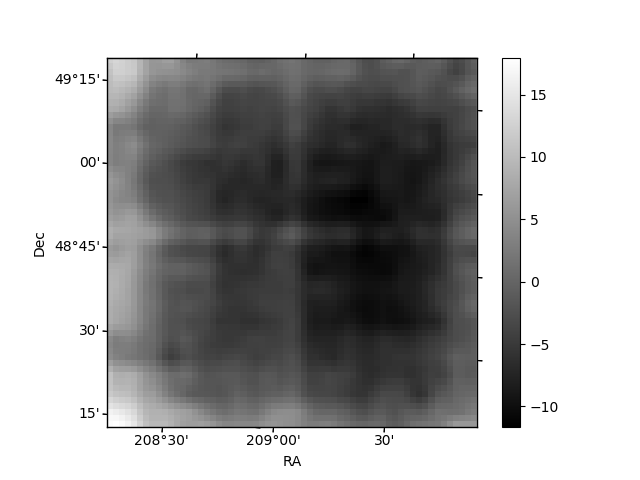
Quadrant B |
|---|---|---|---|
| Quadrant D | 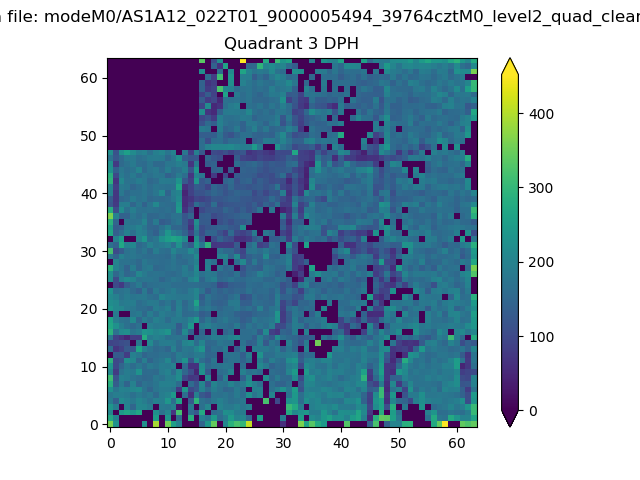 |
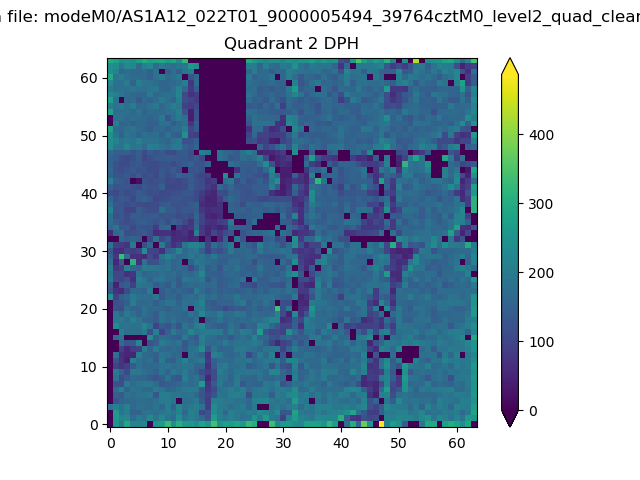 |
Quadrant C |
| Plot type | Count rate plots | Images |
|---|---|---|
| Comparison with Poisson distribution Blue bars denote a histogram of data divided into 1 sec bins. Red curve is a Poisson curve with rate = median count rate of data. |
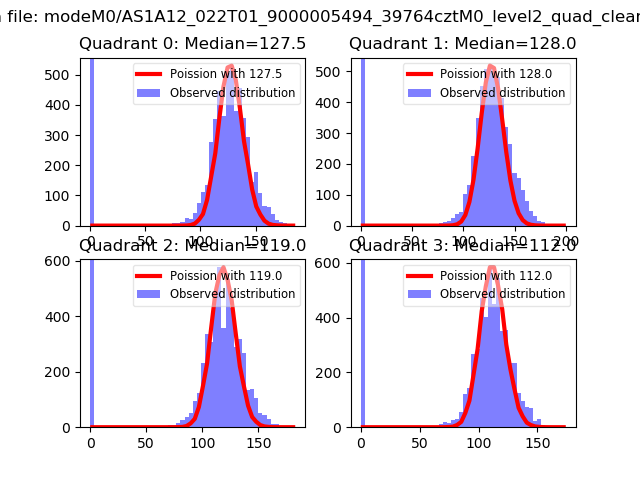 |
 |
| Quadrant-wise count rates Data is divided into 100 sec bins |
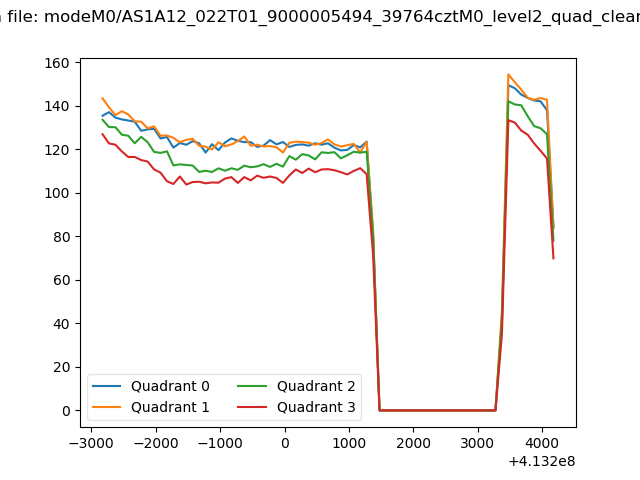 |
|
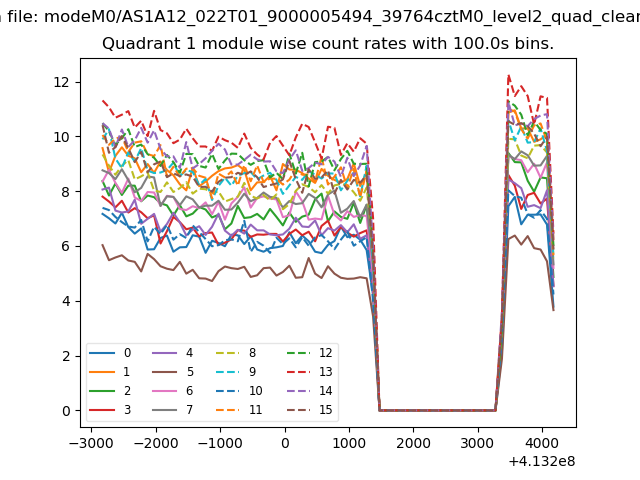
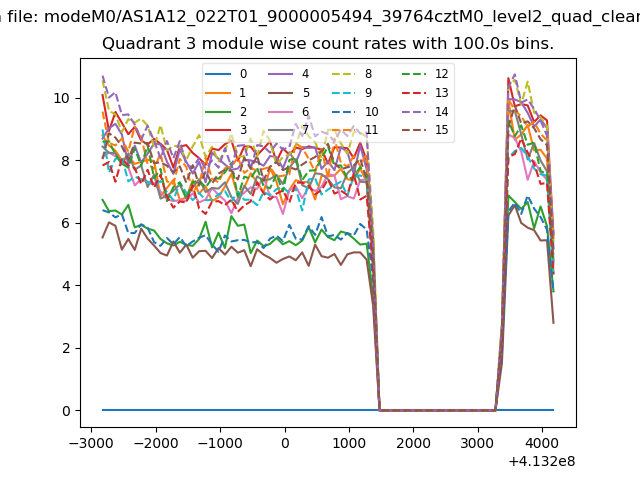
| Module-wise count rates for Quadrant A Data is divided into 100 sec bins |
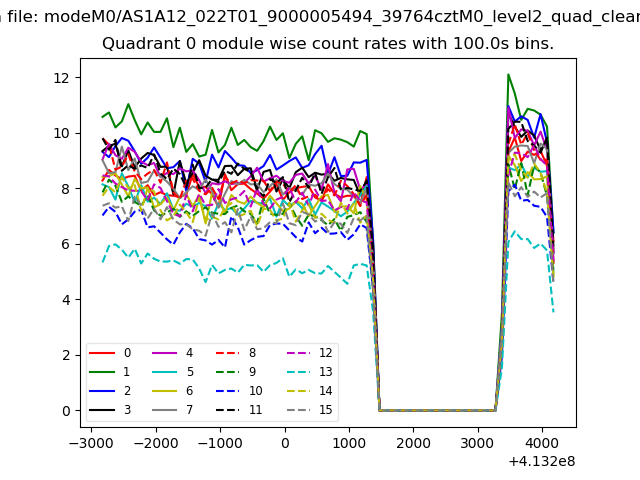 |
 |
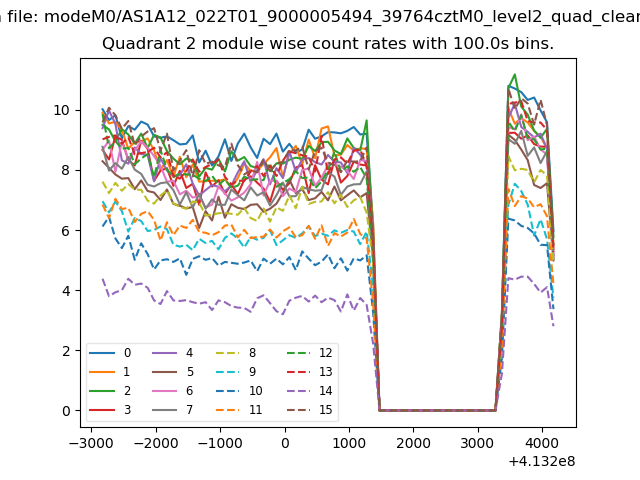
| Module-wise count rates for Quadrant B Data is divided into 100 sec bins |
 |
 |
| Module-wise count rates for Quadrant C Data is divided into 100 sec bins |
 |
 |
| Module-wise count rates for Quadrant D Data is divided into 100 sec bins |
 |
 |
| Parameter | Plot |
|---|---|
| CZT HV Monitor | 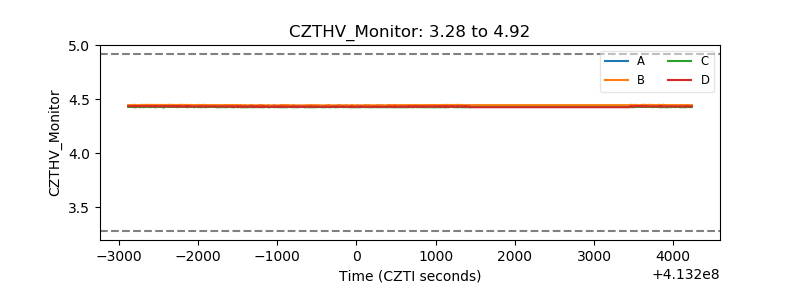 |
| D_VDD | 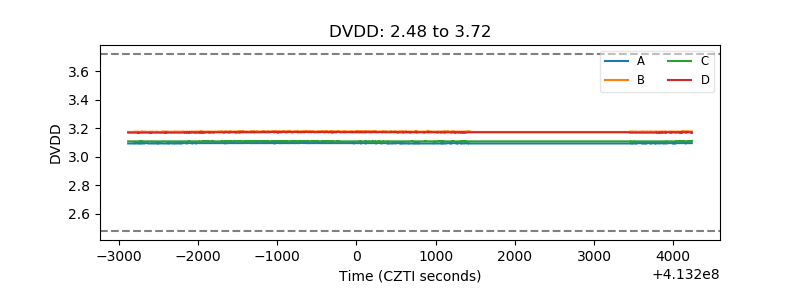 |
| Temperature 1 | 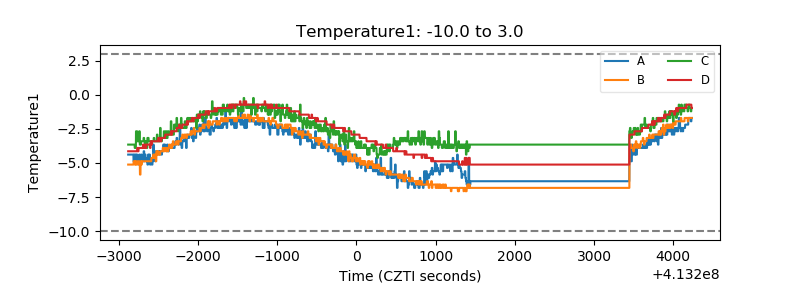 |
| Veto HV Monitor | 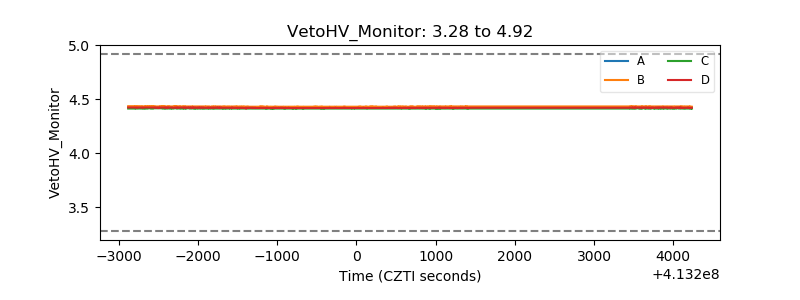 |
| Veto LLD | 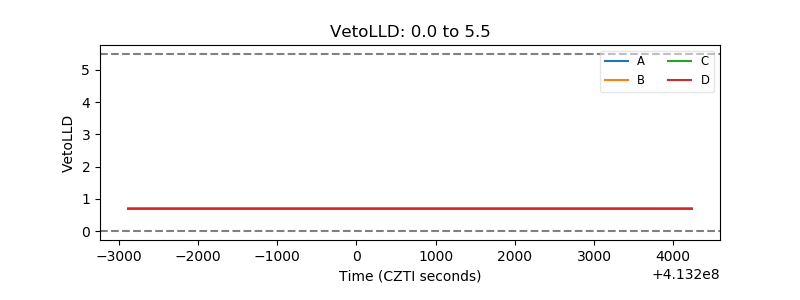 |
| Alpha Counter | 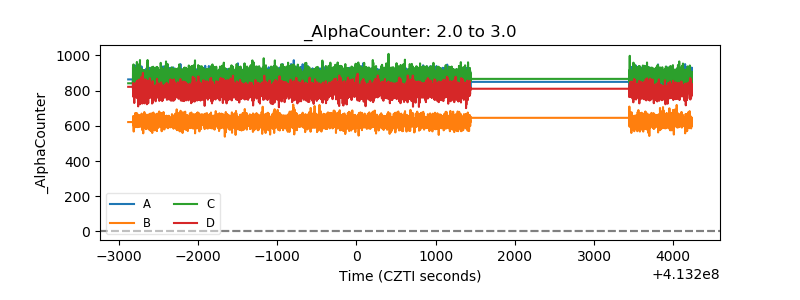 |
| _CPM_Rate | 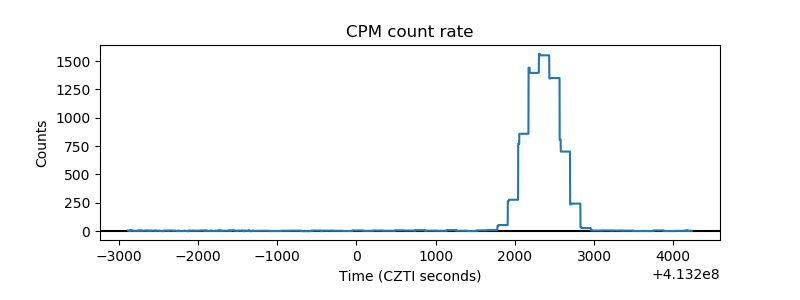 |
| CZT Counter | 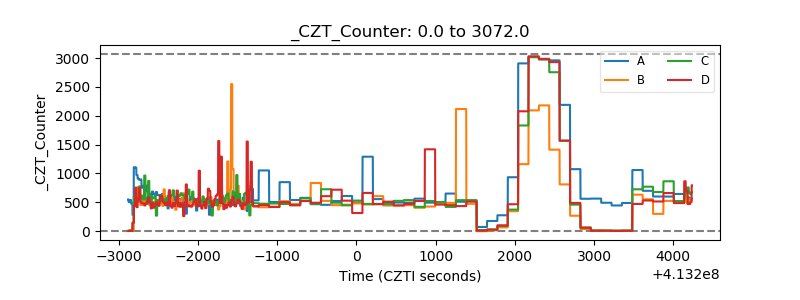 |
| +2.5 Volts monitor | 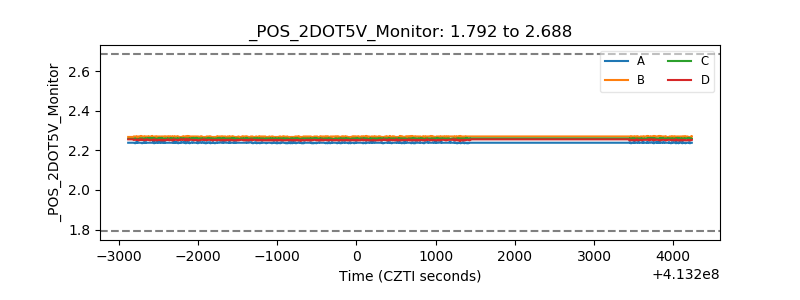 |
| +5 Volts monitor | 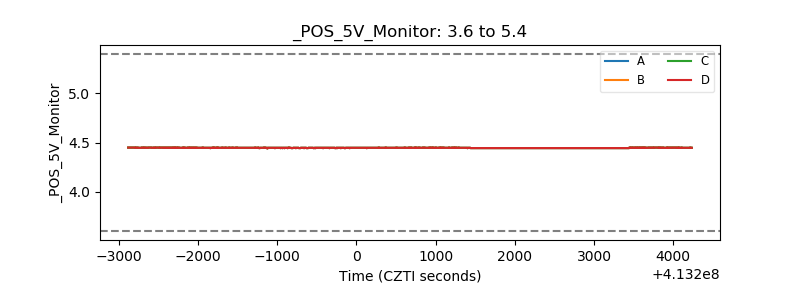 |
| _ROLL_ROT | 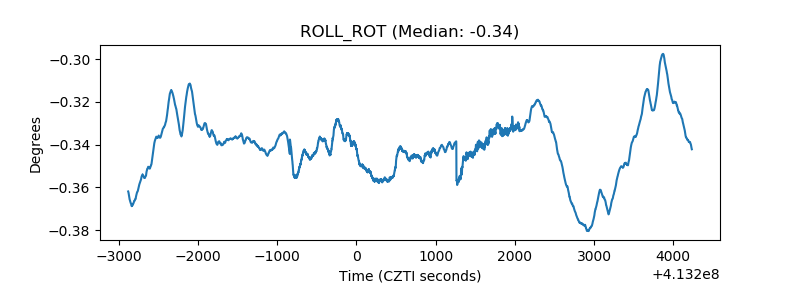 |
| _Roll_DEC | 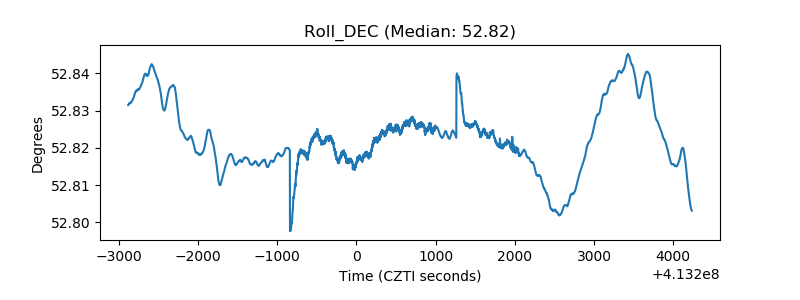 |
| _Roll_RA | 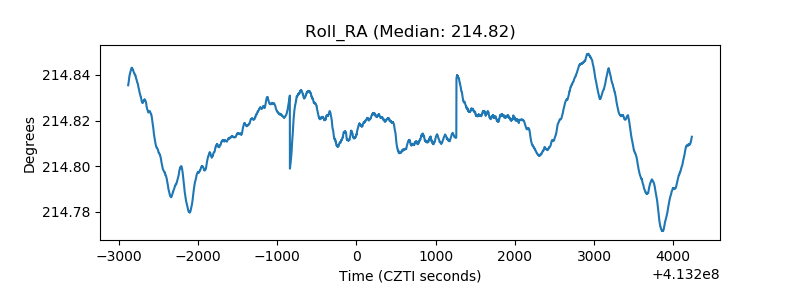 |
| Veto Counter | 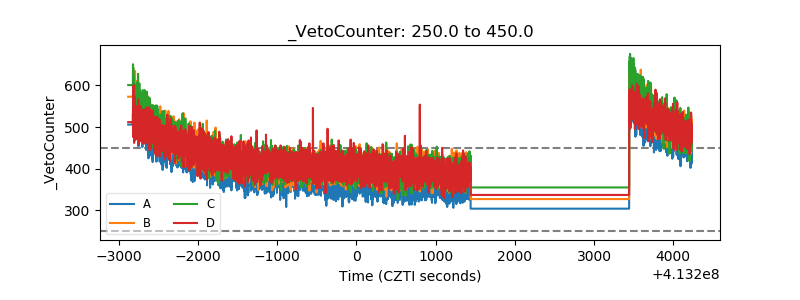 |