| Param | Original file | Final file |
|---|---|---|
| Filename | modeM0/AS1A12_022T01_9000005494_39765cztM0_level2.fits | modeM0/AS1A12_022T01_9000005494_39765cztM0_level2_quad_clean.evt |
| Size (bytes) | 395,081,280 | 98,346,240 |
| Size | 376.8 MB | 93.8 MB |
| Events in quadrant A | 3,669,285 | 677,316 |
| Events in quadrant B | 2,755,564 | 703,175 |
| Events in quadrant C | 3,809,014 | 652,283 |
| Events in quadrant D | 3,981,157 | 576,610 |
| Mode SS | |||
|---|---|---|---|
| Quadrant | BADHDUFLAG | Total packets | Discarded packets |
| A | 0 | 106 | 0 |
| B | 0 | 106 | 0 |
| C | 0 | 106 | 0 |
| D | 0 | 106 | 0 |
| Mode M0 | |||
|---|---|---|---|
| Quadrant | BADHDUFLAG | Total packets | Discarded packets |
| A | 0 | 14075 | 2 |
| B | 0 | 11319 | 1 |
| C | 0 | 14892 | 1 |
| D | 0 | 15167 | 1 |
| Mode M9 | |||
|---|---|---|---|
| Quadrant | BADHDUFLAG | Total packets | Discarded packets |
| A | 0 | 27 | 0 |
| B | 0 | 27 | 0 |
| C | 0 | 27 | 0 |
| D | 0 | 28 | 0 |
| Quadrant | Total seconds | Saturated seconds | Saturation percentage |
|---|---|---|---|
| A | 5269 | 212 | 4.023534% |
| B | 5269 | 36 | 0.683242% |
| C | 5269 | 34 | 0.645284% |
| D | 5269 | 381 | 7.230974% |
Noise dominated data is calculated using 1-second bins in cleaned event files. If a bin has >2000 counts, and if more than 50% of those come from <1% of pixels, then it is considered to be noise-dominated and hence unusable.
| Quadrant | # 1 sec bins | Bins with >0 counts | Bins with >2000 counts | High rate bins dominated by noise | Noise dominated (total time) | Noise dominated (detector-on time) | Marked lightcurve |
|---|---|---|---|---|---|---|---|
| A | 7363 | 5269 | 134 | 134 | 1.82% | 2.54% | 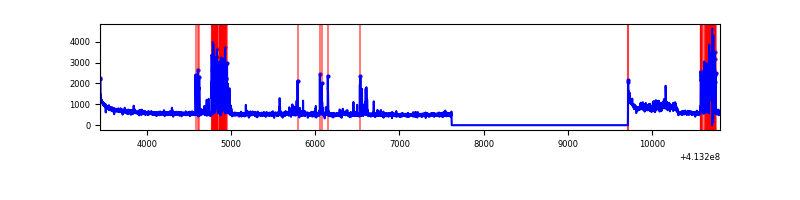 |
| B | 7363 | 5270 | 22 | 22 | 0.30% | 0.42% | 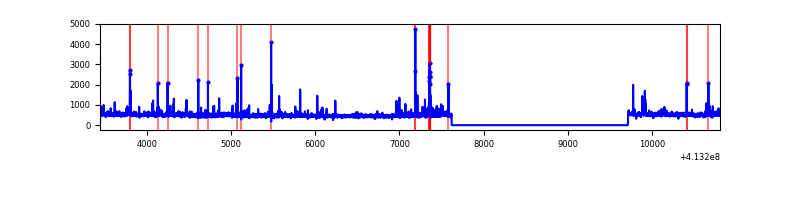 |
| C | 7363 | 5270 | 27 | 27 | 0.37% | 0.51% | 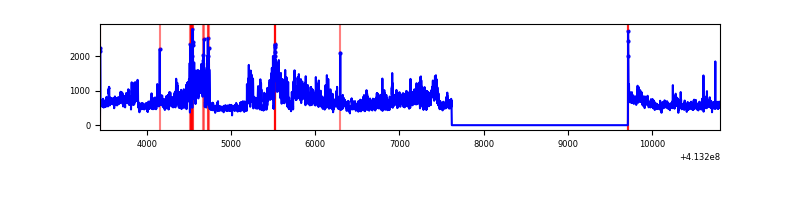 |
| D | 7363 | 5270 | 321 | 321 | 4.36% | 6.09% | 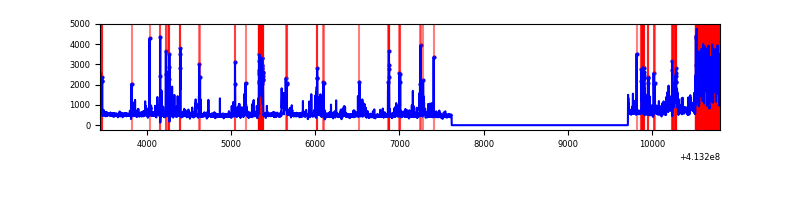 |
Top three noisy pixels from each quadrant. If the there are fewer than three noisy pixels in the level2.evt file, extra rows are filled as -1
| Pixel properties | Quadrant properties | ||||||
|---|---|---|---|---|---|---|---|
| Quadrant | DetID | PixID | Counts | Sigma | Mean | Median | Sigma |
| A | 13 | 248 | 521672 | 4069.68 | 634 | 624 | 128.0 |
| A | 10 | 83 | 467164 | 3643.94 | 634 | 624 | 128.0 |
| A | 13 | 210 | 108898 | 845.68 | 634 | 624 | 128.0 |
| B | 5 | 172 | 131831 | 1098.26 | 632 | 615 | 119.5 |
| B | 5 | 255 | 43988 | 363.03 | 632 | 615 | 119.5 |
| B | 0 | 190 | 39049 | 321.69 | 632 | 615 | 119.5 |
| C | 15 | 208 | 1116518 | 7844.94 | 615 | 620 | 142.2 |
| C | 15 | 214 | 218132 | 1529.14 | 615 | 620 | 142.2 |
| C | 3 | 233 | 44803 | 310.61 | 615 | 620 | 142.2 |
| D | 12 | 233 | 668543 | 4512.9 | 603 | 585 | 148.0 |
| D | 12 | 227 | 295874 | 1995.05 | 603 | 585 | 148.0 |
| D | 13 | 249 | 191933 | 1292.8 | 603 | 585 | 148.0 |
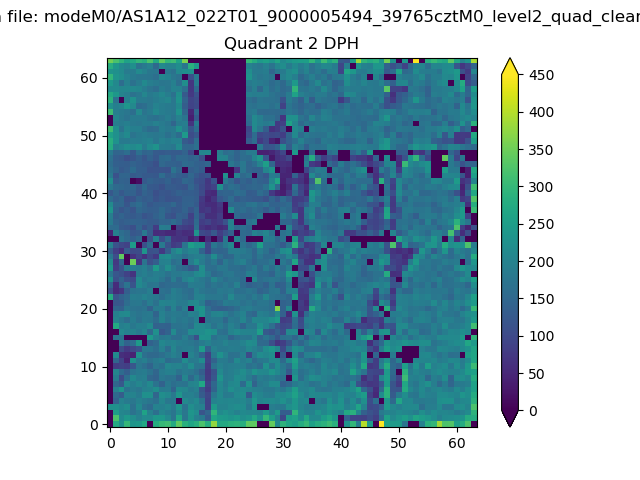
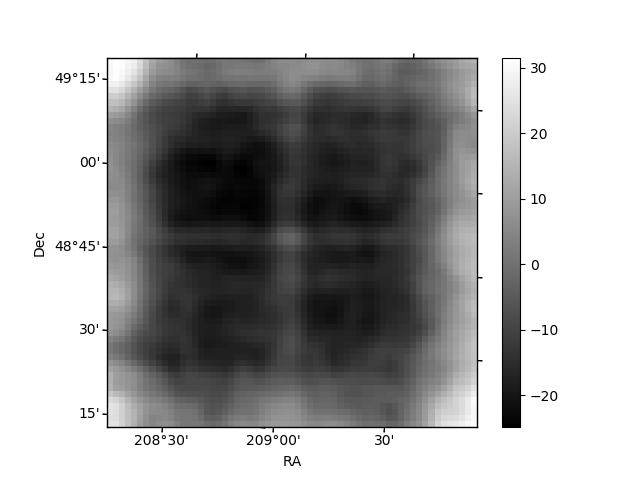
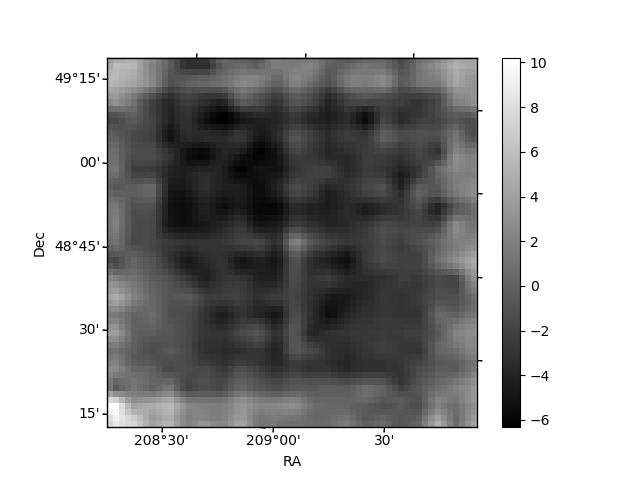
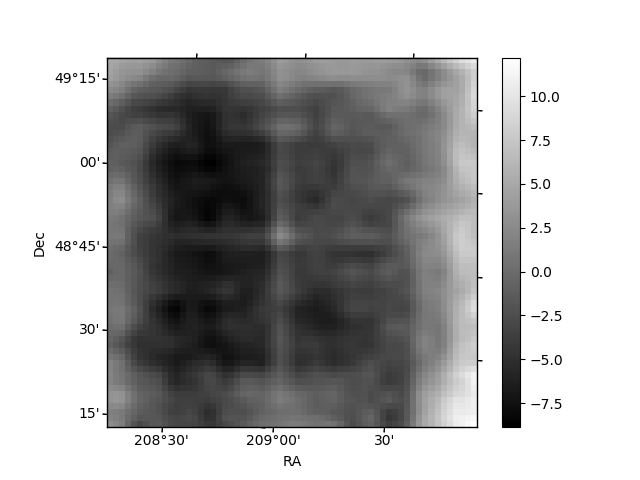
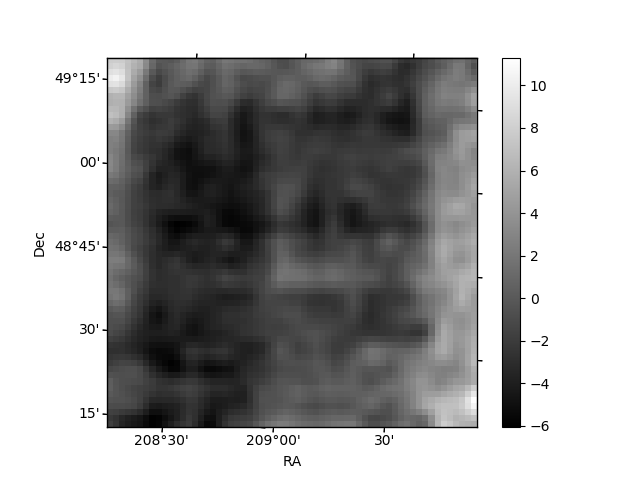
Histogram calculated using DETX and DETY for each event in the final _common_clean file
| Quadrant A | 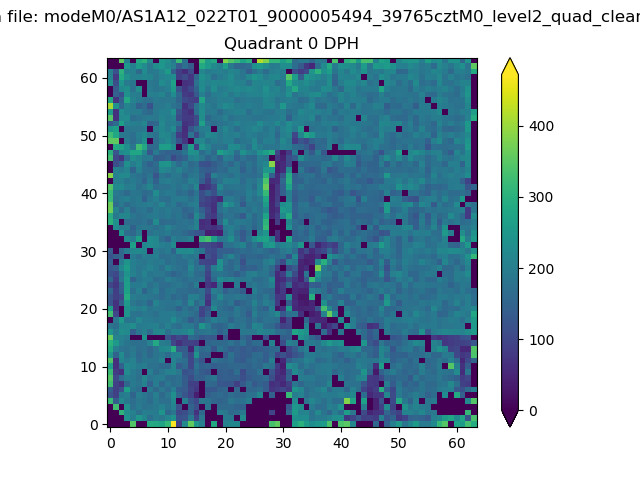 |
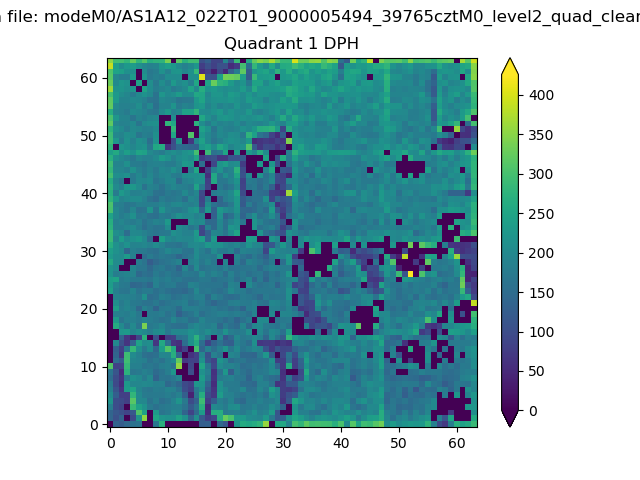 |
Quadrant B |
|---|---|---|---|
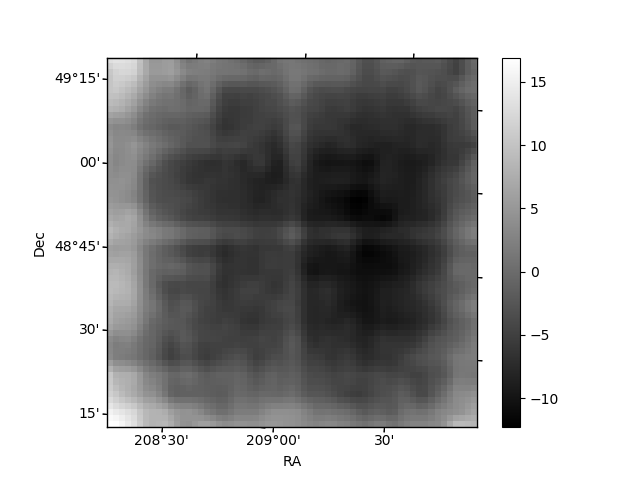
| Quadrant D | 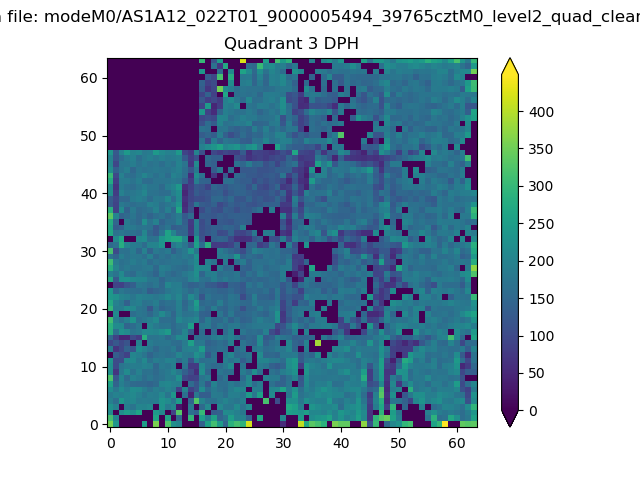 |
 |
Quadrant C |
| Plot type | Count rate plots | Images |
|---|---|---|
| Comparison with Poisson distribution Blue bars denote a histogram of data divided into 1 sec bins. Red curve is a Poisson curve with rate = median count rate of data. |
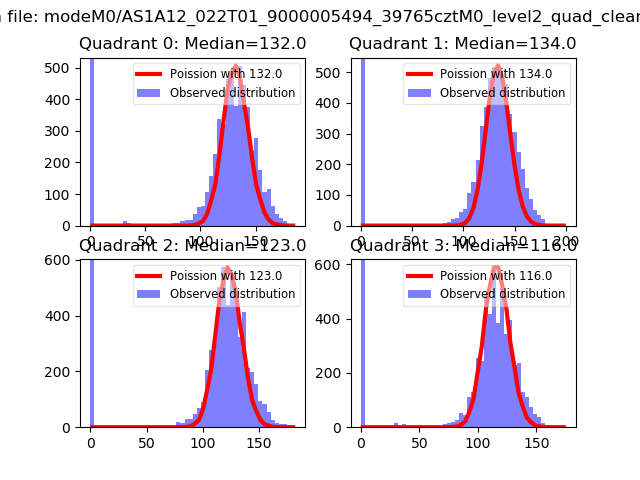 |
 |
| Quadrant-wise count rates Data is divided into 100 sec bins |
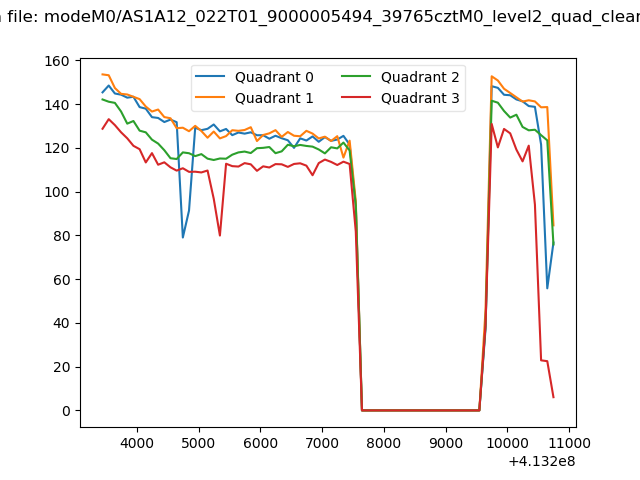 |
|
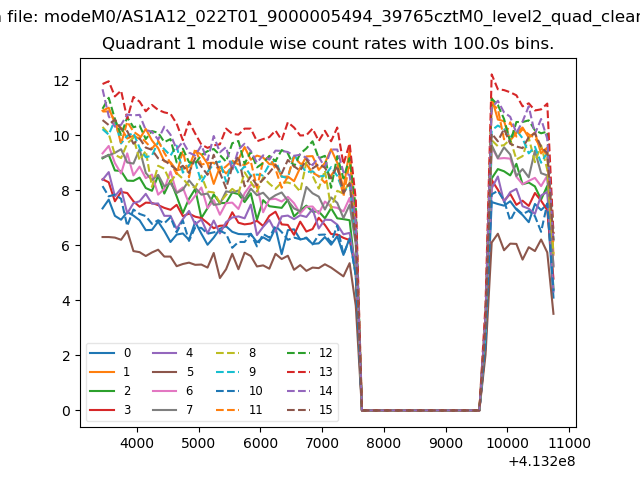
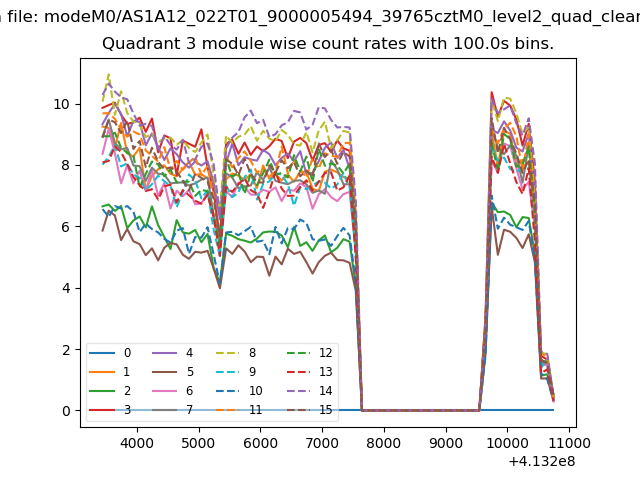
| Module-wise count rates for Quadrant A Data is divided into 100 sec bins |
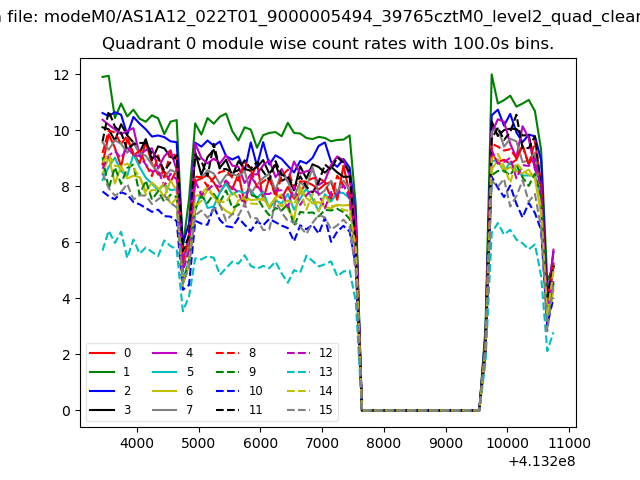 |
 |
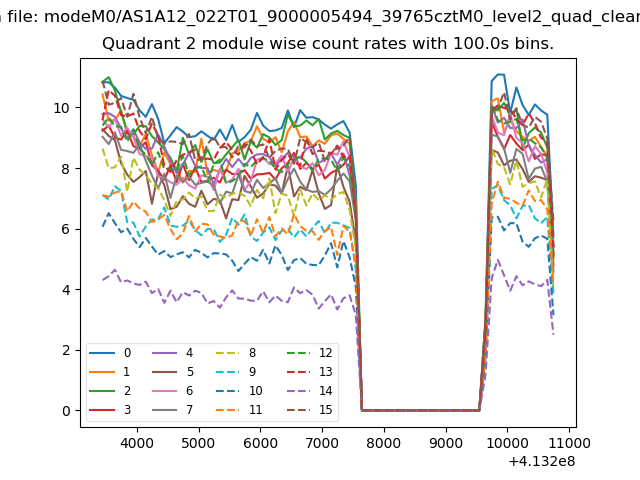
| Module-wise count rates for Quadrant B Data is divided into 100 sec bins |
 |
 |
| Module-wise count rates for Quadrant C Data is divided into 100 sec bins |
 |
 |
| Module-wise count rates for Quadrant D Data is divided into 100 sec bins |
 |
 |
| Parameter | Plot |
|---|---|
| CZT HV Monitor | 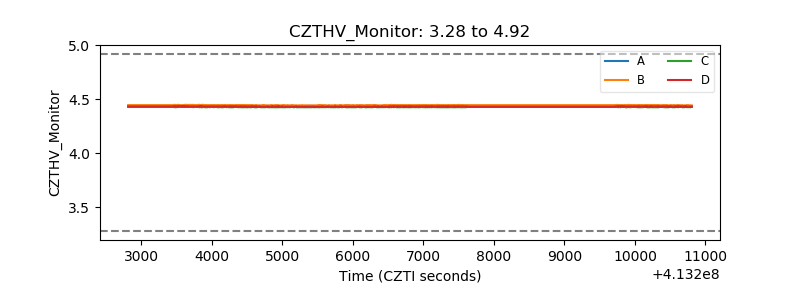 |
| D_VDD | 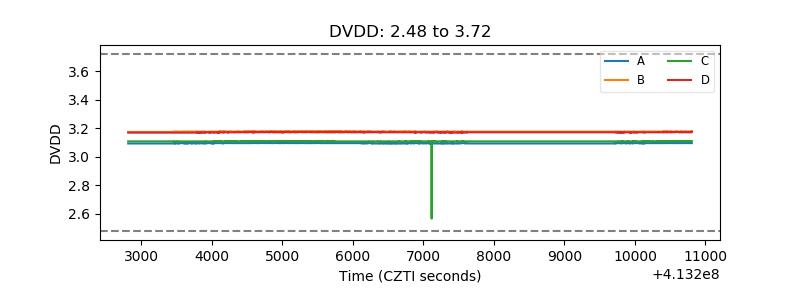 |
| Temperature 1 | 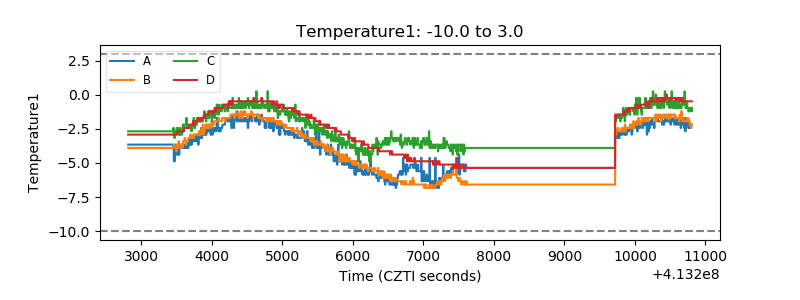 |
| Veto HV Monitor | 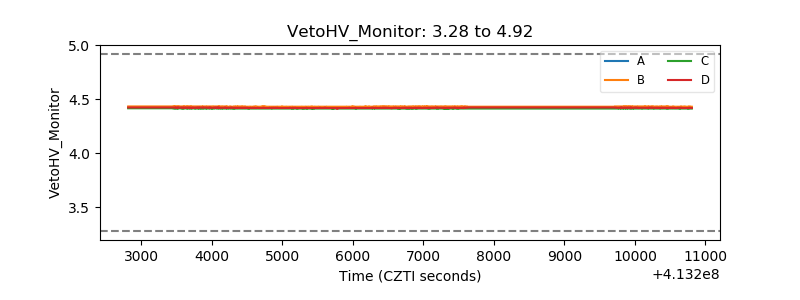 |
| Veto LLD | 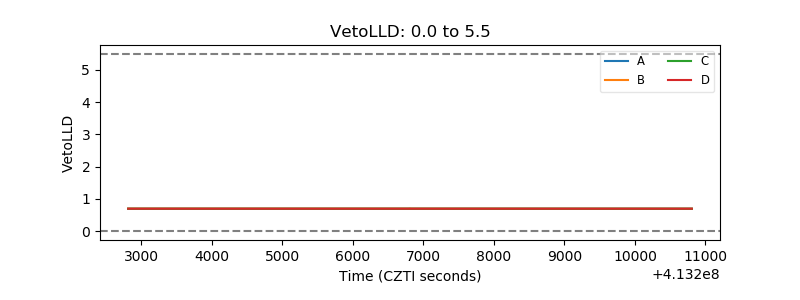 |
| Alpha Counter | 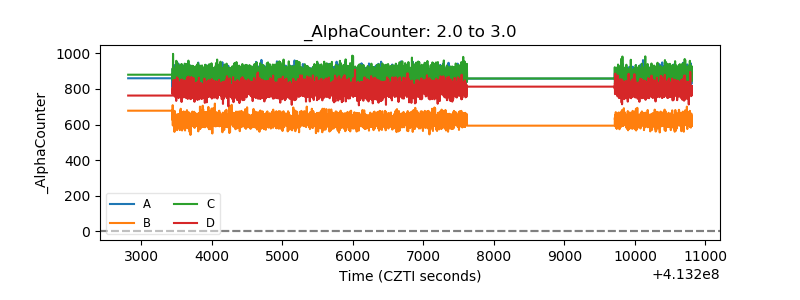 |
| _CPM_Rate | 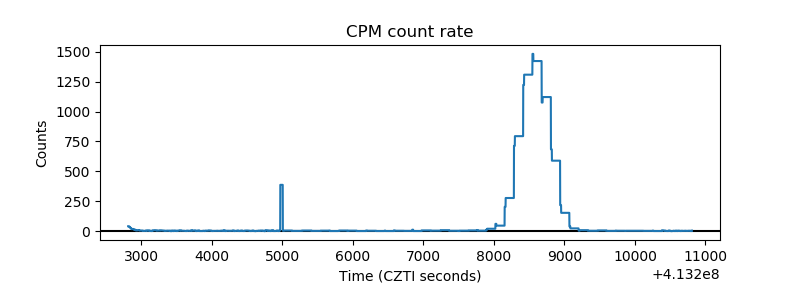 |
| CZT Counter | 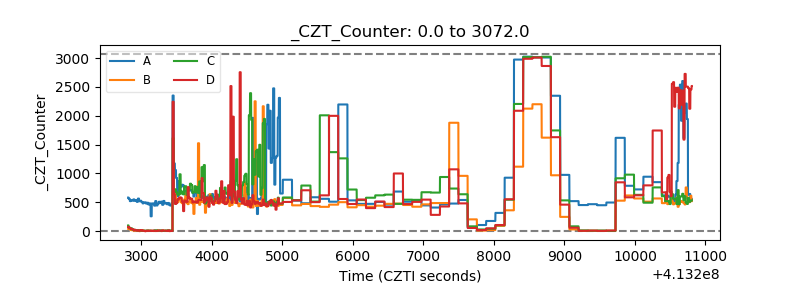 |
| +2.5 Volts monitor | 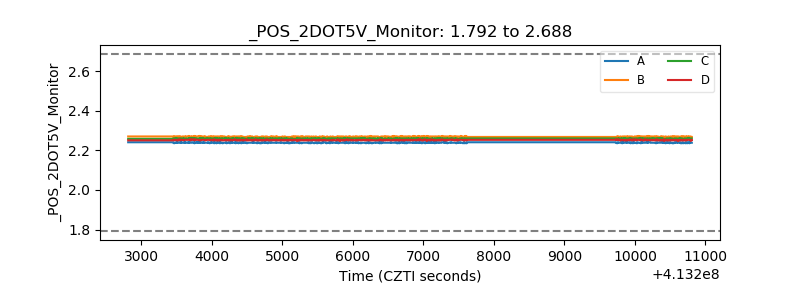 |
| +5 Volts monitor | 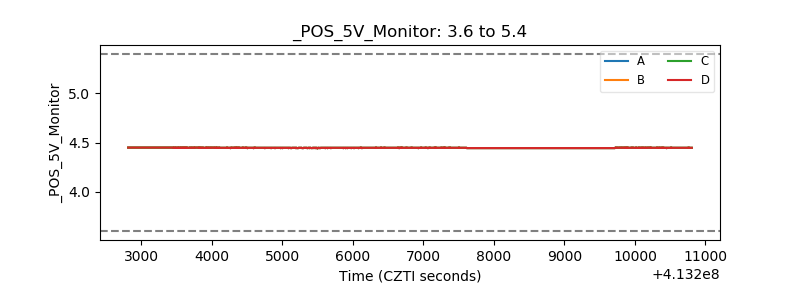 |
| _ROLL_ROT | 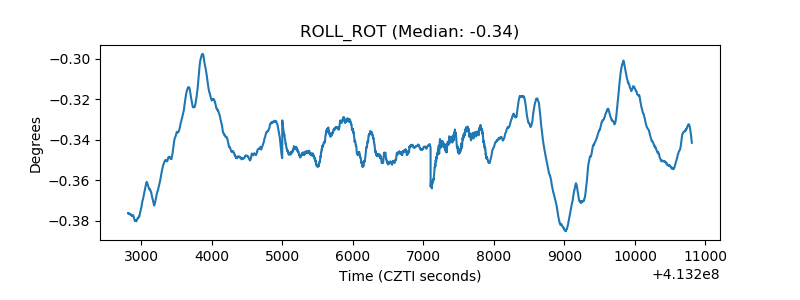 |
| _Roll_DEC | 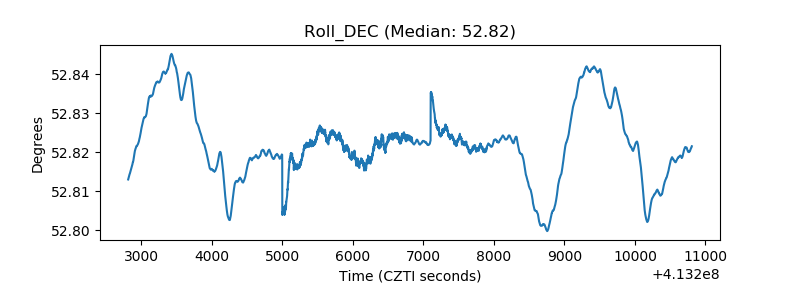 |
| _Roll_RA | 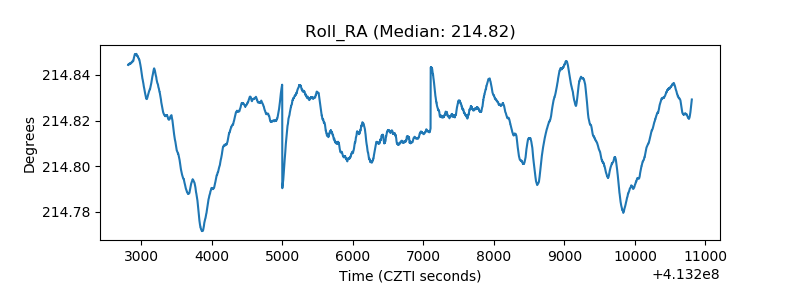 |
| Veto Counter | 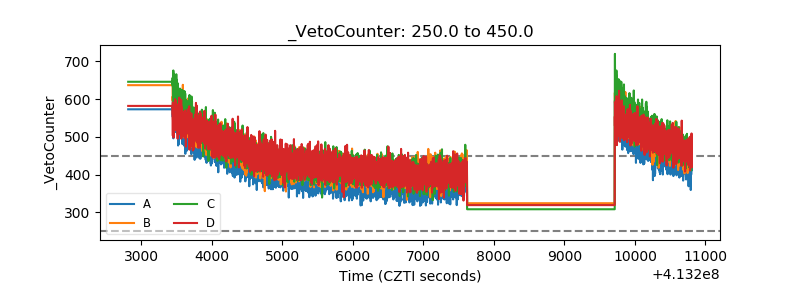 |