| Param | Original file | Final file |
|---|---|---|
| Filename | modeM0/AS1A12_022T01_9000005494_39766cztM0_level2.fits | modeM0/AS1A12_022T01_9000005494_39766cztM0_level2_quad_clean.evt |
| Size (bytes) | 421,732,800 | 91,880,640 |
| Size | 402.2 MB | 87.6 MB |
| Events in quadrant A | 3,285,011 | 658,163 |
| Events in quadrant B | 2,631,835 | 675,747 |
| Events in quadrant C | 3,067,650 | 630,492 |
| Events in quadrant D | 6,228,379 | 459,183 |
| Mode SS | |||
|---|---|---|---|
| Quadrant | BADHDUFLAG | Total packets | Discarded packets |
| A | 0 | 104 | 0 |
| B | 0 | 104 | 0 |
| C | 0 | 104 | 0 |
| D | 0 | 104 | 0 |
| Mode M0 | |||
|---|---|---|---|
| Quadrant | BADHDUFLAG | Total packets | Discarded packets |
| A | 0 | 12891 | 2 |
| B | 0 | 10905 | 1 |
| C | 0 | 12342 | 1 |
| D | 0 | 21958 | 1 |
| Mode M9 | |||
|---|---|---|---|
| Quadrant | BADHDUFLAG | Total packets | Discarded packets |
| A | 0 | 23 | 0 |
| B | 0 | 23 | 0 |
| C | 0 | 23 | 0 |
| D | 0 | 24 | 0 |
| Quadrant | Total seconds | Saturated seconds | Saturation percentage |
|---|---|---|---|
| A | 5121 | 120 | 2.343292% |
| B | 5121 | 29 | 0.566296% |
| C | 5121 | 17 | 0.331966% |
| D | 5121 | 1324 | 25.854325% |
Noise dominated data is calculated using 1-second bins in cleaned event files. If a bin has >2000 counts, and if more than 50% of those come from <1% of pixels, then it is considered to be noise-dominated and hence unusable.
| Quadrant | # 1 sec bins | Bins with >0 counts | Bins with >2000 counts | High rate bins dominated by noise | Noise dominated (total time) | Noise dominated (detector-on time) | Marked lightcurve |
|---|---|---|---|---|---|---|---|
| A | 7274 | 5121 | 65 | 65 | 0.89% | 1.27% | 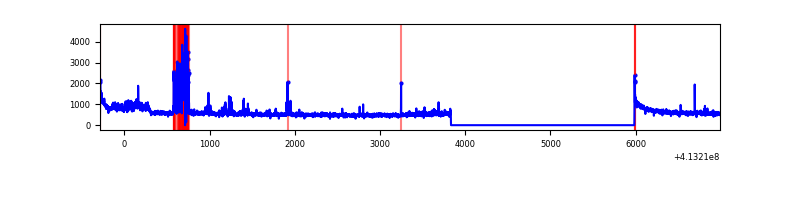 |
| B | 7274 | 5122 | 20 | 20 | 0.27% | 0.39% | 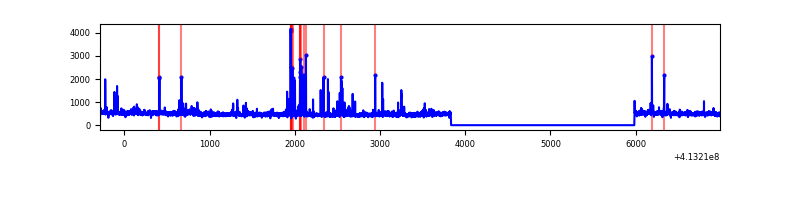 |
| C | 7274 | 5122 | 12 | 12 | 0.16% | 0.23% | 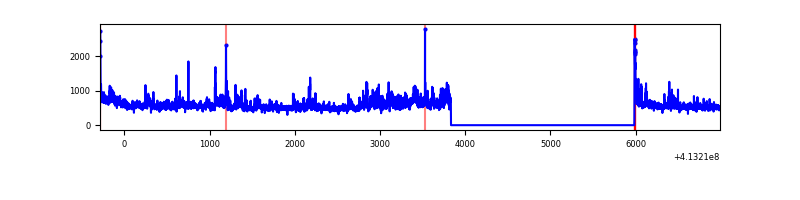 |
| D | 7274 | 5122 | 1155 | 1155 | 15.88% | 22.55% | 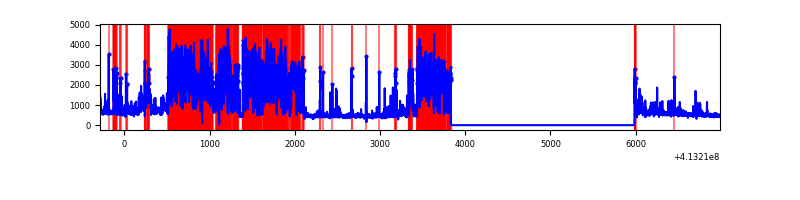 |
Top three noisy pixels from each quadrant. If the there are fewer than three noisy pixels in the level2.evt file, extra rows are filled as -1
| Pixel properties | Quadrant properties | ||||||
|---|---|---|---|---|---|---|---|
| Quadrant | DetID | PixID | Counts | Sigma | Mean | Median | Sigma |
| A | 10 | 83 | 461983 | 3757.24 | 611 | 599 | 122.8 |
| A | 13 | 248 | 255823 | 2078.39 | 611 | 599 | 122.8 |
| A | 13 | 210 | 108899 | 881.93 | 611 | 599 | 122.8 |
| B | 5 | 172 | 88270 | 763.48 | 607 | 591 | 114.8 |
| B | 5 | 255 | 66251 | 571.75 | 607 | 591 | 114.8 |
| B | 0 | 230 | 40018 | 343.32 | 607 | 591 | 114.8 |
| C | 15 | 208 | 410952 | 3000.87 | 596 | 601 | 136.7 |
| C | 15 | 214 | 211910 | 1545.29 | 596 | 601 | 136.7 |
| C | 3 | 233 | 95468 | 693.76 | 596 | 601 | 136.7 |
| D | 12 | 233 | 3491679 | 26488.14 | 535 | 518 | 131.8 |
| D | 12 | 227 | 317244 | 2403.06 | 535 | 518 | 131.8 |
| D | 13 | 249 | 125018 | 944.61 | 535 | 518 | 131.8 |
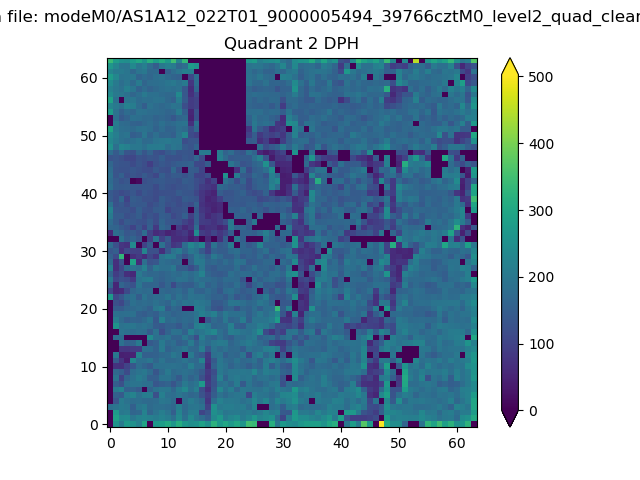
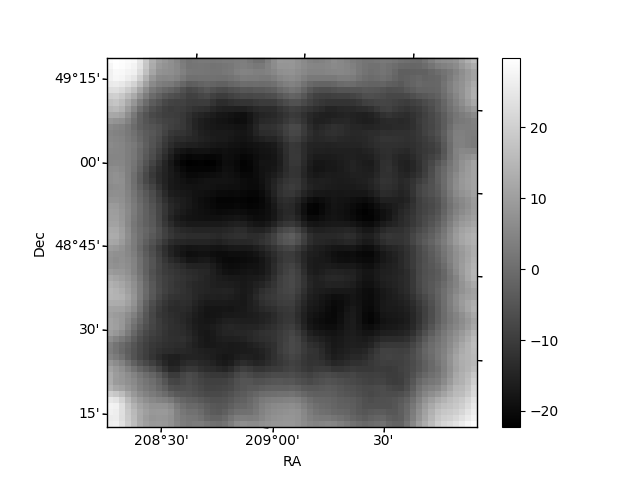
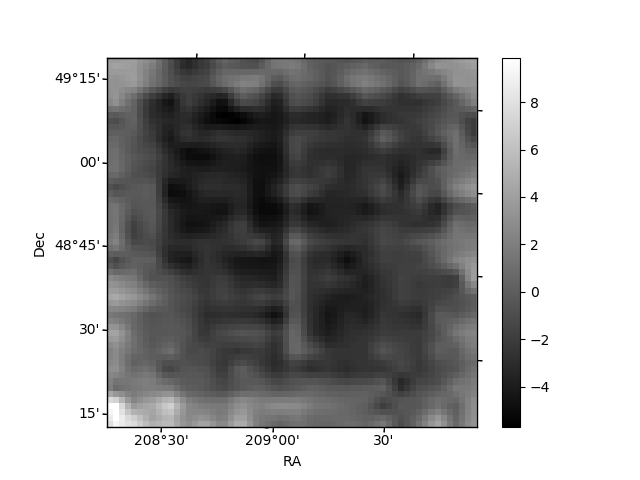
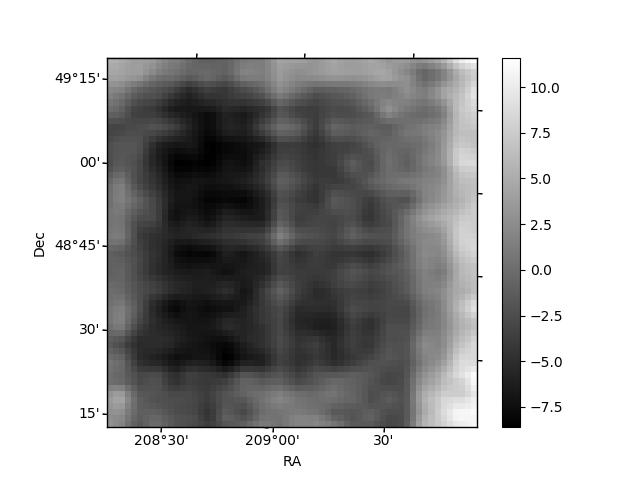
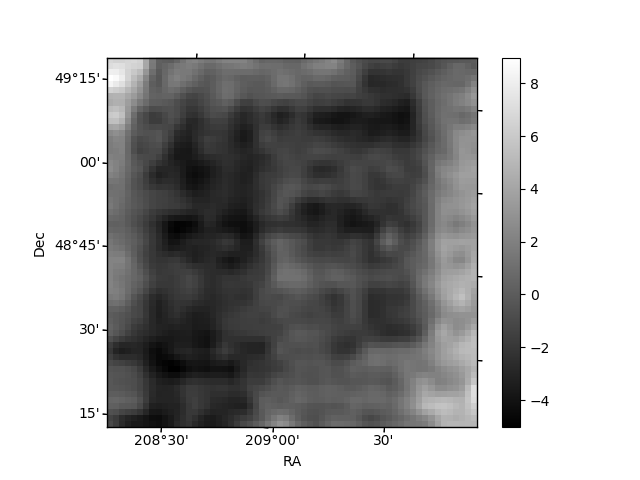
Histogram calculated using DETX and DETY for each event in the final _common_clean file
| Quadrant A | 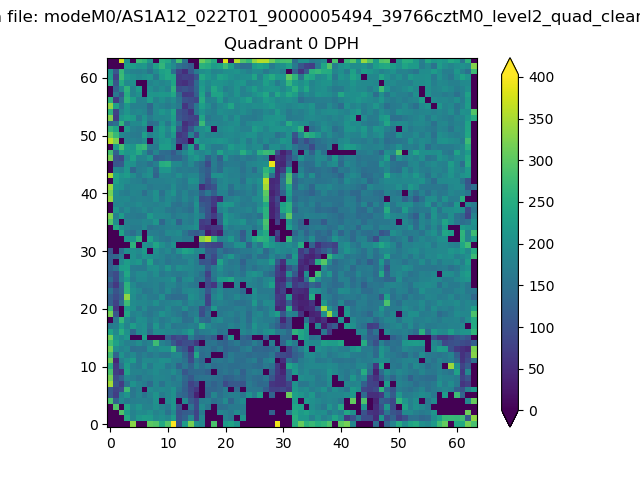 |
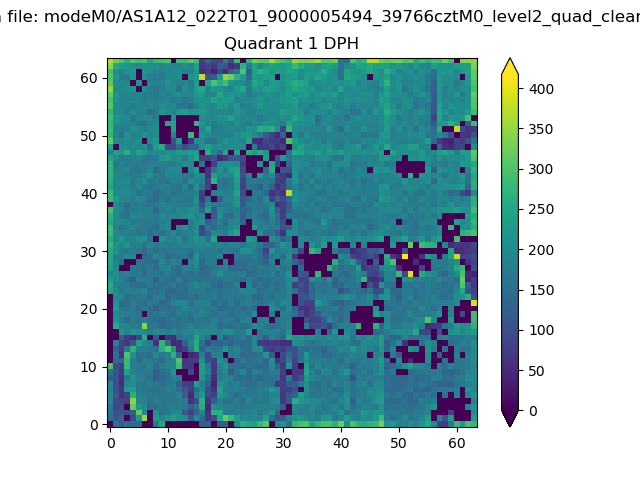 |
Quadrant B |
|---|---|---|---|
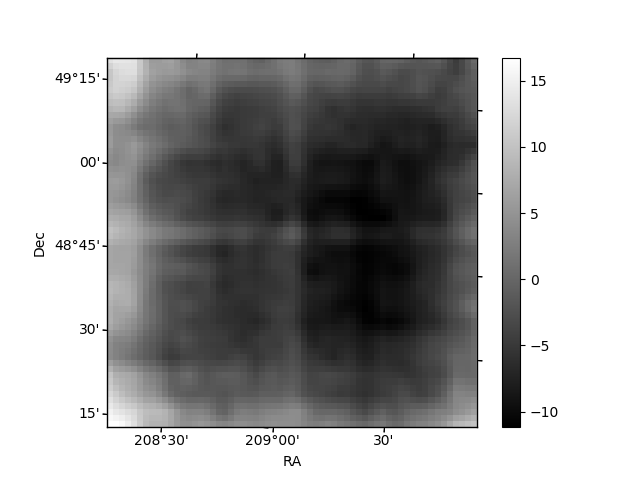
| Quadrant D | 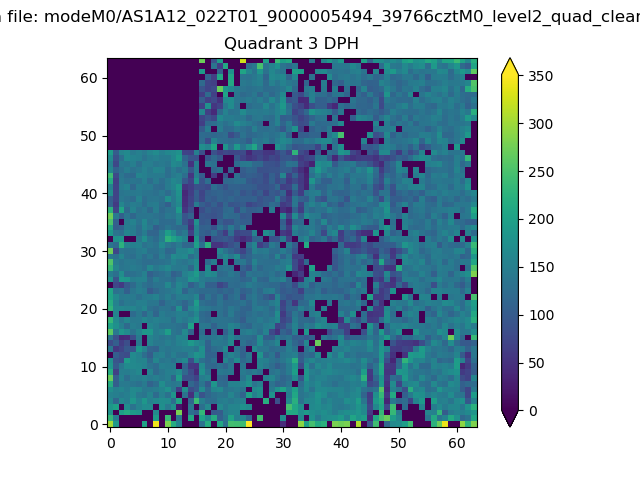 |
 |
Quadrant C |
| Plot type | Count rate plots | Images |
|---|---|---|
| Comparison with Poisson distribution Blue bars denote a histogram of data divided into 1 sec bins. Red curve is a Poisson curve with rate = median count rate of data. |
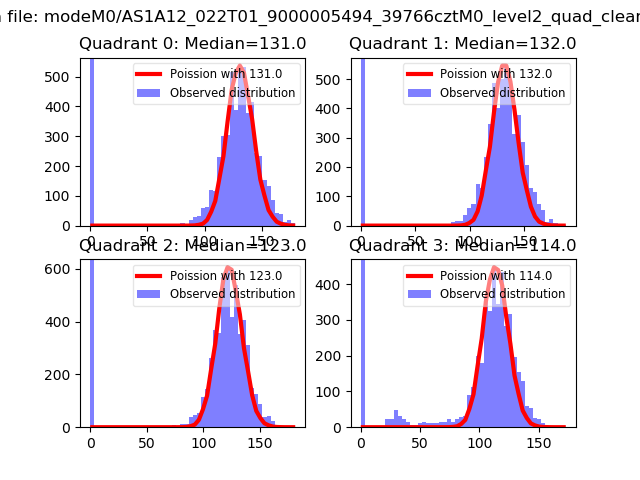 |
 |
| Quadrant-wise count rates Data is divided into 100 sec bins |
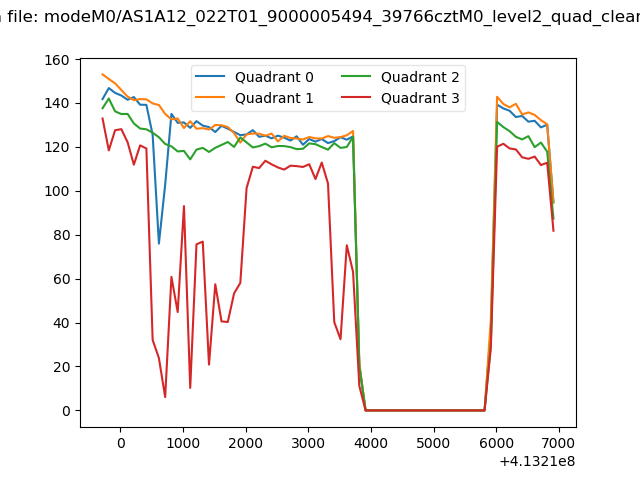 |
|
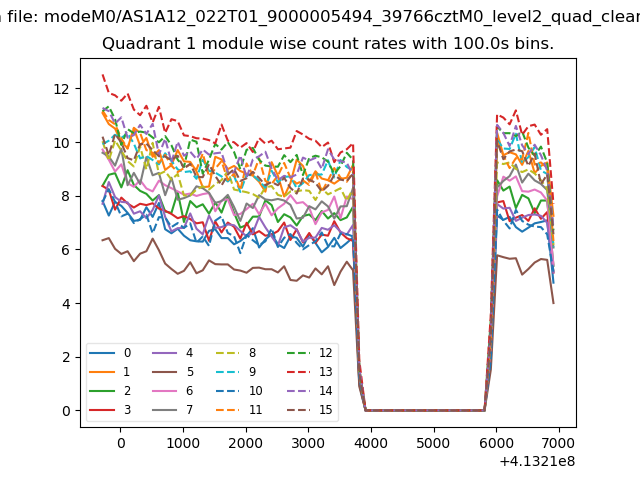
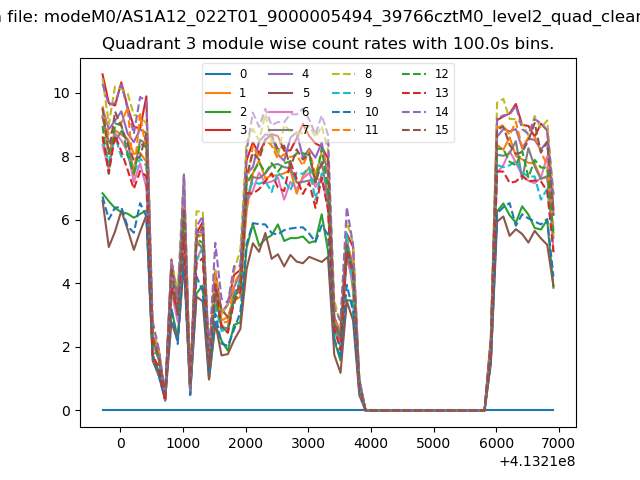
| Module-wise count rates for Quadrant A Data is divided into 100 sec bins |
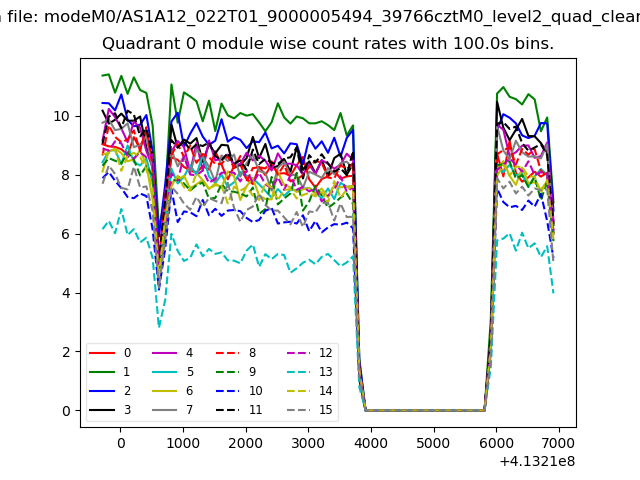 |
 |
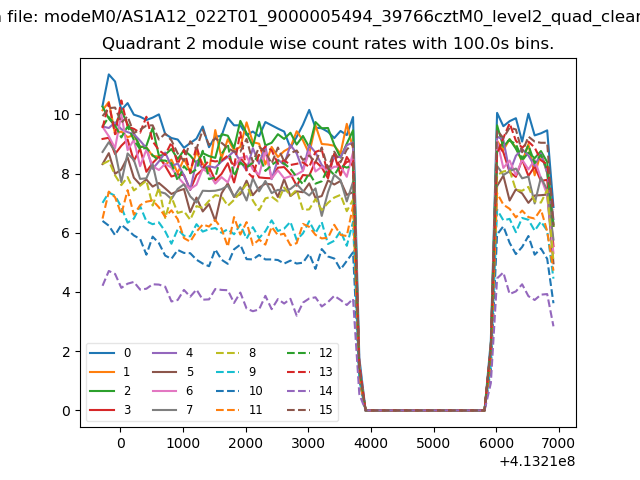
| Module-wise count rates for Quadrant B Data is divided into 100 sec bins |
 |
 |
| Module-wise count rates for Quadrant C Data is divided into 100 sec bins |
 |
 |
| Module-wise count rates for Quadrant D Data is divided into 100 sec bins |
 |
 |
| Parameter | Plot |
|---|---|
| CZT HV Monitor | 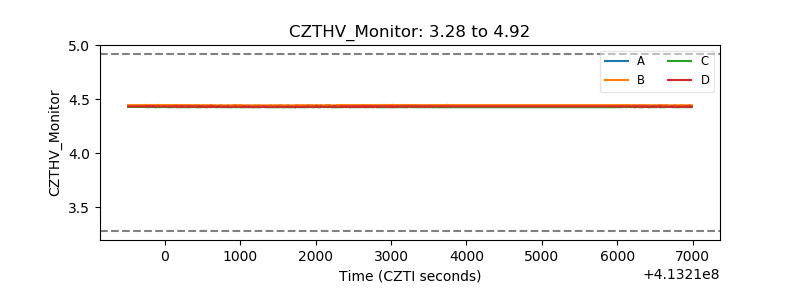 |
| D_VDD | 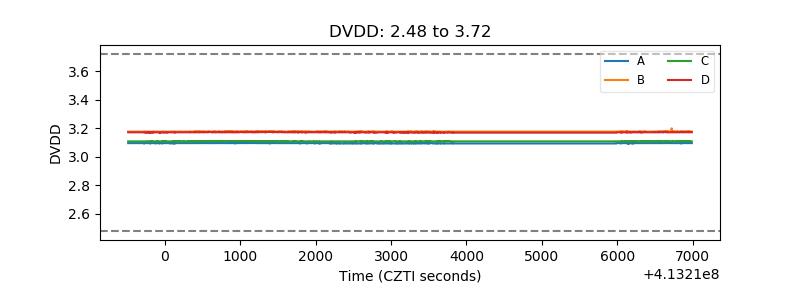 |
| Temperature 1 | 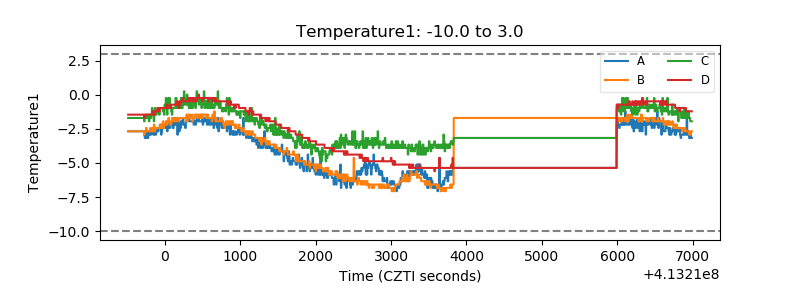 |
| Veto HV Monitor | 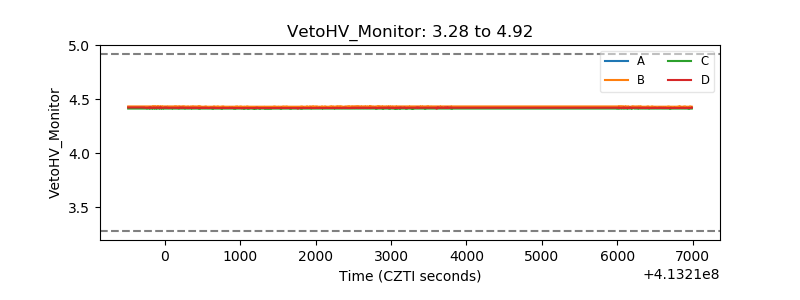 |
| Veto LLD | 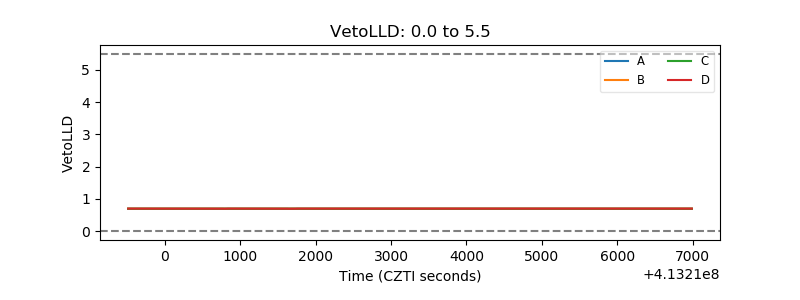 |
| Alpha Counter | 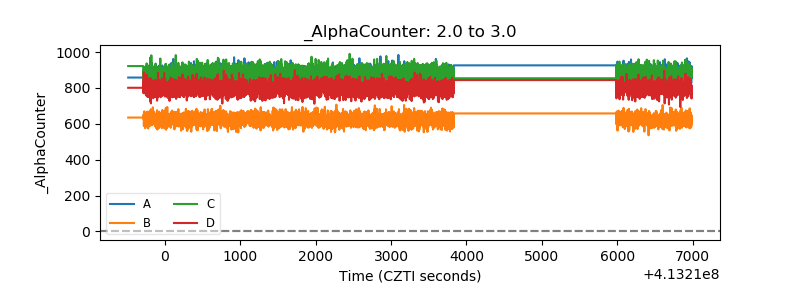 |
| _CPM_Rate | 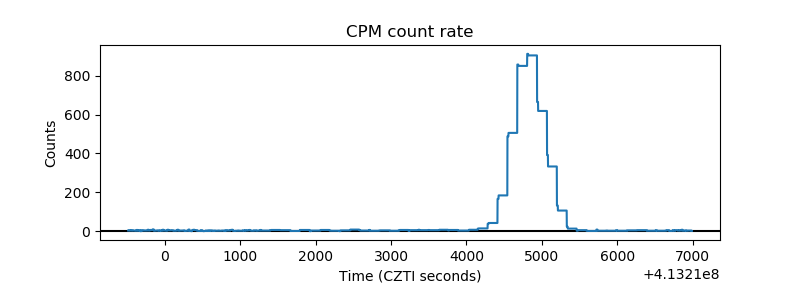 |
| CZT Counter | 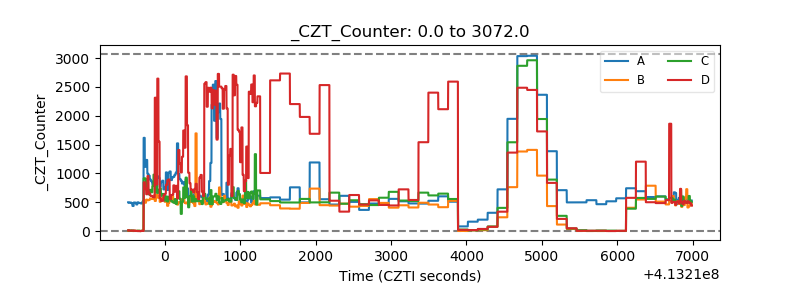 |
| +2.5 Volts monitor | 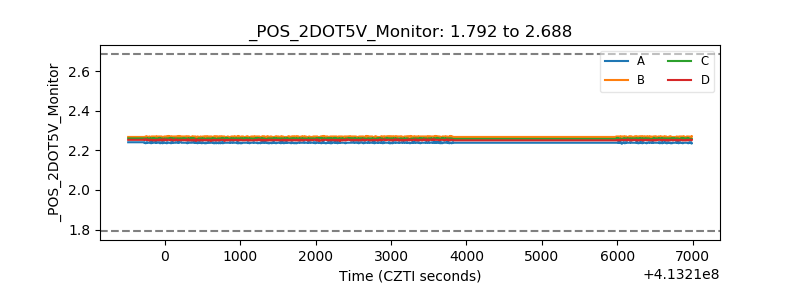 |
| +5 Volts monitor | 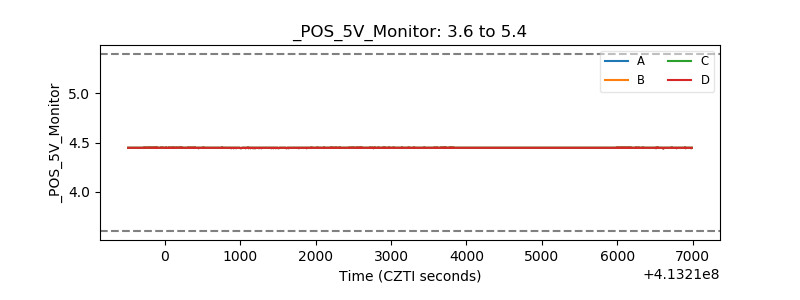 |
| _ROLL_ROT | 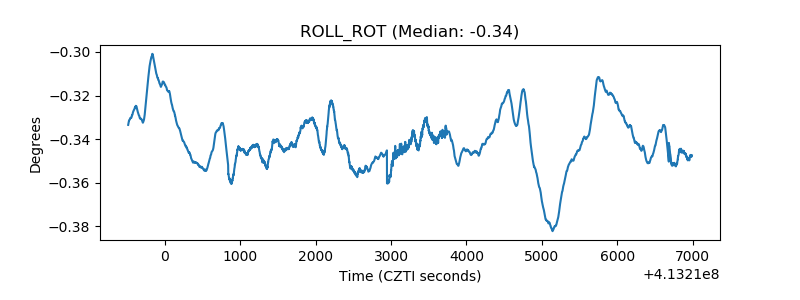 |
| _Roll_DEC | 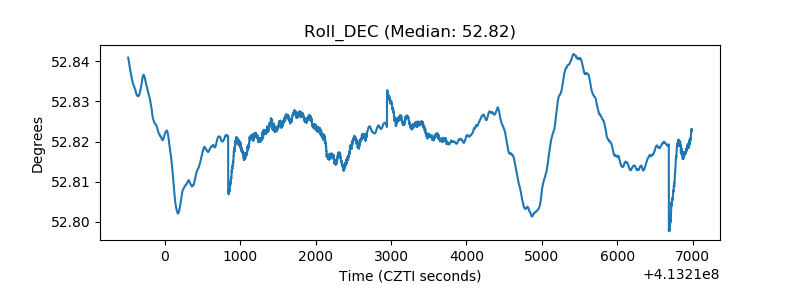 |
| _Roll_RA | 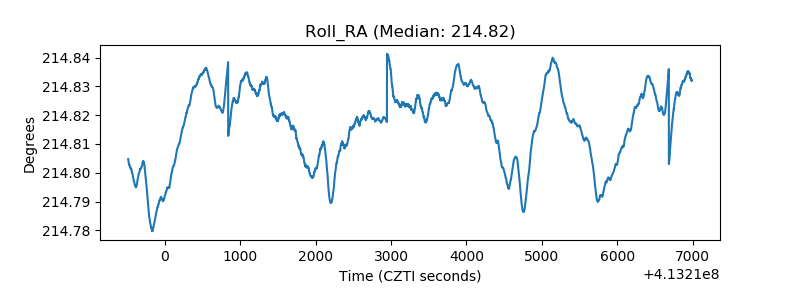 |
| Veto Counter | 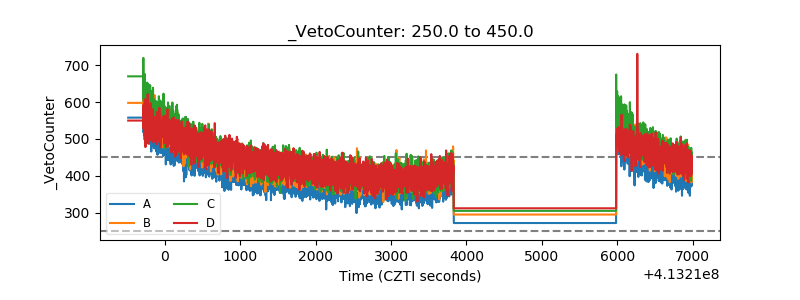 |