| Param | Original file | Final file |
|---|---|---|
| Filename | modeM0/AS1A12_022T01_9000005494_39767cztM0_level2.fits | modeM0/AS1A12_022T01_9000005494_39767cztM0_level2_quad_clean.evt |
| Size (bytes) | 327,456,000 | 92,586,240 |
| Size | 312.3 MB | 88.3 MB |
| Events in quadrant A | 2,841,807 | 634,059 |
| Events in quadrant B | 2,489,501 | 646,533 |
| Events in quadrant C | 2,918,580 | 603,614 |
| Events in quadrant D | 3,472,071 | 560,168 |
| Mode SS | |||
|---|---|---|---|
| Quadrant | BADHDUFLAG | Total packets | Discarded packets |
| A | 0 | 104 | 0 |
| B | 0 | 104 | 0 |
| C | 0 | 104 | 0 |
| D | 0 | 104 | 0 |
| Mode M0 | |||
|---|---|---|---|
| Quadrant | BADHDUFLAG | Total packets | Discarded packets |
| A | 0 | 11632 | 3 |
| B | 0 | 10635 | 2 |
| C | 0 | 11756 | 2 |
| D | 0 | 13666 | 2 |
| Mode M9 | |||
|---|---|---|---|
| Quadrant | BADHDUFLAG | Total packets | Discarded packets |
| A | 0 | 32 | 0 |
| B | 0 | 32 | 0 |
| C | 0 | 32 | 0 |
| D | 0 | 33 | 0 |
| Quadrant | Total seconds | Saturated seconds | Saturation percentage |
|---|---|---|---|
| A | 5129 | 23 | 0.448430% |
| B | 5129 | 12 | 0.233964% |
| C | 5129 | 35 | 0.682394% |
| D | 5129 | 109 | 2.125171% |
Noise dominated data is calculated using 1-second bins in cleaned event files. If a bin has >2000 counts, and if more than 50% of those come from <1% of pixels, then it is considered to be noise-dominated and hence unusable.
| Quadrant | # 1 sec bins | Bins with >0 counts | Bins with >2000 counts | High rate bins dominated by noise | Noise dominated (total time) | Noise dominated (detector-on time) | Marked lightcurve |
|---|---|---|---|---|---|---|---|
| A | 7222 | 5130 | 8 | 8 | 0.11% | 0.16% | 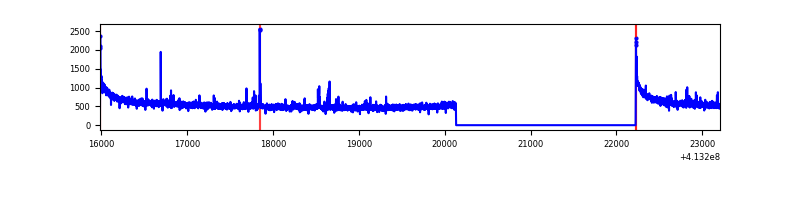 |
| B | 7222 | 5130 | 6 | 6 | 0.08% | 0.12% | 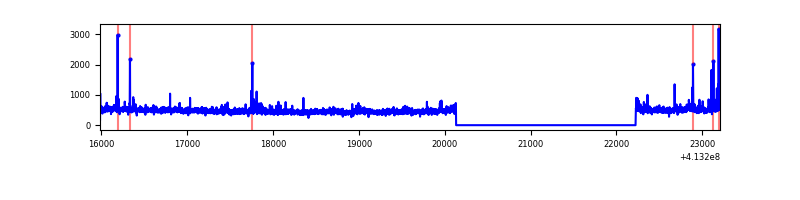 |
| C | 7222 | 5130 | 25 | 25 | 0.35% | 0.49% | 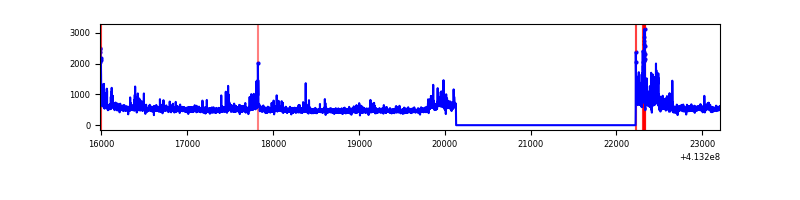 |
| D | 7222 | 5130 | 108 | 108 | 1.50% | 2.11% | 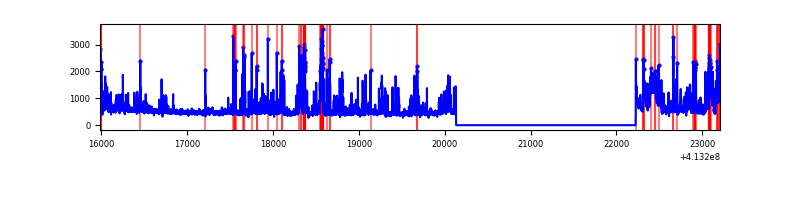 |
Top three noisy pixels from each quadrant. If the there are fewer than three noisy pixels in the level2.evt file, extra rows are filled as -1
| Pixel properties | Quadrant properties | ||||||
|---|---|---|---|---|---|---|---|
| Quadrant | DetID | PixID | Counts | Sigma | Mean | Median | Sigma |
| A | 10 | 83 | 467985 | 3865.19 | 593 | 582 | 120.9 |
| A | 2 | 79 | 24815 | 200.39 | 593 | 582 | 120.9 |
| A | 13 | 248 | 23263 | 187.56 | 593 | 582 | 120.9 |
| B | 5 | 255 | 58219 | 516.46 | 590 | 575 | 111.6 |
| B | 0 | 190 | 47209 | 417.81 | 590 | 575 | 111.6 |
| B | 0 | 230 | 26771 | 234.7 | 590 | 575 | 111.6 |
| C | 15 | 208 | 325360 | 2435.59 | 579 | 582 | 133.3 |
| C | 15 | 214 | 213015 | 1593.09 | 579 | 582 | 133.3 |
| C | 3 | 233 | 50022 | 370.76 | 579 | 582 | 133.3 |
| D | 12 | 227 | 575864 | 4011.27 | 579 | 561 | 143.4 |
| D | 12 | 233 | 363442 | 2530.17 | 579 | 561 | 143.4 |
| D | 13 | 249 | 85711 | 593.7 | 579 | 561 | 143.4 |
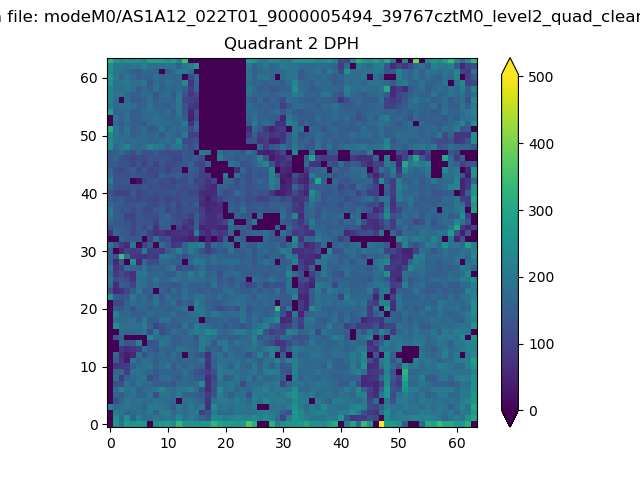
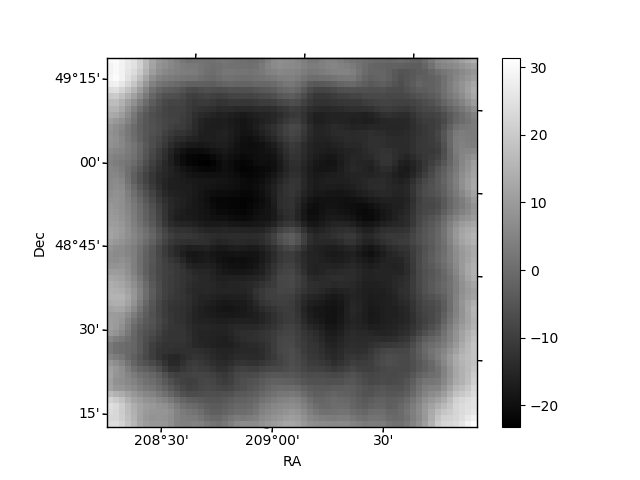
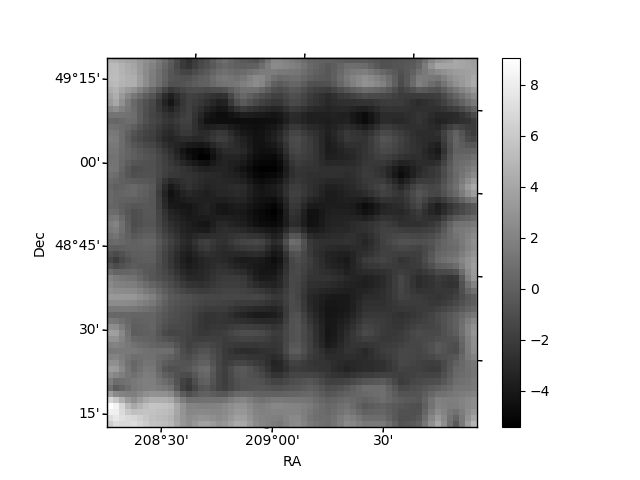
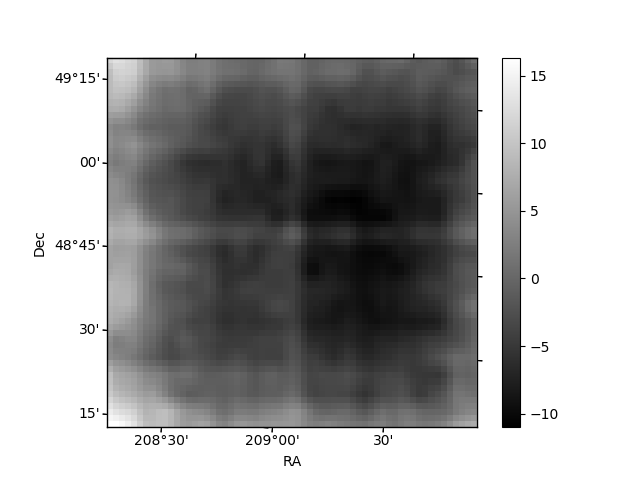
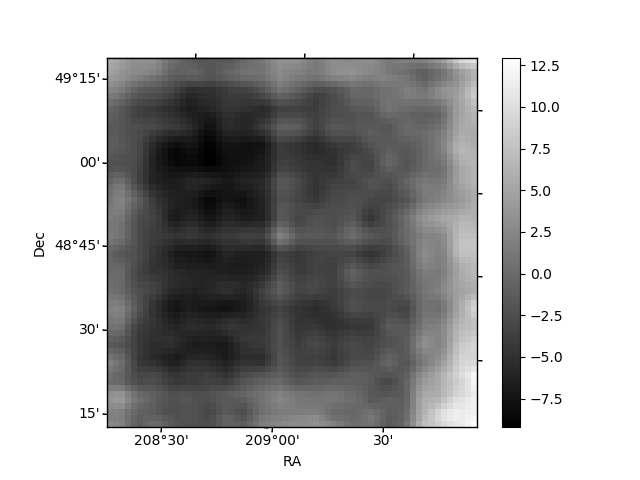
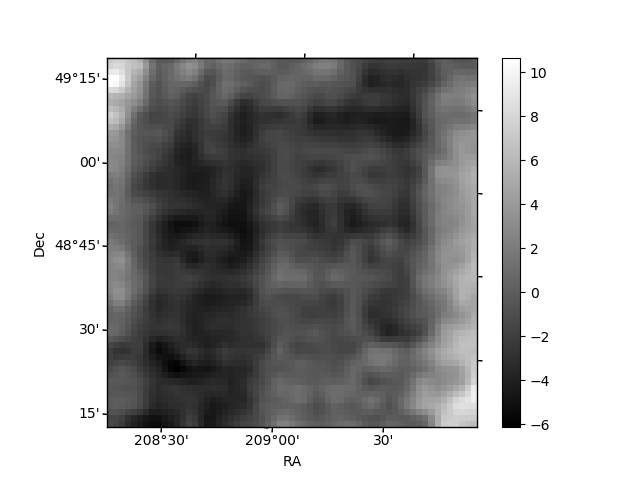
Histogram calculated using DETX and DETY for each event in the final _common_clean file
| Quadrant A | 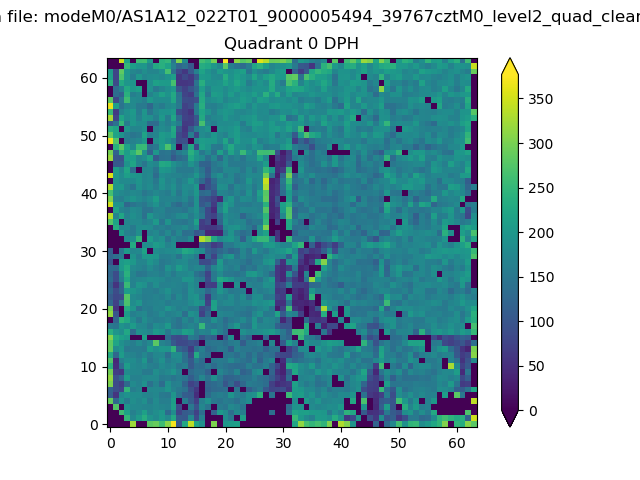 |
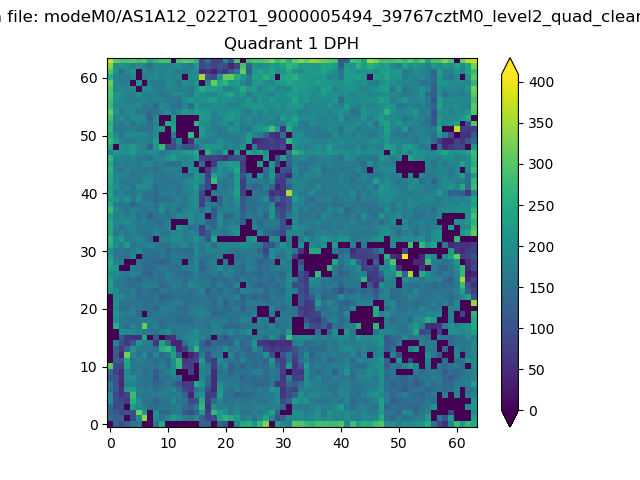 |
Quadrant B |
|---|---|---|---|
| Quadrant D | 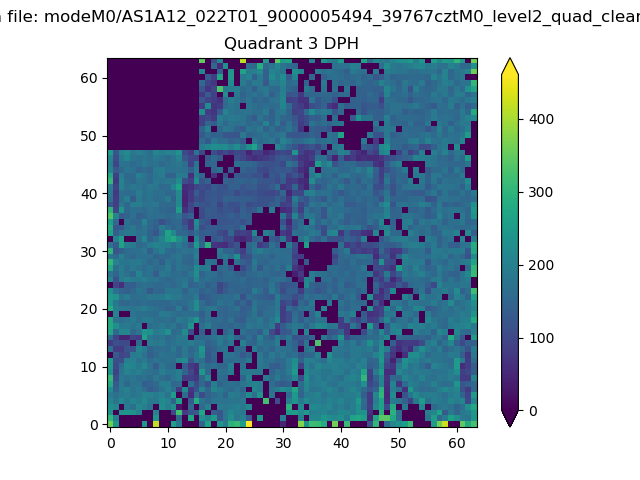 |
 |
Quadrant C |
| Plot type | Count rate plots | Images |
|---|---|---|
| Comparison with Poisson distribution Blue bars denote a histogram of data divided into 1 sec bins. Red curve is a Poisson curve with rate = median count rate of data. |
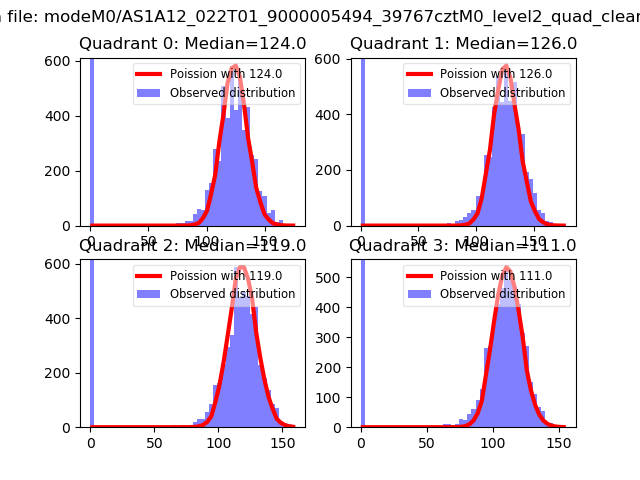 |
 |
| Quadrant-wise count rates Data is divided into 100 sec bins |
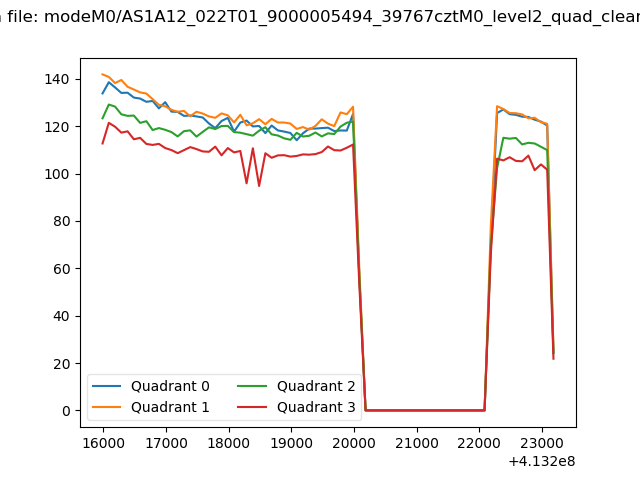 |
|
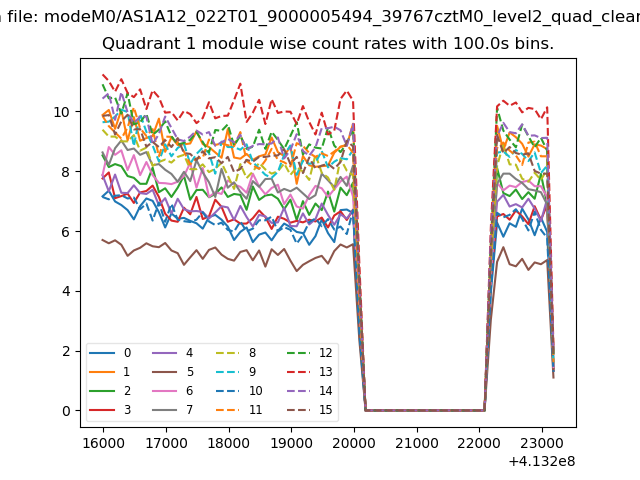
| Module-wise count rates for Quadrant A Data is divided into 100 sec bins |
 |
 |
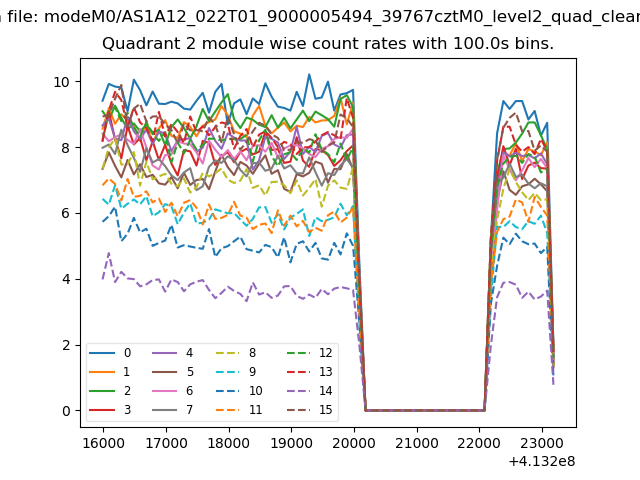
| Module-wise count rates for Quadrant B Data is divided into 100 sec bins |
 |
 |
| Module-wise count rates for Quadrant C Data is divided into 100 sec bins |
 |
 |
| Module-wise count rates for Quadrant D Data is divided into 100 sec bins |
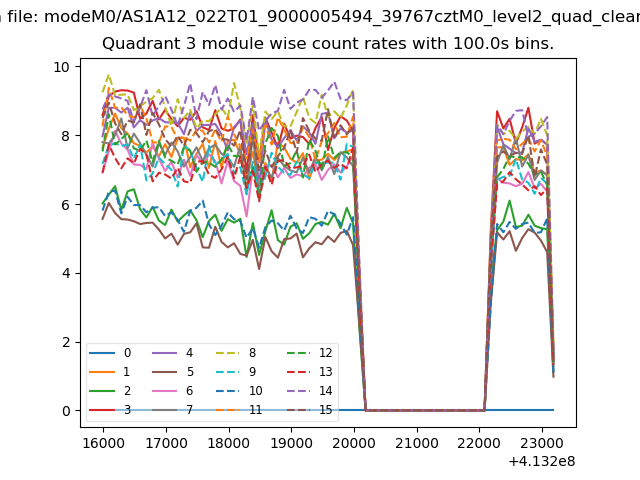 |
 |
| Parameter | Plot |
|---|---|
| CZT HV Monitor | 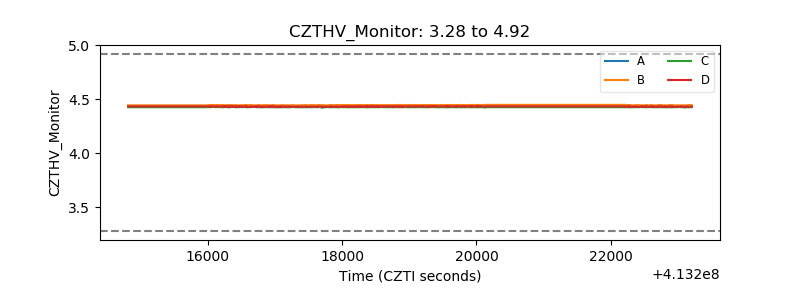 |
| D_VDD | 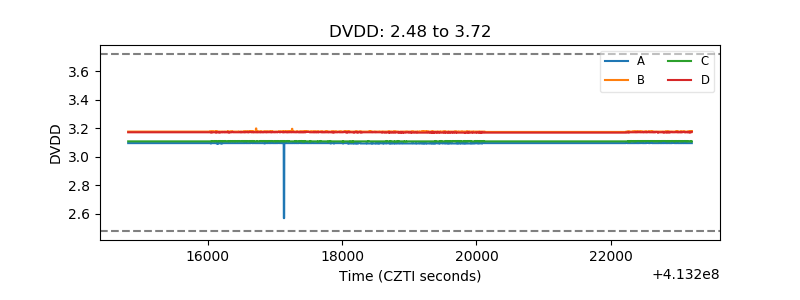 |
| Temperature 1 | 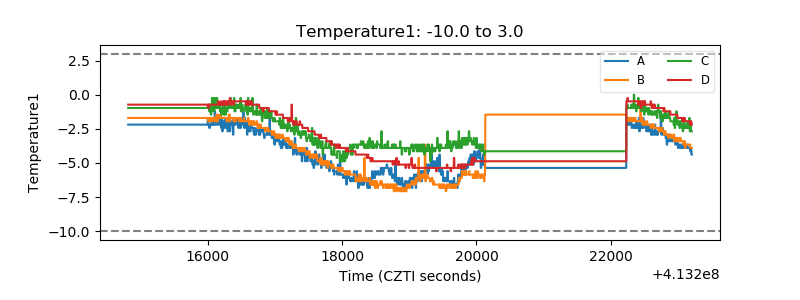 |
| Veto HV Monitor | 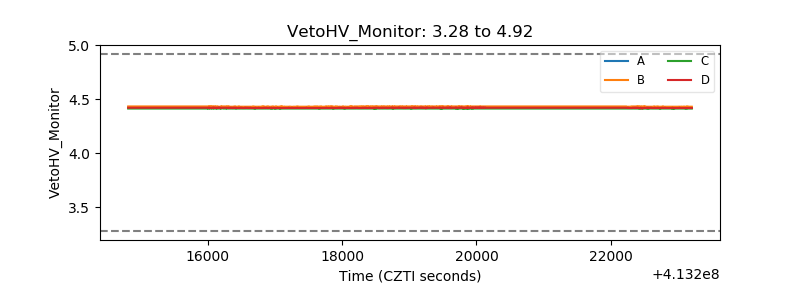 |
| Veto LLD | 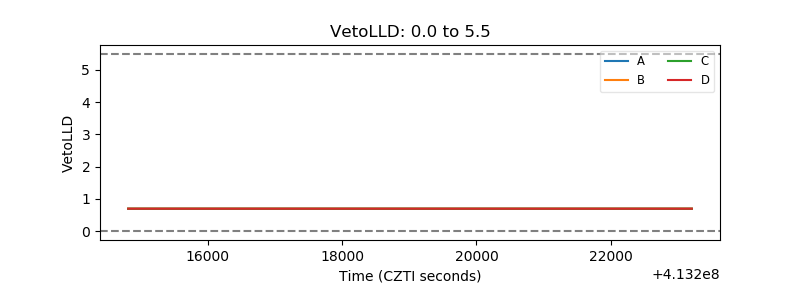 |
| Alpha Counter | 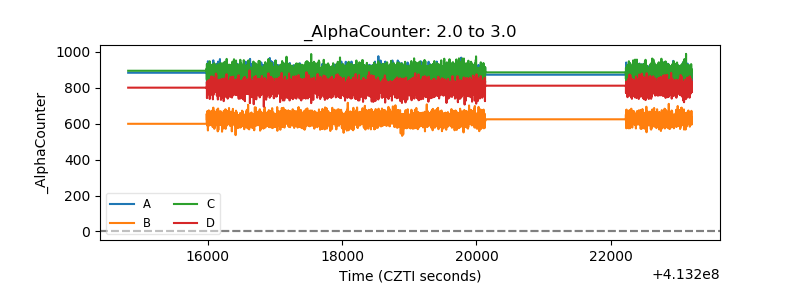 |
| _CPM_Rate | 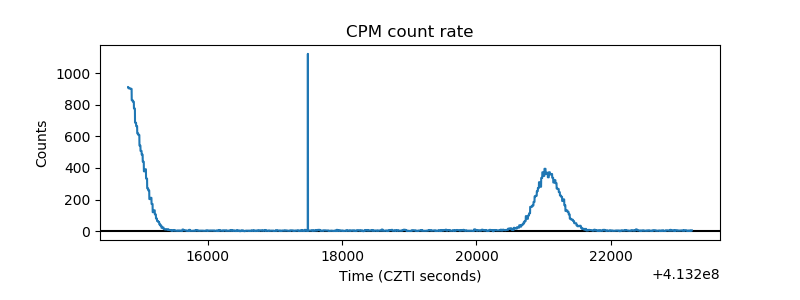 |
| CZT Counter | 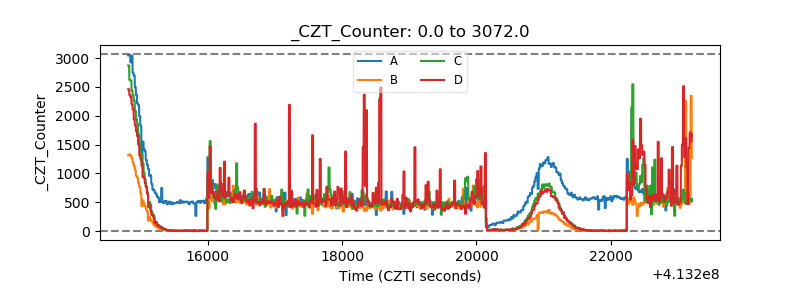 |
| +2.5 Volts monitor | 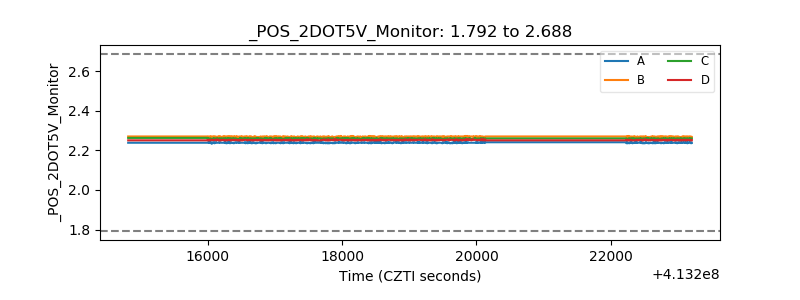 |
| +5 Volts monitor | 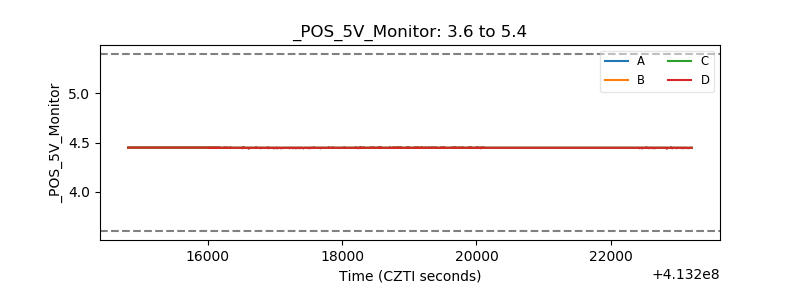 |
| _ROLL_ROT | 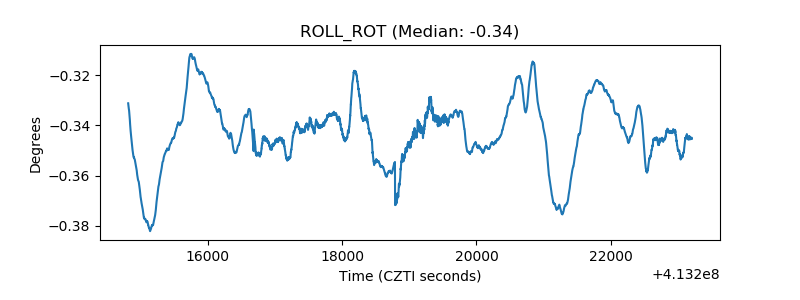 |
| _Roll_DEC | 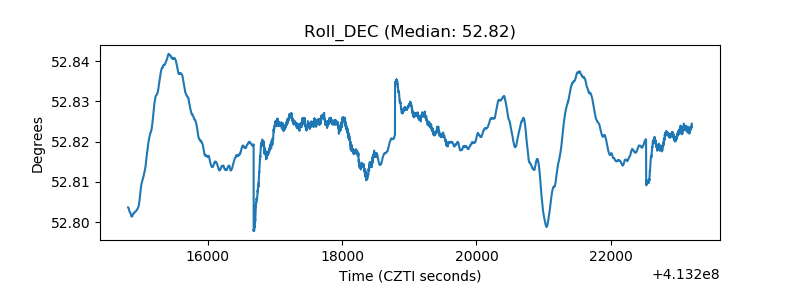 |
| _Roll_RA | 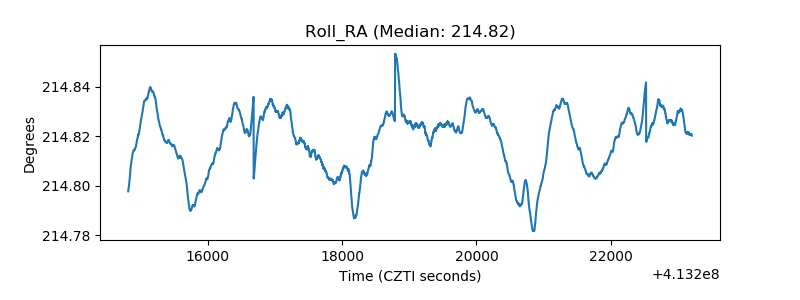 |
| Veto Counter | 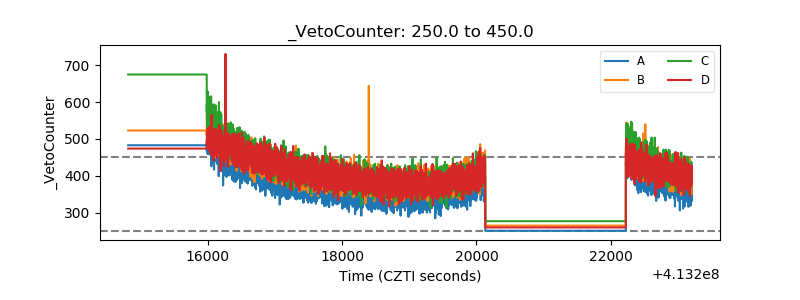 |