| Param | Original file | Final file |
|---|---|---|
| Filename | modeM0/AS1A12_022T01_9000005494_39768cztM0_level2.fits | modeM0/AS1A12_022T01_9000005494_39768cztM0_level2_quad_clean.evt |
| Size (bytes) | 361,650,240 | 89,467,200 |
| Size | 344.9 MB | 85.3 MB |
| Events in quadrant A | 2,842,148 | 610,037 |
| Events in quadrant B | 2,563,991 | 618,906 |
| Events in quadrant C | 4,002,709 | 573,834 |
| Events in quadrant D | 3,572,953 | 541,187 |
| Mode SS | |||
|---|---|---|---|
| Quadrant | BADHDUFLAG | Total packets | Discarded packets |
| A | 0 | 106 | 0 |
| B | 0 | 106 | 0 |
| C | 0 | 106 | 0 |
| D | 0 | 106 | 0 |
| Mode M0 | |||
|---|---|---|---|
| Quadrant | BADHDUFLAG | Total packets | Discarded packets |
| A | 0 | 11782 | 3 |
| B | 0 | 11162 | 2 |
| C | 0 | 15284 | 2 |
| D | 0 | 14291 | 2 |
| Mode M9 | |||
|---|---|---|---|
| Quadrant | BADHDUFLAG | Total packets | Discarded packets |
| A | 0 | 24 | 0 |
| B | 0 | 24 | 0 |
| C | 0 | 24 | 0 |
| D | 0 | 25 | 0 |
| Quadrant | Total seconds | Saturated seconds | Saturation percentage |
|---|---|---|---|
| A | 5211 | 27 | 0.518135% |
| B | 5211 | 22 | 0.422184% |
| C | 5211 | 163 | 3.127998% |
| D | 5211 | 108 | 2.072539% |
Noise dominated data is calculated using 1-second bins in cleaned event files. If a bin has >2000 counts, and if more than 50% of those come from <1% of pixels, then it is considered to be noise-dominated and hence unusable.
| Quadrant | # 1 sec bins | Bins with >0 counts | Bins with >2000 counts | High rate bins dominated by noise | Noise dominated (total time) | Noise dominated (detector-on time) | Marked lightcurve |
|---|---|---|---|---|---|---|---|
| A | 7124 | 5212 | 17 | 17 | 0.24% | 0.33% | 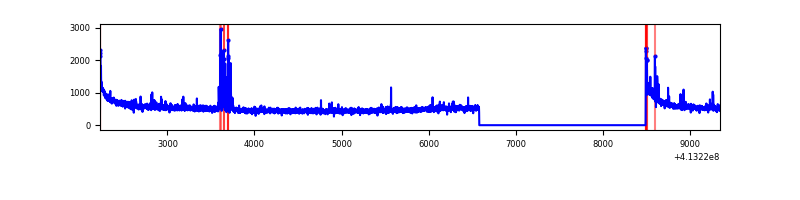 |
| B | 7124 | 5212 | 11 | 11 | 0.15% | 0.21% | 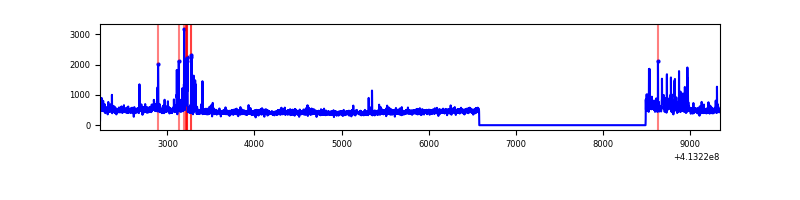 |
| C | 7124 | 5212 | 172 | 172 | 2.41% | 3.30% | 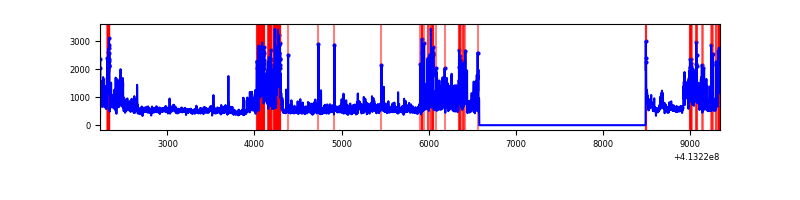 |
| D | 7124 | 5212 | 93 | 93 | 1.31% | 1.78% | 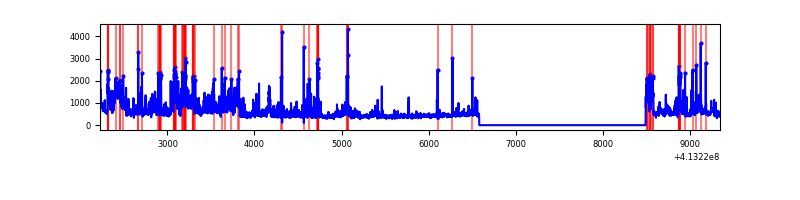 |
Top three noisy pixels from each quadrant. If the there are fewer than three noisy pixels in the level2.evt file, extra rows are filled as -1
| Pixel properties | Quadrant properties | ||||||
|---|---|---|---|---|---|---|---|
| Quadrant | DetID | PixID | Counts | Sigma | Mean | Median | Sigma |
| A | 10 | 83 | 470678 | 3945.07 | 578 | 567 | 119.2 |
| A | 13 | 248 | 98530 | 822.08 | 578 | 567 | 119.2 |
| A | 2 | 79 | 16221 | 131.36 | 578 | 567 | 119.2 |
| B | 5 | 255 | 90390 | 807.48 | 577 | 561 | 111.2 |
| B | 4 | 251 | 55785 | 496.41 | 577 | 561 | 111.2 |
| B | 5 | 32 | 52525 | 467.11 | 577 | 561 | 111.2 |
| C | 15 | 208 | 1532715 | 11714.39 | 562 | 565 | 130.8 |
| C | 15 | 214 | 213768 | 1630.09 | 562 | 565 | 130.8 |
| C | 3 | 233 | 19762 | 146.77 | 562 | 565 | 130.8 |
| D | 12 | 227 | 1035462 | 7416.12 | 565 | 548 | 139.5 |
| D | 13 | 249 | 68093 | 484.02 | 565 | 548 | 139.5 |
| D | 12 | 233 | 56671 | 402.17 | 565 | 548 | 139.5 |
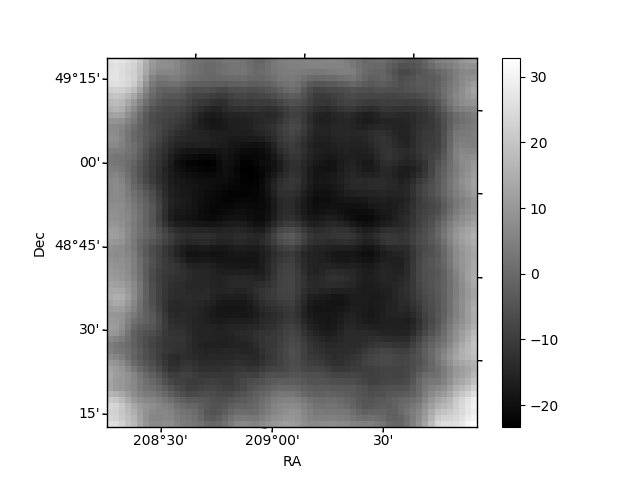
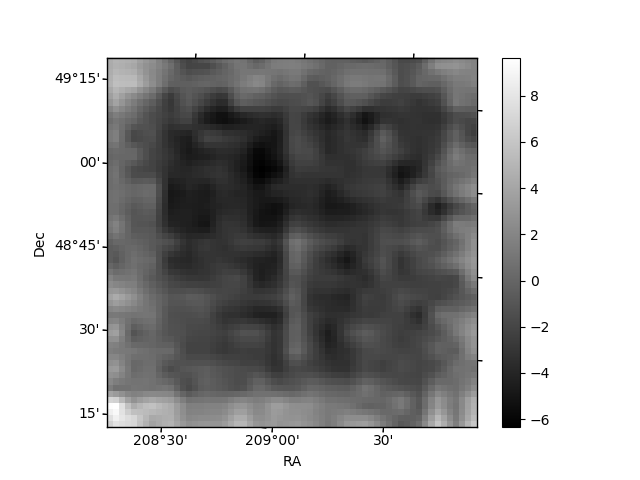
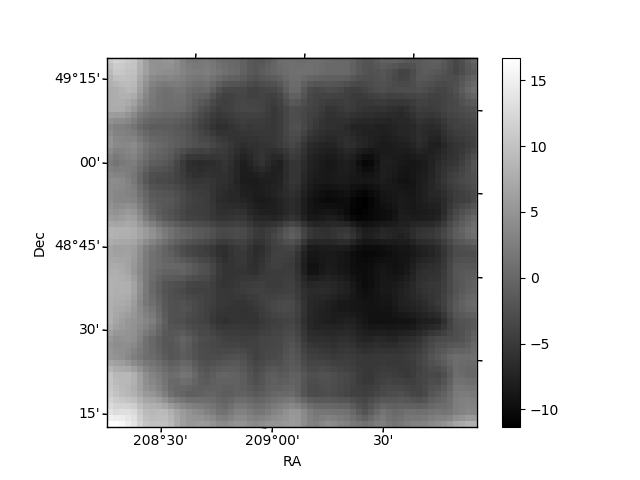
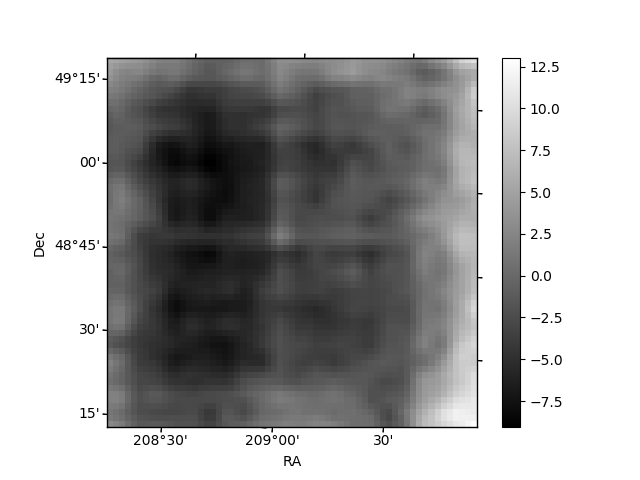
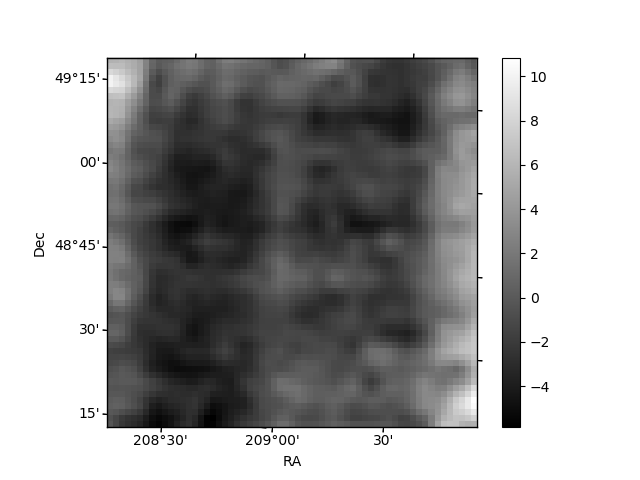
Histogram calculated using DETX and DETY for each event in the final _common_clean file
| Quadrant A | 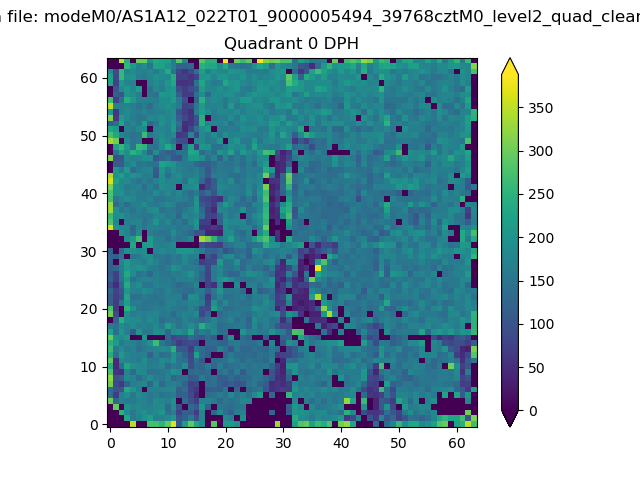 |
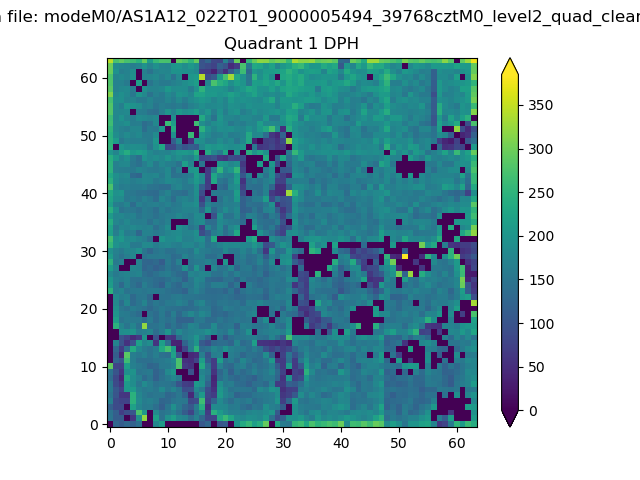 |
Quadrant B |
|---|---|---|---|
| Quadrant D | 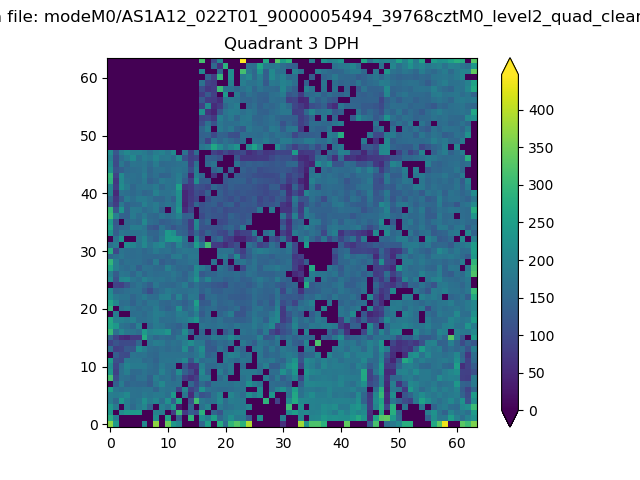 |
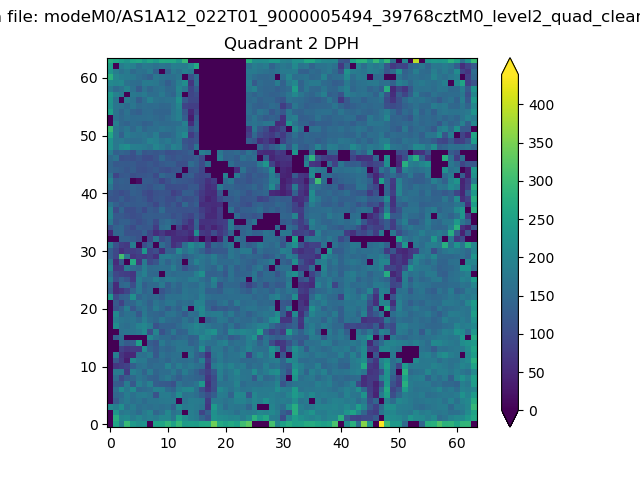 |
Quadrant C |
| Plot type | Count rate plots | Images |
|---|---|---|
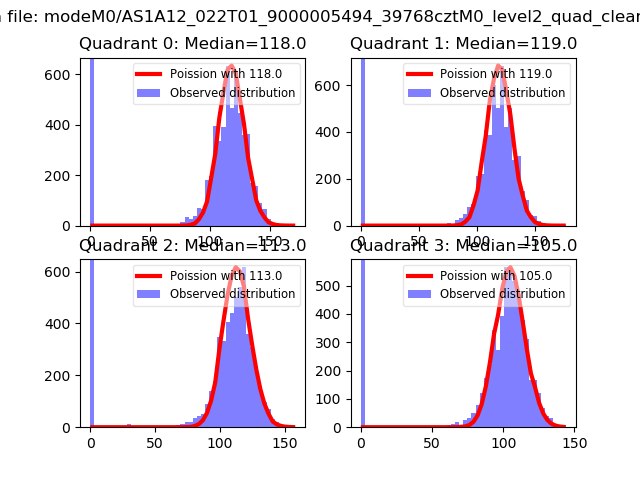
| Comparison with Poisson distribution Blue bars denote a histogram of data divided into 1 sec bins. Red curve is a Poisson curve with rate = median count rate of data. |
 |
 |
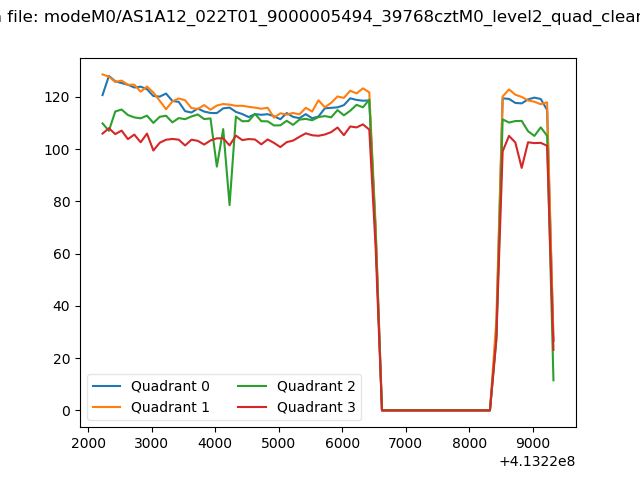
| Quadrant-wise count rates Data is divided into 100 sec bins |
 |
|
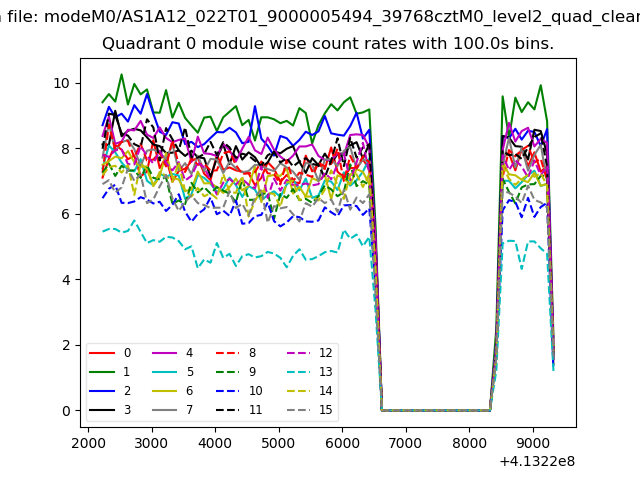
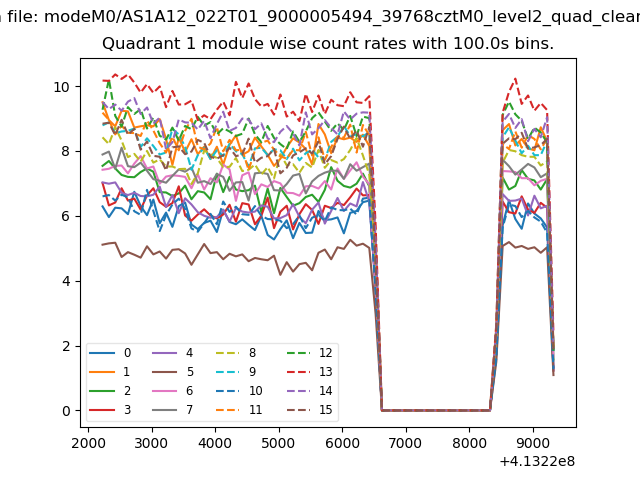
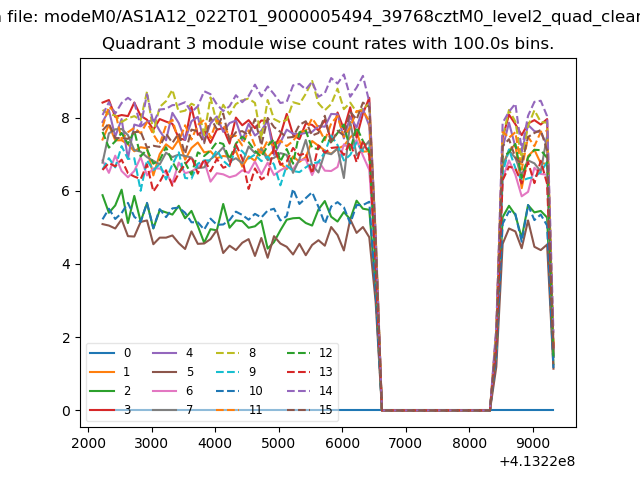
| Module-wise count rates for Quadrant A Data is divided into 100 sec bins |
 |
 |
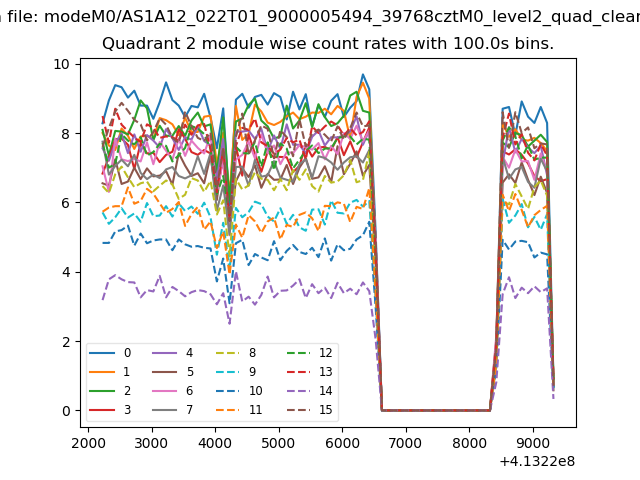
| Module-wise count rates for Quadrant B Data is divided into 100 sec bins |
 |
 |
| Module-wise count rates for Quadrant C Data is divided into 100 sec bins |
 |
 |
| Module-wise count rates for Quadrant D Data is divided into 100 sec bins |
 |
 |
| Parameter | Plot |
|---|---|
| CZT HV Monitor | 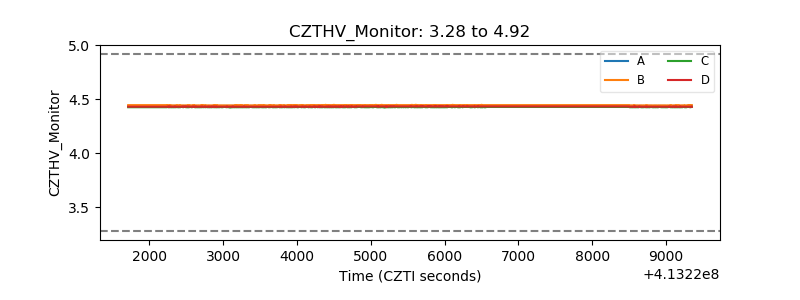 |
| D_VDD | 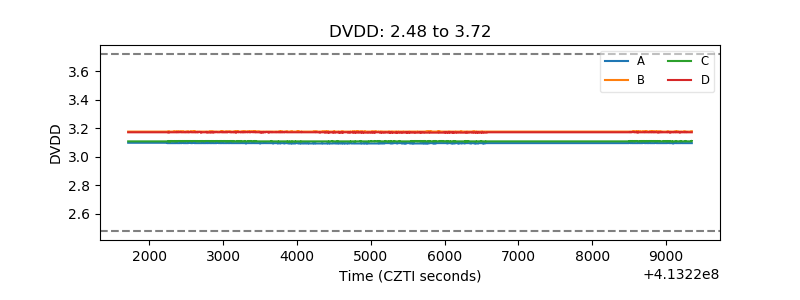 |
| Temperature 1 | 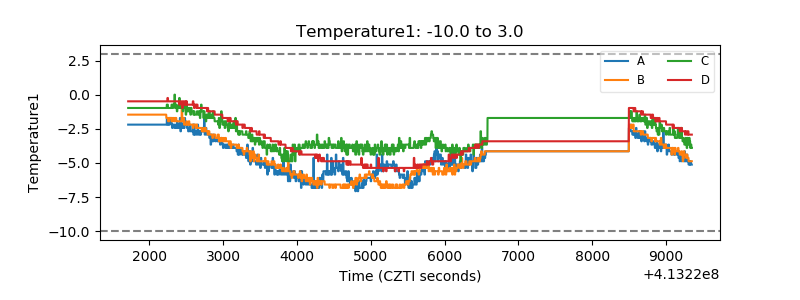 |
| Veto HV Monitor | 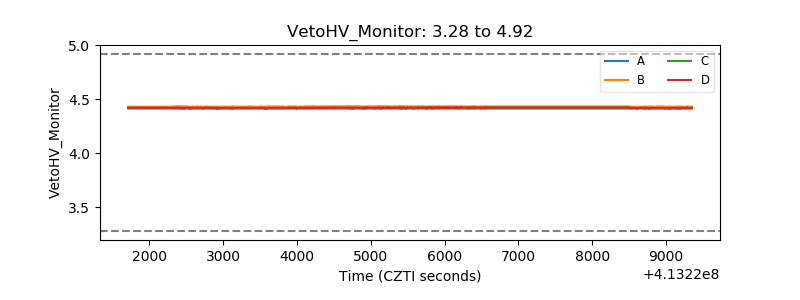 |
| Veto LLD | 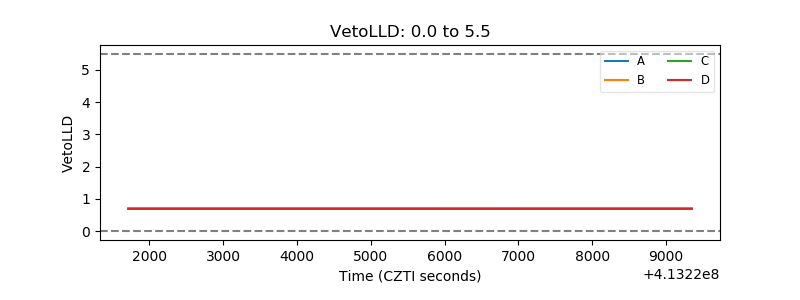 |
| Alpha Counter | 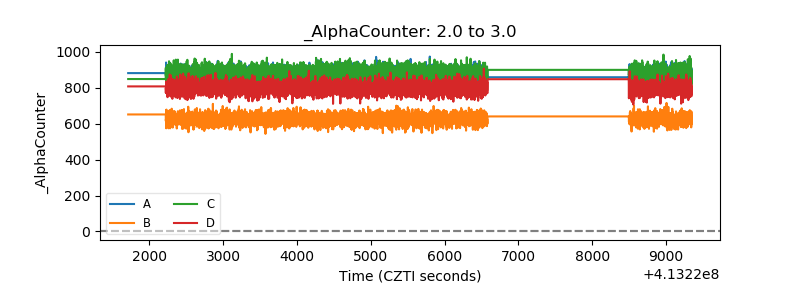 |
| _CPM_Rate | 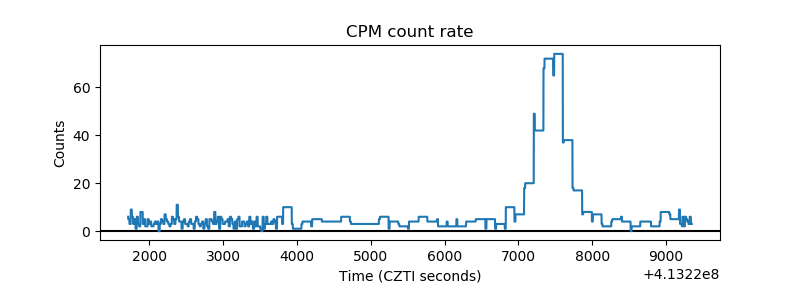 |
| CZT Counter | 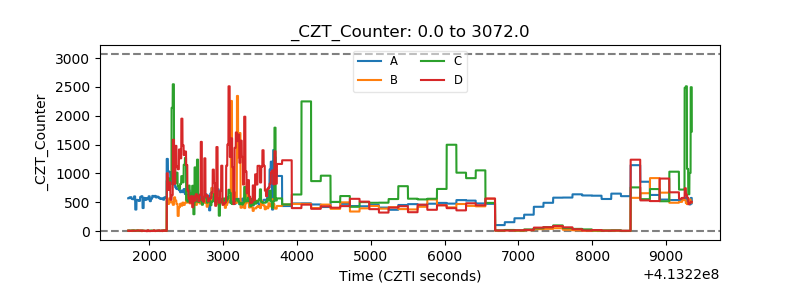 |
| +2.5 Volts monitor |  |
| +5 Volts monitor | 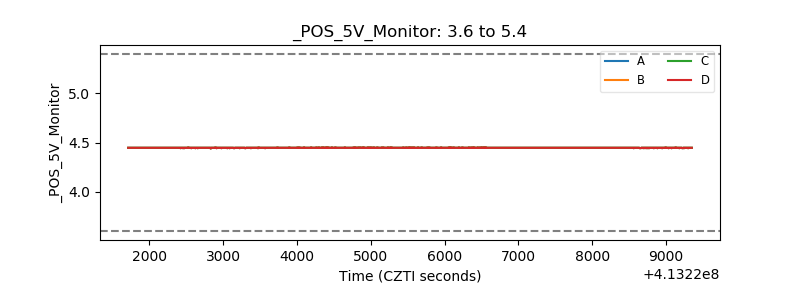 |
| _ROLL_ROT | 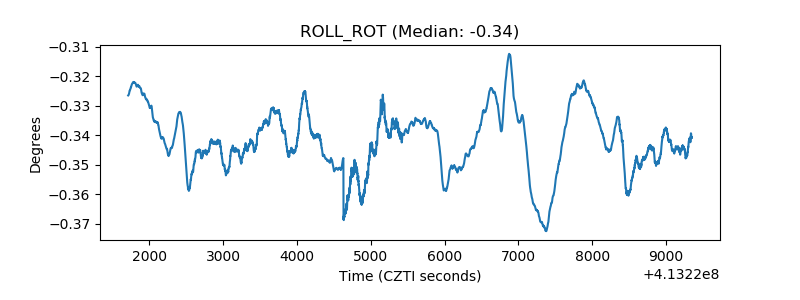 |
| _Roll_DEC | 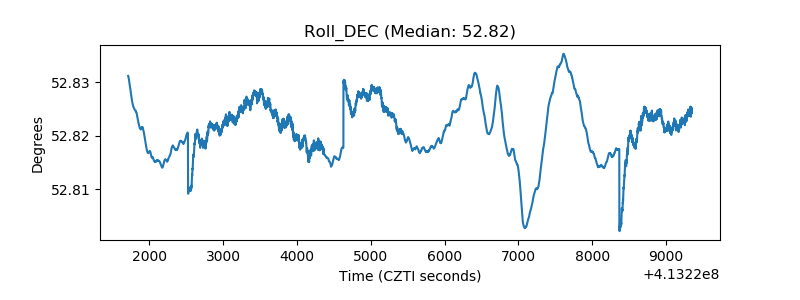 |
| _Roll_RA | 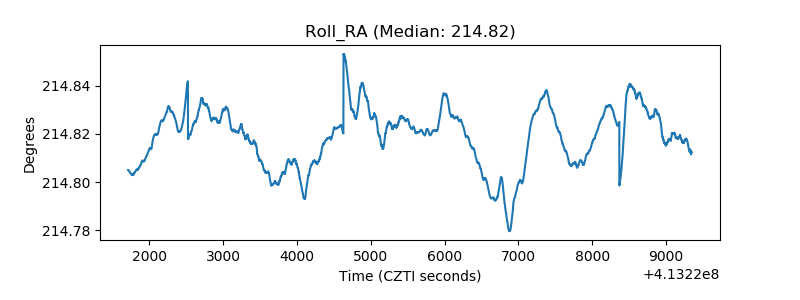 |
| Veto Counter | 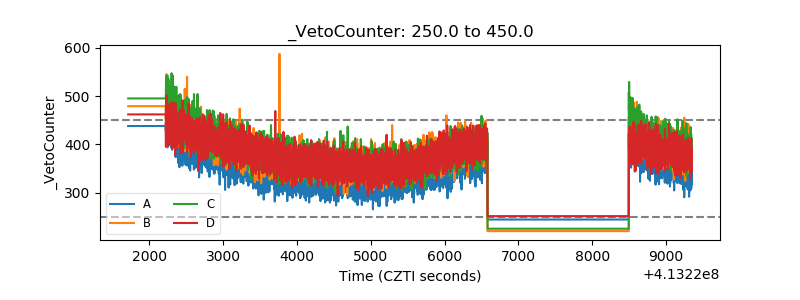 |